Blog

  • Kubernetes Deployment Strategies: A Technical Guide to Modern Release Techniques

    Kubernetes Deployment Strategies: A Technical Guide to Modern Release Techniques

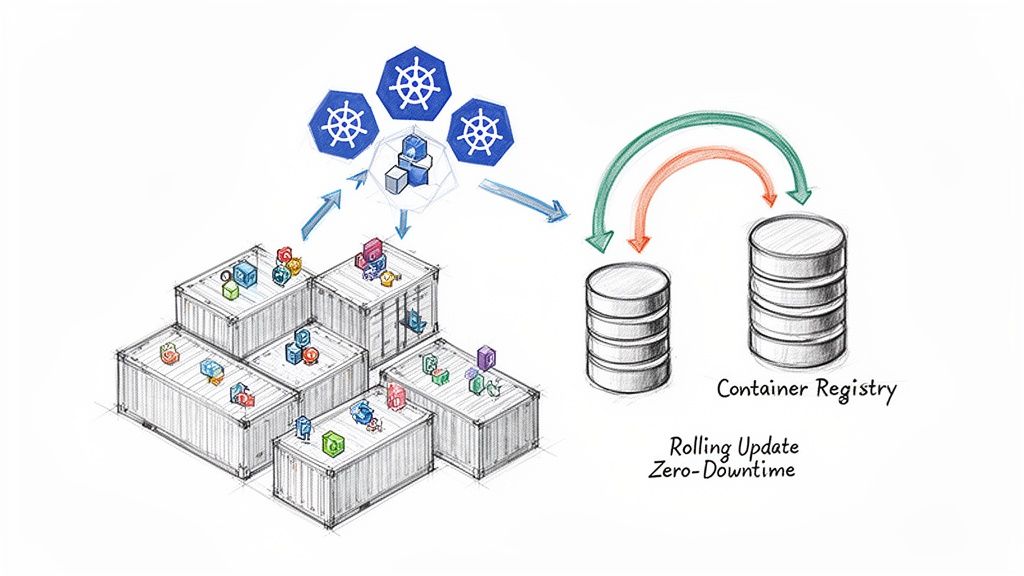
    Kubernetes deployment strategies are the methodologies used to upgrade a running application to a new version. The choice of strategy dictates the trade-offs between release velocity, risk exposure, and resource consumption during an update.

    Selecting the appropriate strategy is a critical architectural decision. A default RollingUpdate is suitable for many stateless applications where temporary version mixing is acceptable. However, for a critical service update, a Canary release is superior, as it allows for validating the new version with a small percentage of live traffic before proceeding. This decision directly impacts system reliability and the end-user experience.

    Why Your Kubernetes Deployment Strategy Matters

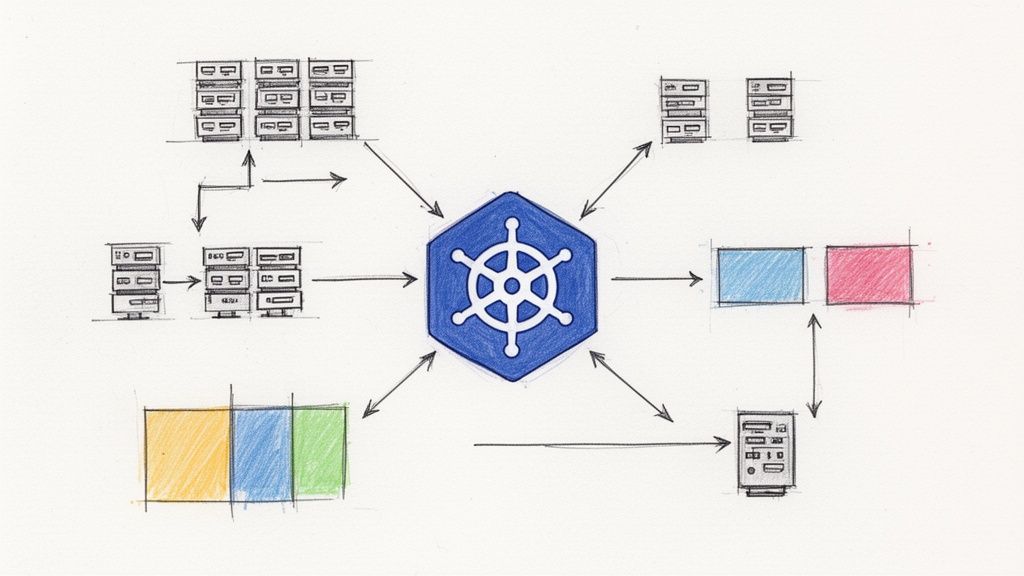
    In cloud-native architectures, application deployment is a sophisticated process that extends far beyond a simple stop-and-start update. The chosen strategy is a fundamental operational decision that defines how the system behaves during a version change.

    The core tension is between deployment velocity and production stability. An ill-suited strategy can introduce downtime, user-facing errors, or catastrophic failures. Conversely, the right strategy, properly automated, empowers engineering teams to ship features with higher frequency and confidence.

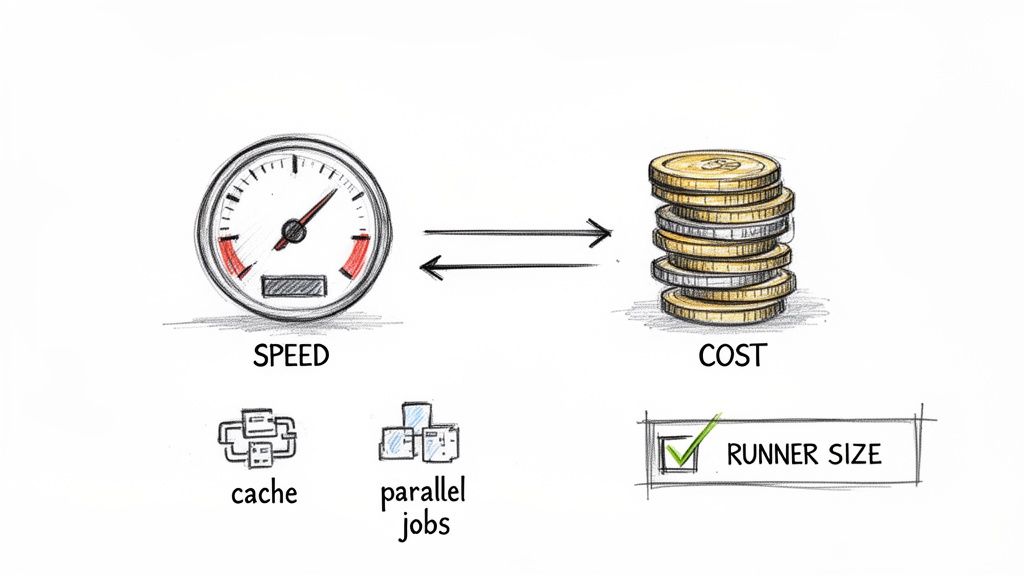
    The Core Trade-Offs: Speed, Risk, and Cost

    Every deployment strategy involves a trade-off between three primary factors. A clear understanding of these is the first step toward selecting the right approach for a given workload.

    • Speed: The time required to fully roll out a new version. A Recreate deployment is fast to execute but incurs downtime.
    • Risk: The potential impact radius if the new version contains a critical bug. Strategies like Canary and Blue/Green are designed to minimize this blast radius.
    • Cost: The additional compute and memory resources required during the update process. A Blue/Green deployment, for example, doubles the resource footprint of the application for the duration of the deployment.

    This chart visualizes the decision matrix for these trade-offs.

    Flowchart detailing a Kuburrentes strategy guide, outlining deployment decisions based on speed, cost, data sensitivity, and resource optimization leading to various outcomes.

    As shown, advanced strategies typically exchange higher resource cost and operational complexity for lower risk and zero downtime. This guide provides the technical details required to implement each of these strategies effectively.

    A Quick Guide to Kubernetes Deployment Strategies

    This table offers a high-level comparison of the most common deployment strategies, functioning as a quick reference for their respective trade-offs and ideal technical scenarios.

    Strategy Downtime Resource Cost Ideal Use Case
    Recreate Yes Low Development environments, batch jobs, or applications where downtime is acceptable.
    Rolling Update No Low Stateless applications where running mixed versions temporarily is not problematic.
    Blue/Green No High Critical stateful or stateless applications requiring instant rollback and zero downtime.
    Canary No Medium Validating new features or backend changes with a small subset of live traffic before a full rollout.
    A/B Testing No Medium Comparing multiple feature variations against user segments to determine which performs better against business metrics.
    Shadow No High Performance and error testing a new version with real production traffic without impacting users.

    This table serves as a starting point. The following sections provide a detailed technical breakdown of each strategy.

    The Foundational Strategies: Recreate and Rolling Updates

    Kubernetes provides two native deployment strategies implemented directly within the Deployment controller: Recreate and Rolling Update. These are the foundational patterns upon which more advanced strategies are built. A thorough understanding of their mechanics is essential before adopting more complex release patterns.

    Visualizing Kubernetes Recreate strategy with full replacement versus a Rolling Update with gradual transition.

    The Recreate Strategy Explained

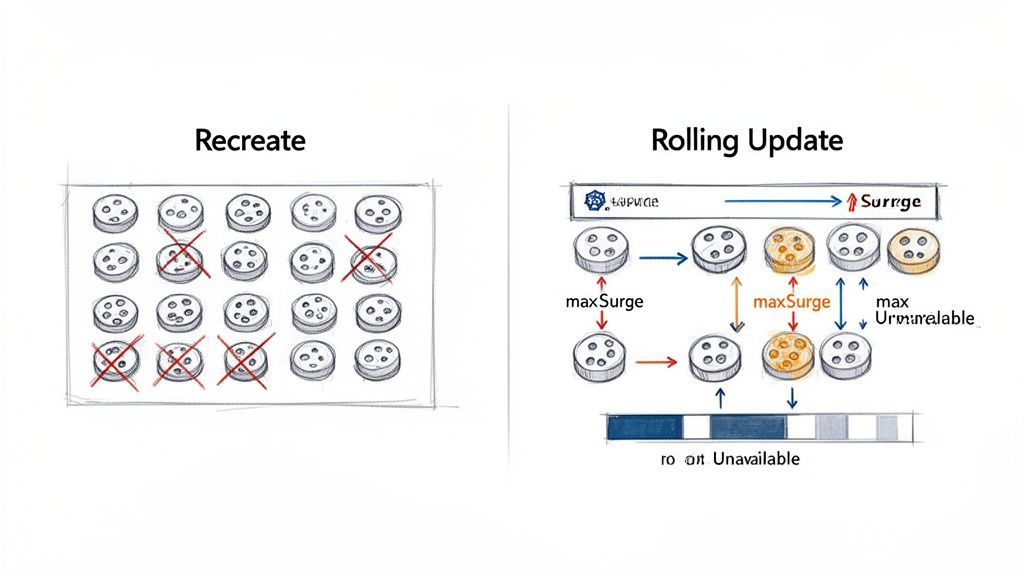
    The Recreate strategy is the most straightforward but also the most disruptive. It follows a "terminate-then-launch" sequence: all running pods for the current version are terminated before any pods for the new version are created. This ensures that only one version of the application is ever running, eliminating any potential for version incompatibility issues.

    The primary trade-off is guaranteed downtime. A service outage occurs during the interval between the termination of the old pods and the new pods becoming ready to serve traffic.

    This makes the Recreate strategy unsuitable for most production, user-facing services. Its use is typically confined to development environments or for workloads that can tolerate interruptions, such as background processing jobs or periodic batch tasks.

    The core principle of the Recreate strategy is "stop-before-start." It prioritizes version consistency over availability, making it a predictable but high-impact method for updates.

    Implementation requires a single line in the Deployment manifest.

    apiVersion: apps/v1
    kind: Deployment
    metadata:
      name: my-app-deployment
    spec:
      replicas: 3
      strategy:
        type: Recreate # Specifies the deployment strategy
      template:
        metadata:
          labels:
            app: my-app
        spec:
          containers:
          - name: my-app-container
            image: my-app:v2 # The new container image version
    

    The Rolling Update Strategy

    The Rolling Update is the default deployment strategy for Kubernetes Deployments. It provides a graceful, zero-downtime update by incrementally replacing old pods with new ones. The controller ensures that a minimum number of application instances remain available to serve traffic throughout the process.

    The sequence is managed carefully: Kubernetes creates a new pod, waits for it to pass its readiness probe, and only then terminates one of the old pods. This cycle repeats until all old pods are replaced.

    This incremental approach offers a strong balance between update velocity and service availability, making it the standard for a vast number of stateless applications.

    Fine-Tuning Your Rollout

    Kubernetes provides two parameters within the rollingUpdate spec to fine-tune the behavior of the update: maxUnavailable and maxSurge.

    • maxUnavailable: Defines the maximum number of pods that can be unavailable during the update. This can be specified as an absolute number (e.g., 1) or a percentage (e.g., 25%). A lower value ensures higher availability at the cost of a slower rollout.
    • maxSurge: Defines the maximum number of additional pods that can be created above the desired replica count. This can also be an absolute number or a percentage. This allows the controller to create new pods before terminating old ones, accelerating the rollout at the cost of temporarily increased resource consumption.

    Here is a practical configuration example:

    apiVersion: apps/v1
    kind: Deployment
    metadata:
      name: my-app-deployment
    spec:
      replicas: 10
      strategy:
        type: RollingUpdate
        rollingUpdate:
          maxUnavailable: 1 # Guarantees at most 1 pod is down at any time
          maxSurge: 2       # Allows up to 2 extra pods (12 total) during the update
    

    With these settings for a 10-replica Deployment, Kubernetes ensures that at least 9 pods (10 - 1) are always available. It may temporarily scale up to 12 pods (10 desired + 2 surge) to expedite the update. You can monitor the progress of the rollout using kubectl rollout status deployment/my-app-deployment.

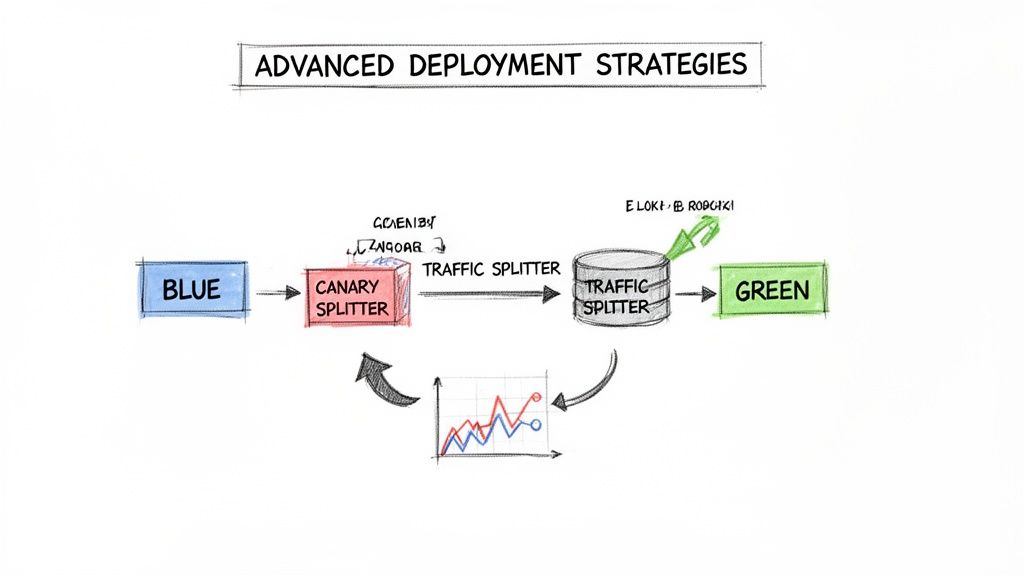
    Achieving Flawless Releases with Blue/Green Deployments

    While a Rolling Update minimizes downtime, it creates a period where both old and new application versions are running concurrently. This can introduce subtle bugs or compatibility issues. For mission-critical applications requiring instant, predictable rollbacks and zero risk of version mixing, the Blue/Green deployment strategy is the superior choice.

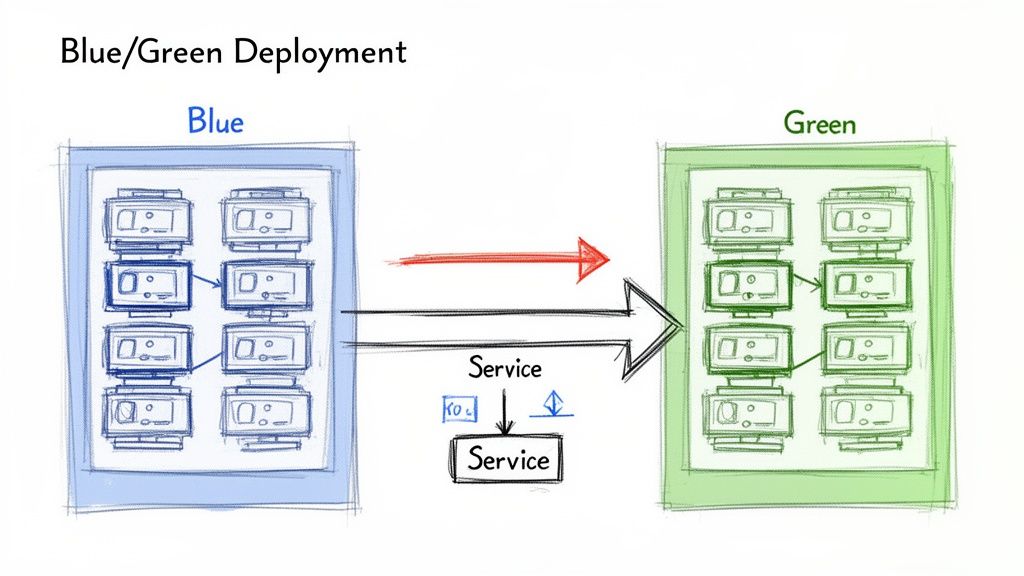
    The concept involves maintaining two identical, isolated production environments, designated 'Blue' (current version) and 'Green' (new version). At any given time, live traffic is directed to only one environment—for example, Blue. The Green environment remains idle or is used for final-stage testing.

    When a new version is ready for release, it is deployed to the idle Green environment. This allows for comprehensive testing—smoke tests, integration tests, and performance validation—against a production-grade stack without affecting any users.

    Once the Green environment is fully validated, a routing change instantly redirects all live traffic from Blue to Green.

    A diagram illustrating the Blue/Green deployment strategy, showing traffic switching between blue and green server environments.

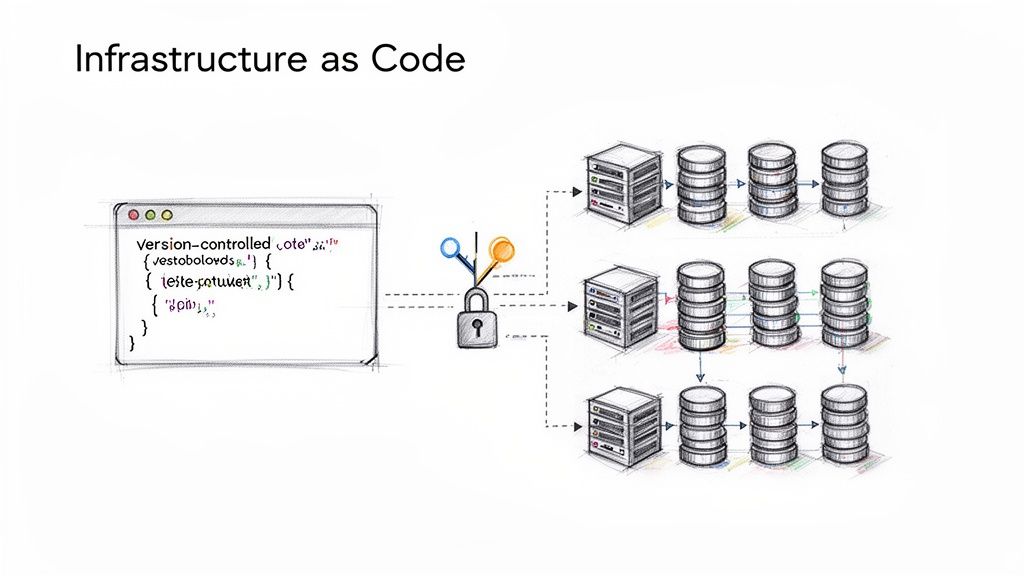
    Implementing Blue/Green with Kubernetes Services

    In Kubernetes, Blue/Green deployments are implemented by manipulating the label selectors of a Service. A Kubernetes Service provides a stable endpoint for an application, routing traffic to pods matching its selector. The strategy hinges on atomically updating this selector to point from the Blue deployment to the Green deployment.

    This requires two separate Deployment manifests, differing only by a version label.

    The Blue Deployment for version v1.0.0:

    apiVersion: apps/v1
    kind: Deployment
    metadata:
      name: my-app-blue
    spec:
      replicas: 3
      selector:
        matchLabels:
          app: my-app
          version: v1.0.0
      template:
        metadata:
          labels:
            app: my-app
            version: v1.0.0 # Blue version label
        spec:
          containers:
          - name: my-app-container
            image: my-app:v1.0.0
    

    The Green Deployment for the new version v2.0.0:

    apiVersion: apps/v1
    kind: Deployment
    metadata:
      name: my-app-green
    spec:
      replicas: 3
      selector:
        matchLabels:
          app: my-app
          version: v2.0.0
      template:
        metadata:
          labels:
            app: my-app
            version: v2.0.0 # Green version label
        spec:
          containers:
          - name: my-app-container
            image: my-app:v2.0.0
    

    The Service initially directs traffic to the Blue deployment.

    apiVersion: v1
    kind: Service
    metadata:
      name: my-app-service
    spec:
      selector:
        app: my-app
        version: v1.0.0 # Initially targets the Blue deployment
      ports:
        - protocol: TCP
          port: 80
          targetPort: 8080
    

    To execute the cutover, you patch the Service to change its selector. The command kubectl patch service my-app-service -p '{"spec":{"selector":{"version":"v2.0.0"}}}' atomically updates the selector.version field from v1.0.0 to v2.0.0, rerouting all traffic instantly.

    Benefits and Drawbacks of Blue/Green

    The benefits of this Kubernetes deployment strategy are significant for stability-focused teams.

    • Zero Downtime: The traffic switch is atomic and transparent to users.
    • Instant Rollback: If issues are detected in the Green environment, rollback is achieved by patching the Service selector back to the Blue version.
    • Production Testing: The new release can be fully validated in an isolated, production-identical environment before receiving live traffic.

    This reliability is crucial. With 66% of organizations now running Kubernetes in production according to the CNCF Annual Survey 2023, robust deployment automation is a necessity.

    The main drawback is cost. A Blue/Green deployment requires you to run double the infrastructure for the duration of the release process, which can be expensive.

    The primary disadvantage is resource cost, as it requires enough cluster capacity for two full production environments simultaneously. This can be mitigated with cluster autoscaling or by treating the old Blue environment as the staging ground for the next release. For a deeper look, see our guide on the essentials of a Blue/Green deployment.

    Minimizing Risk with Canary and Progressive Delivery

    Blue/Green deployments provide a strong safety net, but the all-or-nothing traffic cutover can still be high-stakes. If a latent bug exists, 100% of users are exposed simultaneously. Canary deployments offer a more gradual, data-driven approach to de-risking releases by exposing the new version to a small subset of users first.

    The strategy involves routing a small percentage of live traffic (e.g., 5%) to the new version (the "canary") while the majority remains on the stable version. Key performance indicators (KPIs) like error rates, latency, and resource utilization are monitored for the canary instances.

    A visual explanation of canary deployment, showing 95% stable traffic and 5% canary traffic monitored by a graph.

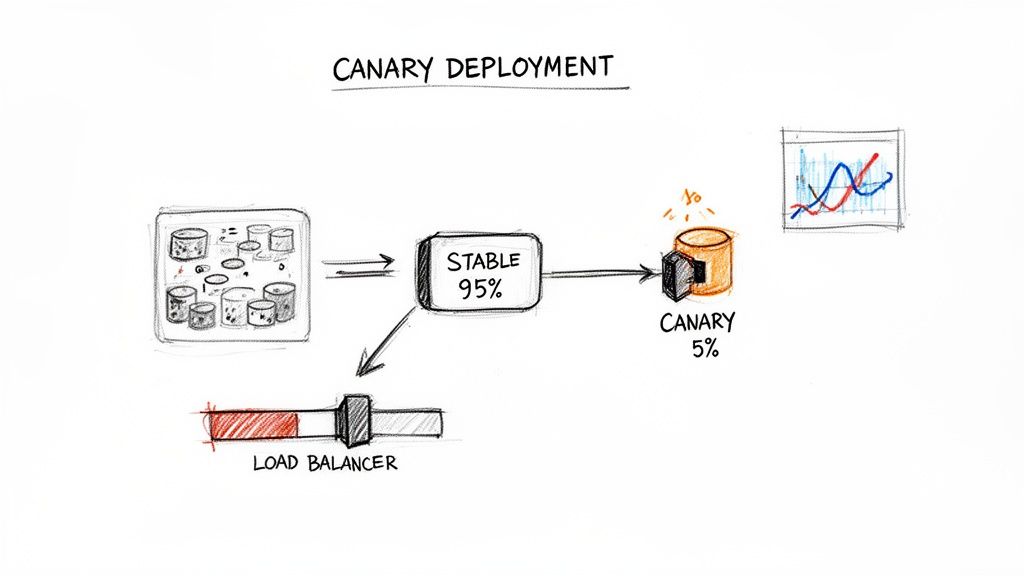
    If the canary performs as expected, traffic is incrementally shifted to the new version until it handles 100% of requests. This "test in production" methodology validates changes with real user traffic, minimizing the blast radius of any potential issues.

    Implementing Canary with a Service Mesh

    Native Kubernetes objects do not support fine-grained, percentage-based traffic splitting. This functionality requires an advanced networking layer, typically provided by a service mesh like Istio or Linkerd, or a capable ingress controller. These tools provide the necessary traffic management capabilities.

    With Istio, this is achieved using a VirtualService Custom Resource Definition (CRD). You deploy both the stable and canary versions as separate Deployments and then use a VirtualService to precisely route traffic between them based on weights.

    This VirtualService manifest routes 90% of traffic to the stable v1 and 10% to the canary v2:

    apiVersion: networking.istio.io/v1beta1
    kind: VirtualService
    metadata:
      name: my-app-virtualservice
    spec:
      hosts:
        - my-app-service
      http:
      - route:
        - destination:
            host: my-app-service
            subset: v1
          weight: 90 # 90% of traffic to stable
        - destination:
            host: my-app-service
            subset: v2
          weight: 10 # 10% of traffic to canary
    

    Based on monitoring data, an operator can update the weights to 50/50, then 0/100 to complete the rollout. If issues arise, setting the v1 weight back to 100 executes an instant rollback.

    Progressive Delivery with Argo Rollouts

    Manual management of Canary deployments is error-prone. Progressive Delivery tools like Argo Rollouts automate this process. Argo Rollouts introduces a Rollout CRD, an alternative to the standard Deployment object, which orchestrates advanced deployment strategies like Canary and Blue/Green.

    Argo Rollouts automates Canary releases by linking the traffic shifting process directly to performance metrics. It can query a monitoring system like Prometheus and automatically promote or roll back the release based on the results, removing manual guesswork.

    The entire release strategy is defined declaratively within the Rollout manifest, including traffic percentages, pauses for analysis, and success criteria based on metrics. Argo Rollouts integrates with service meshes and ingress controllers to manipulate traffic and with observability tools like Prometheus to perform automated analysis.

    Consider this Rollout manifest snippet:

    apiVersion: argoproj.io/v1alpha1
    kind: Rollout
    metadata:
      name: my-app-rollout
    spec:
      strategy:
        canary:
          steps:
          - setWeight: 10
          - pause: { duration: 5m } # Wait 5 minutes for metrics to stabilize
          - setWeight: 25
          - pause: {} # Pause indefinitely until manually promoted
    

    This configuration defines a multi-step rollout, providing opportunities for observation at each stage. This makes advanced deployment strategies more accessible and significantly safer.

    Canary vs. A/B Testing

    While both involve traffic splitting, Canary deployments and A/B testing serve different purposes.

    • Canary Deployments are for technical risk mitigation. The goal is to validate the stability and performance of a new software version under production load. Traffic is typically split randomly by percentage.
    • A/B Testing is for business hypothesis validation. The goal is to compare different feature variations to determine which one better achieves a business outcome (e.g., higher conversion rate). Traffic is routed based on user attributes (e.g., cookies, headers). A/B testing often relies on effective feature toggle management.

    Enterprise Kubernetes adoption has reached 96%, and Kubernetes now holds a 92% market share in orchestration. You can discover more insights about Kubernetes adoption trends on Edge Delta. This widespread adoption drives the need for safer, automated release practices like Canary deployments.

    Validating New Code with Shadow Deployments

    A Shadow Deployment (or traffic mirroring) is an advanced strategy for testing a new application version with live production traffic without affecting end-users. It offers the highest fidelity for pre-release validation.

    The mechanism involves deploying the new "shadow" version alongside the stable production version. The networking layer is configured to send a copy of live production traffic to the shadow service. The shadow service processes these requests, but its responses are discarded. Users only ever receive responses from the stable version, making the entire test invisible and risk-free.

    This provides invaluable data on how the new code performs under real-world load and with real data patterns, allowing teams to analyze performance, check for errors, and validate behavior before a full rollout.

    How Shadow Deployments Work in Kubernetes

    Standard Kubernetes objects lack the capability for traffic mirroring. This functionality is a feature of advanced networking layers provided by a service mesh like Istio. Istio's traffic management features allow for the creation of sophisticated routing rules to duplicate requests.

    The setup requires two Deployments: one for the stable version (v1) and another for the shadow version (v2). An Istio VirtualService is then configured to route 100% of user traffic to v1 while simultaneously mirroring that traffic to v2.

    This Istio VirtualService manifest demonstrates the configuration:

    apiVersion: networking.istio.io/v1beta1
    kind: VirtualService
    metadata:
      name: my-app-shadowing
    spec:
      hosts:
        - my-app-service
      http:
      - route:
        - destination:
            host: my-app-service
            subset: v1 # Primary destination for 100% of user-facing traffic
        mirror:
          host: my-app-service
          subset: v2 # Mirrored (shadow) destination
        mirrorPercentage:
          value: 100.0 # Specifies that 100% of traffic should be mirrored
    

    A breakdown of the configuration:

    • The route.destination block ensures all user-facing requests are handled by the v1 service subset.
    • The mirror block instructs Istio to send a copy of the traffic to the v2 service subset.
    • mirrorPercentage is set to 100.0, meaning every request to v1 is duplicated to v2.

    The mirrored traffic is handled in a "fire-and-forget" manner. The service mesh does not wait for a response from the shadow service, minimizing any potential latency impact on the primary request path.

    Key Benefits and Operational Needs

    The primary benefit is risk-free production testing, which helps answer critical questions before a release:

    • Does the new version introduce performance regressions under production load?
    • Are there unexpected errors or memory leaks when processing real-world data?
    • Can the new service handle the same traffic volume as the stable version?

    A Shadow Deployment is the closest you can get to a perfect pre-release test. It validates performance and correctness using real production traffic, effectively eliminating surprises that might otherwise only appear after a full rollout.

    This strategy demands a mature observability stack. Without robust monitoring, logging, and tracing, the mirrored traffic generates no value. Engineering teams must be able to compare key performance indicators (KPIs) between the production and shadow versions. This typically involves dashboarding:

    • Latency: Comparing p95 and p99 request latencies.
    • Error Rates: Monitoring for spikes in HTTP 5xx error rates in the shadow service.
    • Resource Consumption: Analyzing CPU and memory usage for performance bottlenecks.

    This data enables an evidence-based decision to promote the new version or iterate further, all without any impact on the end-user experience.

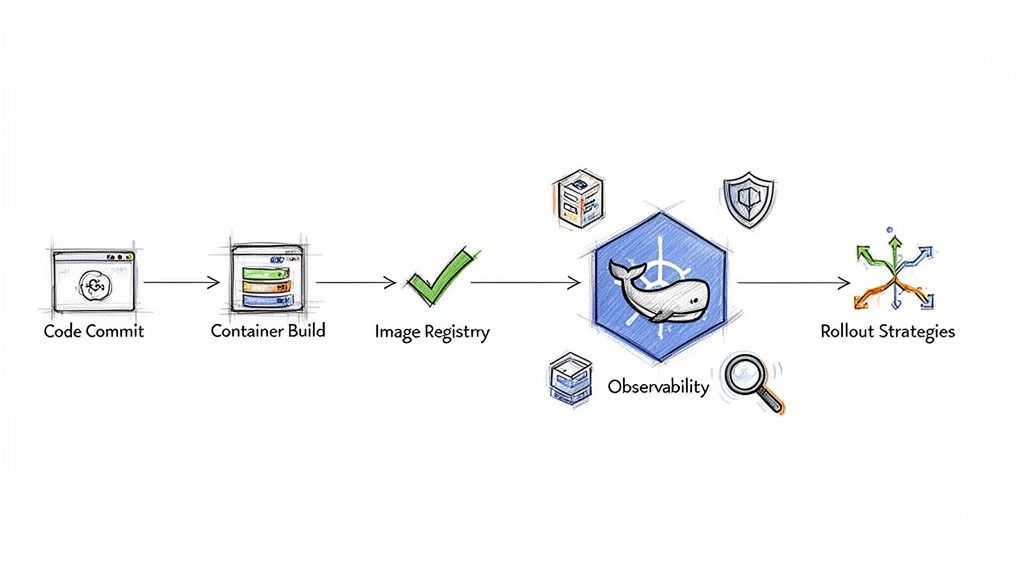
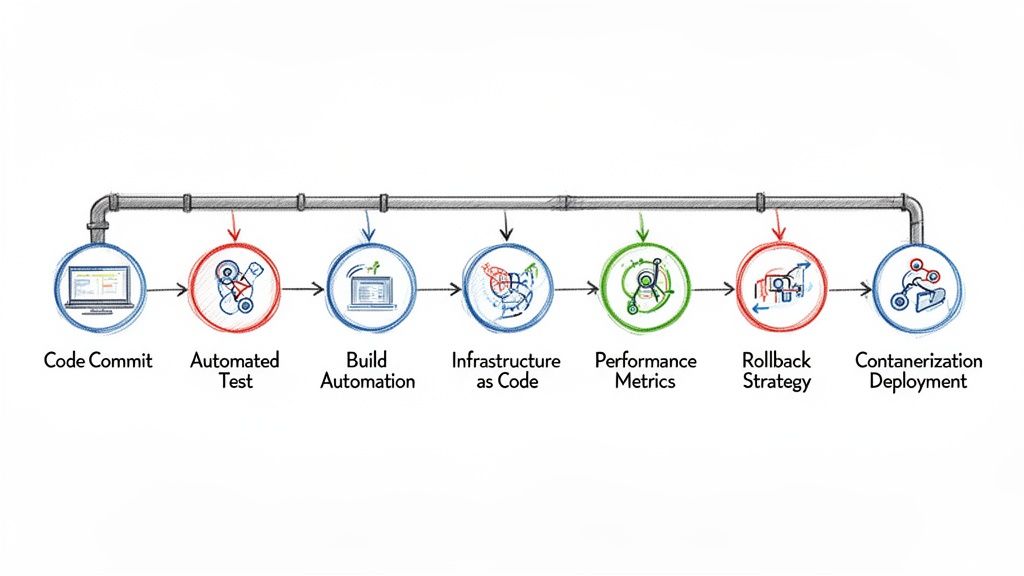
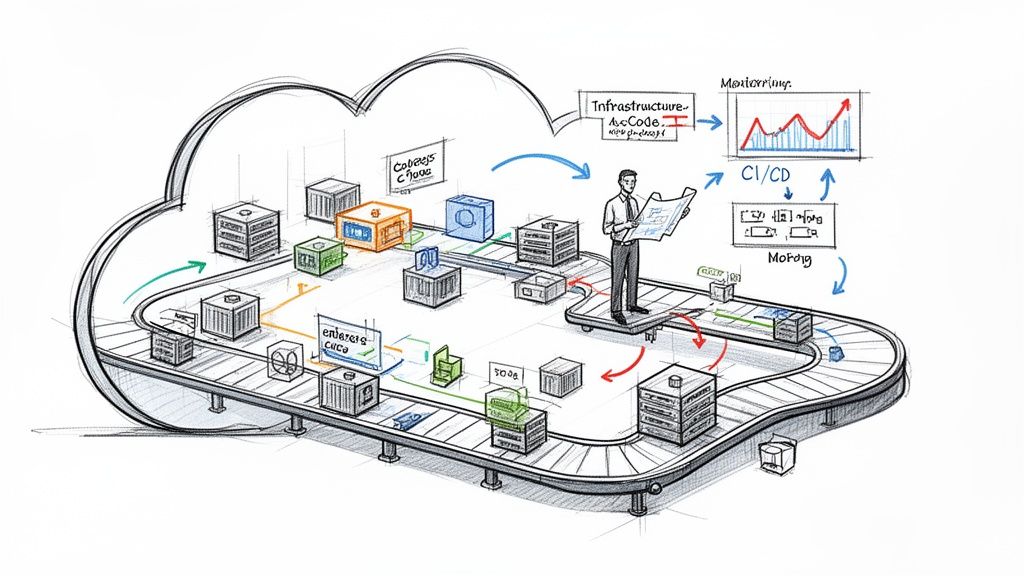
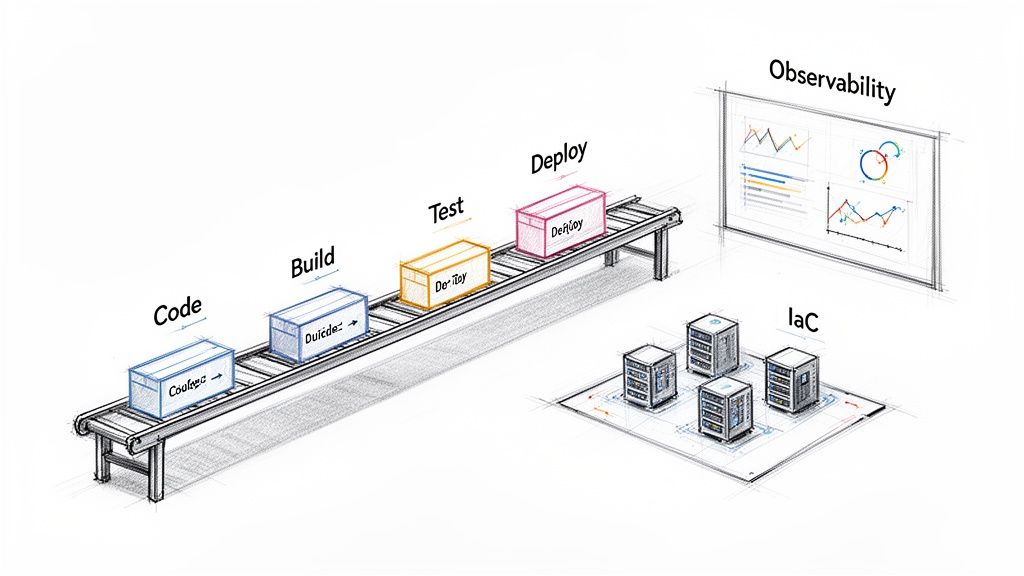
    Automating Deployments with CI/CD and Observability

    The effectiveness of a Kubernetes deployment strategy is directly proportional to the quality of its automation. Manual execution of traffic shifts or performance analysis is slow and error-prone. True operational excellence is achieved when these advanced strategies are integrated directly into a CI/CD pipeline.

    This integration creates a resilient, intelligent, and autonomous release process.

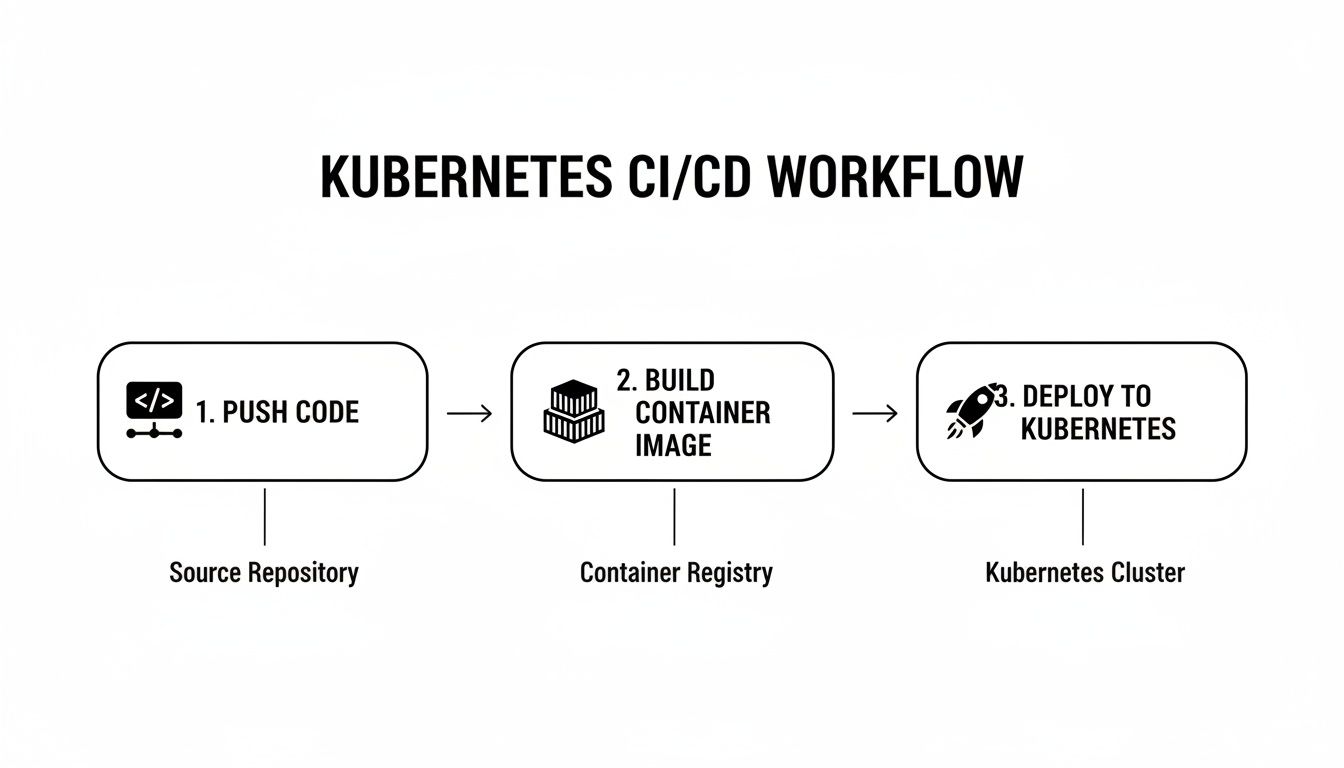
    CI/CD platforms like Jenkins, GitLab CI, or GitOps tools like Argo CD orchestrate the entire release workflow. They can be configured to automatically trigger deployments, manage Blue/Green traffic switches, or execute phased Canary rollouts. This automation eliminates human error and ensures repeatable, predictable releases. For more on this topic, refer to our guide on building a robust Kubernetes CI/CD pipeline.

    The Critical Role of Observability

    Automation without observability is dangerous. A CI/CD pipeline can automate the deployment of a faulty release just as easily as a good one. A resilient system pairs automation with a comprehensive observability stack, using real-time data as an automated quality gate.

    This involves leveraging metrics, logs, and traces to programmatically decide whether a deployment should proceed or be automatically rolled back.

    An automated deployment pipeline that queries observability data is the cornerstone of modern, high-velocity software delivery. It transforms deployments from a hopeful push into a controlled, evidence-based process.

    Consider a Canary deployment managed by Argo Rollouts. The pipeline itself performs the analysis. Using an AnalysisTemplate, it automatically queries a data source like Prometheus to validate the health of the canary against predefined Service Level Objectives (SLOs).

    This automated feedback loop relies on key signals:

    • Metrics (Prometheus): Tracking application vitals like HTTP 5xx error rates and p99 request latency.
    • Logs (Loki): Querying for specific error messages or log patterns that indicate a problem.
    • Traces (Jaeger): Analyzing distributed traces to identify performance degradation in downstream services caused by the new release.

    Creating an Intelligent Delivery Pipeline

    Combining CI/CD automation with observability creates an intelligent delivery system.

    For example, an Argo Rollouts AnalysisTemplate can be configured to query Prometheus every minute during a Canary analysis step. The query might check if the 5xx error rate for the canary version exceeds 1% or if its p99 latency surpasses 500ms.

    If either SLO is breached, Argo Rollouts immediately halts the deployment and triggers an automatic rollback, shifting 100% of traffic back to the last known stable version. No human intervention is required.

    This automated safety net empowers teams to increase their deployment frequency with confidence, knowing the system can detect and react to failures faster than a human operator. The overall effectiveness of this pipeline can be measured by tracking industry-standard benchmarks like the DORA Metrics, providing a quantitative assessment of your software delivery performance.

    Got Questions? We've Got Answers.

    Implementing Kubernetes deployment strategies often raises practical questions. Here are answers to some of the most common inquiries from DevOps and platform engineering teams.

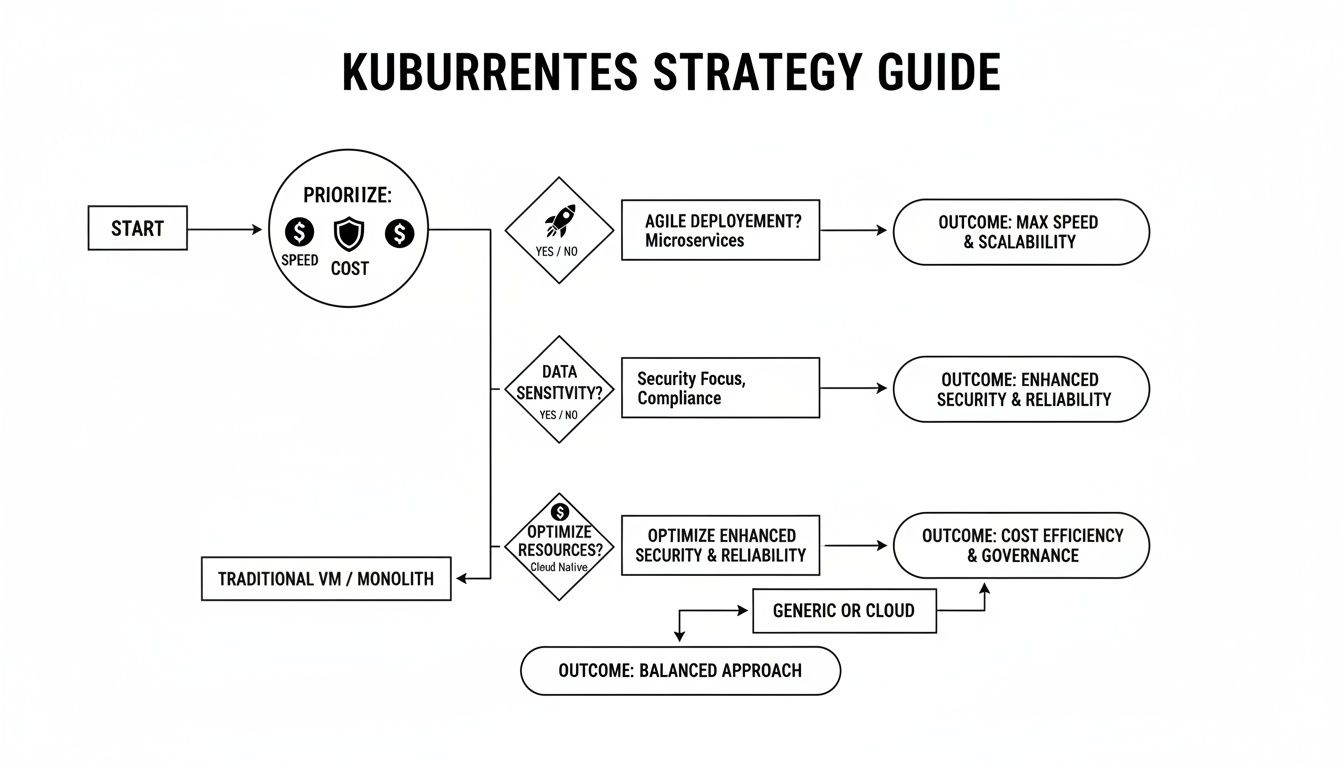
    How Do I Choose the Right Deployment Strategy?

    The optimal strategy depends on the specific context of the application: its architecture, criticality, and tolerance for risk and downtime.

    • For dev/test environments or internal tools: Recreate is often sufficient. Brief downtime is acceptable.
    • For most stateless production applications: The default Rolling Update is the standard. It provides zero-downtime updates with minimal complexity.
    • For critical services requiring instant rollback: Blue/Green is the best choice. The atomic traffic switch and simple rollback mechanism provide maximum safety.
    • For high-risk changes or major feature releases: A Canary deployment is ideal. It allows for validating performance and stability with a small subset of real users before a full rollout.

    Think of it like this: start with your risk profile. The higher the cost of failure, the more sophisticated your strategy needs to be. You'll naturally move from simple rollouts to carefully controlled releases like Canary.

    What Tools Do I Need for the Fancy Stuff?

    While Kubernetes natively supports Recreate and Rolling Update, advanced strategies require additional tooling for traffic management and automation.

    A service mesh is a prerequisite for fine-grained traffic control. Tools like Istio or Linkerd provide the control plane necessary to split traffic by percentage for Canary releases or to mirror traffic for Shadow deployments.

    A progressive delivery controller is essential for automation. Tools like Argo Rollouts or Flagger automate the release lifecycle. They integrate with service meshes and observability platforms to analyze, promote, or roll back a release based on predefined metrics and success criteria.

    Can I Mix and Match Deployment Strategies in the Same Cluster?

    Yes, and you absolutely should. A one-size-fits-all approach is inefficient. The most effective platform engineering strategy is to select the right deployment method for each individual service based on its specific requirements.

    A typical microservices application running on a single Kubernetes cluster might use a hybrid approach:

    • A Rolling Update for a stateless API gateway.
    • A Blue/Green deployment for a critical, stateful service like a user authentication module.
    • A Canary release for a new, experimental feature in the frontend application.

    This tailored approach allows you to apply the appropriate level of risk management and resource allocation where it is most needed, optimizing for both reliability and development velocity.


    Ready to implement these strategies without the operational overhead? OpsMoon provides access to the top 0.7% of DevOps engineers who can build and manage your entire software delivery lifecycle. Start with a free work planning session to map your path to deployment excellence.

  • GitHub Action Tutorial: A Technical Guide to Building CI/CD Pipelines

    GitHub Action Tutorial: A Technical Guide to Building CI/CD Pipelines

    This guide provides a hands-on, technical walkthrough for constructing your first automated workflow with GitHub Actions. We will focus on the core concepts, YAML syntax, and the implementation of a functional CI/CD pipeline, omitting extraneous details.

    By the end of this tutorial, you will understand how to leverage the fundamental components—workflows, jobs, steps, and runners—to implement robust automation in your development lifecycle.

    Demystifying Your First GitHub Actions Workflow

    To effectively use GitHub Actions, you must first understand its fundamental components. The architecture is hierarchical: a workflow contains one or more jobs, each job consists of a sequence of steps, and every job executes on a runner.

    Every automated process, from simple linting to complex multi-cloud deployments, is constructed from these core primitives.

    A workflow is the top-level process defined by a YAML file located in your repository's .github/workflows directory. It is triggered by specific repository events, such as a push to a branch, the creation of a pull request, or a manual dispatch. This event-driven architecture is the foundation of Continuous Integration.

    For a deeper understanding of the principles driving this model, review our technical guide on what is Continuous Integration, a cornerstone of modern DevOps practices.

    The Core Concepts You Need to Know

    A firm grasp of the workflow structure is essential for writing effective automation. Let's deconstruct the hierarchy and define the function of each component.

    This reference table outlines the fundamental building blocks of any workflow.

    Core Concepts in GitHub Actions

    Component Role and Responsibility
    Workflow The entire automated process defined in a single YAML file. It is triggered by specified repository events.
    Job A set of steps that execute on the same runner. Jobs can run in parallel by default or be configured to run sequentially using the needs directive.
    Step An individual task within a job. It can be a shell command executed with run or a pre-packaged, reusable Action invoked with uses.
    Runner The server instance that executes your jobs. GitHub provides hosted runners (e.g., ubuntu-latest, windows-latest), or you can configure self-hosted runners on your own infrastructure.

    With these concepts defined, the logical flow of a complete automation pipeline becomes clear. Each component has a distinct role in the execution of the defined process.

    Your First Practical Workflow: Hello World

    Let's transition from theory to practice by creating a "Hello, World!" workflow to observe these concepts in a live execution.

    First, create the required directory structure. In your repository's root, create a .github directory, and within it, a workflows directory.

    Inside .github/workflows/, create a new file named hello-world.yml.

    Paste the following YAML configuration into the file:

    name: A Simple Hello World Workflow
    
    on:
      push:
        branches: [ "main" ]
      pull_request:
        branches: [ "main" ]
      workflow_dispatch:
    
    jobs:
      say-hello:
        runs-on: ubuntu-latest
        steps:
          - name: Greet the World
            run: echo "Hello, World! I am running my first GitHub Action!"
          - name: Greet a Specific Person
            run: echo "Hello, OpsMoon user!"
    

    Let's analyze this configuration. The workflow is triggered on a push or pull_request event targeting the main branch. The workflow_dispatch trigger enables manual execution from the GitHub Actions UI.

    It defines a single job, say-hello, configured to execute on the latest GitHub-hosted Ubuntu runner (ubuntu-latest). This job contains two sequential steps, each using the run keyword to execute an echo shell command.

    Commit this file and push it to your main branch. Navigate to the "Actions" tab in your GitHub repository to observe the workflow's execution log. You have now successfully configured and executed your first piece of automation.

    Building a Practical CI Pipeline from Scratch

    While a "Hello, World!" example demonstrates the basics, real-world value comes from building functional pipelines. We will now construct a standard Continuous Integration (CI) pipeline for a Node.js application. The objective is to automatically build and test the codebase whenever a pull request is opened, providing immediate feedback on code changes.

    This process illustrates the core automation loop of GitHub Actions, where a single repository event triggers a cascade of jobs and steps.

    Diagram illustrating the sequential process flow of GitHub Actions, from workflow to jobs and steps.

    As shown, the workflow acts as the container for jobs, which are composed of sequential steps executed on a runner. This hierarchical structure is both straightforward and powerful.

    Crafting the Node.js CI Workflow

    First, create a new YAML file at .github/workflows/node-ci.yml in your repository. This file will define the entire CI process.

    Here is the complete workflow configuration. We will dissect each section immediately following the code block.

    name: Node.js CI
    
    on:
      pull_request:
        branches: [ "main" ]
    
    jobs:
      build-and-test:
        runs-on: ubuntu-latest
        strategy:
          matrix:
            node-version: [18.x, 20.x, 22.x]
    
        steps:
          - name: Checkout repository code
            uses: actions/checkout@v4
    
          - name: Use Node.js ${{ matrix.node-version }}
            uses: actions/setup-node@v4
            with:
              node-version: ${{ matrix.node-version }}
              cache: 'npm'
    
          - name: Install dependencies
            run: npm ci
    
          - name: Run tests
            run: npm test
    

    The trigger is defined in the on block, configured to execute on any pull_request targeting the main branch. This is a standard CI practice to validate code changes before they are merged.

    Breaking Down the Job Configuration

    The single job, build-and-test, is configured to run on an ubuntu-latest runner—a fresh, GitHub-hosted virtual machine equipped with common development tools.

    The core of this job's efficiency lies in the strategy block. It defines a build matrix, instructing GitHub Actions to execute the entire job multiple times, once for each specified Node.js version. This is a highly efficient method for testing compatibility across multiple environments without code duplication.

    The job proceeds through a series of steps:

    • Checkout repository code: This step utilizes actions/checkout@v4, a pre-built Action that clones a copy of your repository's code onto the runner.
    • Use Node.js: The actions/setup-node@v4 action installs the Node.js version specified by the matrix variable. The with: cache: 'npm' directive is a critical performance optimization. It caches the node_modules directory, allowing subsequent runs to bypass the time-consuming dependency installation process, significantly reducing pipeline execution time.
    • Install dependencies: We use npm ci instead of npm install. For CI environments, ci is faster and more reliable as it installs dependencies strictly from the package-lock.json file, ensuring reproducible builds.
    • Run tests: The npm test command executes the test suite defined in your package.json file.

    The scale of GitHub Actions' infrastructure is substantial. To handle accelerating demand, GitHub re-architected its backend, and by August 2025, the system was processing 71 million jobs daily, up from 23 million in early 2024. This overhaul was critical for maintaining performance and reliability at scale.

    To further enhance quality assurance, consider integrating additional automated testing tools. You can explore a range of options in this guide to the Top 12 Automated Website Testing Tools.

    After committing this file, open a pull request to see the action execute. A green checkmark indicates that all tests passed across all Node.js versions, providing a clear signal that the code is safe to merge.

    Managing Secrets and Environments for Secure Deployments

    Automating builds and tests is foundational, but the ultimate goal is often automated deployment. This introduces a security challenge: deployments require sensitive credentials like API keys, cloud provider tokens, and database passwords. Committing these secrets directly into your repository is a severe security vulnerability.

    GitHub's secrets management system is a critical feature for secure automation. It provides a mechanism for storing sensitive data as encrypted secrets, which can be accessed by workflows without being exposed in logs or source code.

    Diagram showing secrets management process from a secure safe to staging workflow and manual production approval.

    Creating and Using Repository Secrets

    The primary tool for this is repository secrets. These are encrypted environment variables scoped to a specific repository.

    To create a secret, navigate to your repository's Settings > Secrets and variables > Actions. Here, you can add new repository secrets. Once a secret is saved, its value is permanently masked and cannot be viewed again; it can only be updated or deleted.

    To use a secret in a workflow, you reference it through the secrets context. GitHub injects the value securely at runtime.

    jobs:
      deploy:
        runs-on: ubuntu-latest
        steps:
          - name: Deploy to Cloud Provider
            run: echo "Deploying with API key..."
            env:
              API_KEY: ${{ secrets.YOUR_API_KEY }}
    

    In this example, YOUR_API_KEY is the name of the secret created in the settings. The expression ${{ secrets.YOUR_API_KEY }} injects the secret's value into the API_KEY environment variable for that step. GitHub automatically redacts this secret's value in logs, replacing it with *** to prevent accidental exposure.

    For a comprehensive approach to data protection, it is beneficial to study established secrets management best practices that apply across your entire technology stack.

    Structuring Workflows with Environments

    For managing deployments to distinct environments like staging and production, GitHub Environments provide a formal mechanism for applying protection rules and environment-specific secrets.

    Create environments from your repository's Settings > Environments page. Here, you can configure crucial deployment guardrails:

    • Required reviewers: Mandate manual approval from one or more specified users or teams before a deployment to this environment can proceed.
    • Wait timer: Configure a delay before a job targeting the environment begins, providing a window to cancel a problematic deployment.
    • Deployment branches: Restrict deployments to an environment to originate only from specific branches (e.g., only the main branch can deploy to production).

    Once an environment is configured, reference it in your workflow job:

    jobs:
      deploy-to-prod:
        runs-on: ubuntu-latest
        environment: 
          name: production
          url: https://your-app-url.com
        steps:
          - name: Deploy to Production
            run: ./deploy.sh
            env:
              AWS_ACCESS_KEY_ID: ${{ secrets.AWS_ACCESS_KEY_ID }}
    

    Adding the environment key links this job to the configured protection rules. If the production environment requires a review, the workflow will pause at this job, awaiting approval from an authorized user in the GitHub UI. This simple YAML addition introduces a significant layer of control and safety to your deployment process.

    Advanced Deployment Strategies for Cloud Environments

    With a robust CI pipeline and secure secrets management in place, the next step is automating deployments. Continuous Deployment (CD) enables faster feature delivery with reduced manual intervention. This section focuses on implementing production-grade deployment patterns for major cloud providers.

    We will move beyond simple shell scripts to integrate Infrastructure as Code (IaC) tools like Terraform directly into the pipeline. This approach allows you to provision, modify, and version your cloud infrastructure with the same rigor as your application code.

    Integrating Terraform for Automated Infrastructure

    Manual management of cloud resources is inefficient, error-prone, and not scalable. By integrating Terraform into GitHub Actions, you can automate the entire infrastructure lifecycle, from provisioning an S3 bucket to deploying a complex Kubernetes cluster.

    The following workflow demonstrates a common pattern: running terraform plan on pull requests for review and terraform apply upon merging to the main branch. This example assumes AWS credentials (AWS_ACCESS_KEY_ID and AWS_SECRET_ACCESS_KEY) are stored as repository secrets.

    name: Deploy Infrastructure with Terraform
    
    on:
      push:
        branches:
          - main
      pull_request:
    
    jobs:
      terraform:
        name: 'Terraform IaC'
        runs-on: ubuntu-latest
    
        steps:
        - name: Checkout
          uses: actions/checkout@v4
    
        - name: Setup Terraform
          uses: hashicorp/setup-terraform@v3
          with:
            terraform_version: 1.8.0
    
        - name: Terraform Format Check
          id: fmt
          run: terraform fmt -check
    
        - name: Terraform Init
          id: init
          run: terraform init
          env:
            AWS_ACCESS_KEY_ID: ${{ secrets.AWS_ACCESS_KEY_ID }}
            AWS_SECRET_ACCESS_KEY: ${{ secrets.AWS_SECRET_ACCESS_KEY }}
    
        - name: Terraform Plan
          id: plan
          if: github.event_name == 'pull_request'
          run: terraform plan -no-color
          continue-on-error: true
    
        - name: Terraform Apply
          if: github.ref == 'refs/heads/main' && github.event_name == 'push'
          run: terraform apply -auto-approve
          env:
            AWS_ACCESS_KEY_ID: ${{ secrets.AWS_ACCESS_KEY_ID }}
            AWS_SECRET_ACCESS_KEY: ${{ secrets.AWS_SECRET_ACCESS_KEY }}
    

    This workflow uses conditional execution. On a pull request, it generates a terraform plan, providing a preview of the impending changes. When the pull request is merged to main, the push event triggers the workflow again, this time executing terraform apply to implement the changes.

    This automation ensures your infrastructure state remains synchronized with your codebase. It also enables more advanced release patterns, such as blue-green or canary deployments. For further reading on this topic, consult our guide to zero-downtime deployment strategies.

    Leveraging Self-Hosted Runners for Specialized Workloads

    While GitHub-hosted runners are convenient and require no maintenance, they are not suitable for all use cases. Self-hosted runners provide a solution for jobs requiring more control, specialized hardware, or enhanced security. They allow you to execute jobs on your own infrastructure, whether on-premises servers or VMs in a private cloud.

    The adoption of GitHub Actions has grown significantly since its 2018 launch. In 2023, public projects consumed 11.5 billion GitHub Actions minutes, a 35% increase year-over-year. The platform now processes over 71 million jobs daily, a testament to its scale. More details on this growth are available on the official GitHub blog.

    While GitHub's runner fleet handles the majority of this load, self-hosted runners are essential for specialized requirements.

    Self-hosted runners offer complete control over the execution environment, which is necessary for jobs requiring GPU access, ARM architecture, or direct connectivity to on-premises systems.

    Consider a self-hosted runner for the following scenarios:

    • Specialized Hardware: Your build process requires a GPU for machine learning model training, or you are compiling for a non-x86 architecture like ARM.
    • Strict Security Compliance: Corporate security policies mandate that all CI/CD processes execute within your private network perimeter.
    • Access to Private Resources: Your workflow must interact with a firewalled database, internal artifact repository, or other non-public services.

    Setting up a self-hosted runner involves installing an agent on your machine and registering it with your repository or organization. This initial setup provides complete environmental control.

    GitHub-Hosted vs Self-Hosted Runners

    The choice between runner types is a trade-off between convenience and control. This table compares key features to aid in your decision-making.

    Feature GitHub-Hosted Runners Self-Hosted Runners
    Maintenance Fully managed by GitHub; no patching required. You are responsible for OS, software, and security updates.
    Environment Pre-configured with a wide range of common software. Fully customizable; install any required tool or hardware.
    Cost Billed per minute of execution time. You incur costs for your own infrastructure (servers, cloud VMs).
    Security Each job runs in a fresh, isolated VM. Runs on your hardware, enabling complete network-level isolation.

    To use a self-hosted runner, simply change the runs-on key in your workflow to a label assigned during the runner's setup (e.g., self-hosted, or a more specific label like gpu-runner-v1). This one-line change directs the job to your infrastructure, unlocking advanced capabilities for your deployment pipelines.

    Optimizing Workflows for Cost and Performance

    Active workflows incur costs, both in compute charges and developer wait time. Optimizing pipelines for speed and efficiency is a critical practice for managing budgets and maintaining development velocity.

    GitHub is adjusting the economics of Actions. Effective January 1, 2026, a 40% price reduction for hosted runners will be implemented, but it will be paired with a new $0.002 per-minute "cloud platform charge" for all workflows, including those on self-hosted runners. While GitHub estimates that 96% of customers will not see a bill increase, this change underscores the importance of efficient workflows. You can review the specifics of the 2026 pricing changes for GitHub Actions for more details.

    A sketch showing the balance between speed and cost, with cache, parallel jobs, and runner size factors.

    Effective optimization focuses on three key areas: caching, job parallelization, and runner selection.

    Implement Smart Caching Strategies

    Intelligent caching is the most effective method for reducing job runtime. Re-downloading dependencies or rebuilding artifacts in every run is a significant waste of time and resources. The actions/cache action addresses this.

    By caching directories like node_modules, ~/.m2 (Maven), or ~/.gradle (Gradle), you can reduce build times significantly.

    A well-designed cache key is crucial. A key that is too broad may result in using stale dependencies, while a key that is too specific will lead to frequent cache misses. A robust pattern is to combine the runner's OS, a static identifier, and a hash of the dependency lock file.

    Here is a standard caching implementation for a Node.js project:

    - name: Cache node modules
      uses: actions/cache@v4
      with:
        path: ~/.npm
        key: ${{ runner.os }}-node-${{ hashFiles('**/package-lock.json') }}
        restore-keys: |
          ${{ runner.os }}-node-
    

    This configuration invalidates the cache only when package-lock.json is modified, which is precisely when dependencies need to be updated.

    Parallelize Jobs for Maximum Throughput

    If a workflow contains independent tasks such as linting, unit testing, and integration testing, executing them sequentially creates a bottleneck. By defining them as separate jobs, they can run in parallel, drastically reducing the total workflow duration.

    The total runtime becomes the duration of the longest-running job, not the sum of all jobs.

    By default, all jobs in a workflow without explicit dependencies run in parallel. The needs keyword is used to enforce a sequential execution order, such as making a deployment job dependent on a successful build job.

    Consider structuring a CI pipeline with parallel jobs:

    • Linting Job: Performs static code analysis.
    • Unit Test Job: Executes fast, isolated tests.
    • Integration Test Job: A longer-running job that may require external services like a database.

    This structure provides faster feedback; a linting failure that occurs in 30 seconds is not delayed by a 20-minute test suite.

    Choose the Right Runner Size

    GitHub offers hosted runners with varying vCPU counts and memory. Selecting the appropriate runner size is a balance between performance and cost.

    For lightweight tasks like linting, a standard 2-core runner is cost-effective. For computationally intensive tasks—such as compiling large C++ projects, building complex Docker images, or running extensive end-to-end test suites—a larger runner can provide significant performance gains.

    A more expensive runner can paradoxically reduce total cost. While the per-minute rate is higher, if the job completes substantially faster, the overall cost may be lower. For example, a job that takes 30 minutes on a 2-core runner might finish in 8 minutes on an 8-core machine, reducing both cost and developer wait time. Profile your critical jobs to identify the optimal runner size.

    Common GitHub Actions Questions Answered

    This section addresses frequently asked questions from engineers who are new to GitHub Actions, focusing on core concepts that are key to building maintainable and effective automation.

    Can I Use GitHub Actions For More Than Just CI/CD?

    Yes. While CI/CD is a primary use case, GitHub Actions is a general-purpose, event-driven automation platform. Any event within a GitHub repository can trigger a workflow.

    Teams have implemented GitHub Actions for a variety of automation tasks beyond CI/CD:

    • Automated Issue Triage: A workflow can automatically apply a needs-triage label to new bug reports and assign them to an on-call engineer based on a defined schedule.
    • Scheduled Housekeeping: Using on: schedule, you can run cron jobs to perform tasks like nightly database cleanup, generating weekly performance reports for Slack, or archiving stale feature branches.
    • Living Documentation: Configure a workflow to automatically build and deploy a static documentation site (e.g., MkDocs, Docusaurus) on every merge to the main branch.
    • Custom Notifications: Implement workflows to post targeted messages to specific Discord or Slack channels when a high-priority pull request is opened or a production deployment completes successfully.

    How Do I Troubleshoot a Failing Workflow?

    Start by examining the logs for the specific failing job. GitHub Actions provides detailed, step-by-step output that typically highlights the command that failed and its error message.

    For more complex issues, enable debug logging by creating a repository secret named ACTIONS_RUNNER_DEBUG with the value true. The subsequent workflow run will produce verbose logs, detailing the runner's operations.

    For interactive debugging, the tmate/tmate-action is an invaluable tool. Adding this action as a step in your workflow establishes a temporary SSH session directly into the runner. This allows you to inspect the filesystem, check environment variables, and execute commands interactively to diagnose the problem.

    What Is The Difference Between An Action And A Workflow?

    The distinction lies in their place in the hierarchy.

    An action is a reusable, self-contained unit of code that performs a specific task. A workflow is the high-level process definition, written in YAML, that orchestrates multiple steps (which can be actions or shell commands) into jobs to accomplish a goal.

    An analogy is a recipe. The actions are pre-packaged components like actions/checkout (to fetch code) or actions/setup-node (to install Node.js). The workflow is the complete recipe that specifies the sequence of jobs and steps required to produce the final result. A workflow is composed of jobs, jobs are composed of steps, and steps can either execute a shell command or use an action.

    Applying principles from best practices for clear software documentation to your workflow files can greatly improve their maintainability.

    When Should I Use A Self-Hosted Runner?

    GitHub-hosted runners are sufficient for the majority of use cases. A self-hosted runner becomes necessary when you encounter specific limitations.

    The transition to a self-hosted runner is indicated in these scenarios:

    • Specialized Hardware: Standard runners lack GPUs. For ML model training or complex simulations, you must provide your own hardware. The same applies to building for non-x86 architectures like ARM.
    • Strict Security and Compliance: In regulated industries like finance or healthcare, the build process must often occur within a private network. A self-hosted runner ensures your source code and build artifacts never leave your network perimeter.
    • Accessing Private Resources: If your workflow needs to connect to a database, artifact repository, or other service behind a corporate firewall, a self-hosted runner located within that network is the most secure solution.

    Self-hosted runners provide complete control over the operating system, installed software, and network configuration, making them essential for complex or highly regulated environments.


    At OpsMoon, we specialize in designing and implementing robust CI/CD pipelines that accelerate your development cycle. Our expert DevOps engineers can help you build, optimize, and scale your automation workflows with GitHub Actions, ensuring your team can ship software faster and more reliably. Find out how we can help at https://opsmoon.com.

  • Top 10 Technical API Gateway Best Practices for 2026

    Top 10 Technical API Gateway Best Practices for 2026

    API gateways are the cornerstone of modern distributed systems, acting as the central control plane for traffic, security, and observability. But simply deploying one is not enough to guarantee success. Achieving true resilience, performance, and security requires a deliberate, engineering-driven approach that goes beyond default configurations. Getting this right prevents cascading failures, secures sensitive data, and provides the visibility needed to operate complex microservices architectures effectively.

    This article moves beyond generic advice to provide a technical, actionable checklist of the top 10 API gateway best practices that high-performing DevOps and platform engineering teams implement. We will not just tell you what to do; we will show you how with specific configurations, architectural trade-offs, and recommended tooling. Our focus is on the practical application of these principles in a real-world production environment.

    Prepare to dive deep into the technical specifics that separate a basic gateway setup from a production-hardened, scalable architecture. You will learn how to:

    • Implement sophisticated rate-limiting algorithms to protect backend services.
    • Enforce centralized, zero-trust authentication and authorization patterns.
    • Build fault tolerance using circuit breakers and intelligent retry mechanisms.
    • Establish a comprehensive observability stack with structured logging and distributed tracing.

    Each practice is designed to be a blueprint you can directly apply to your own systems, whether you're a startup CTO building from scratch or an enterprise SRE optimizing an existing deployment. This guide provides the technical details needed to build a robust, secure, and efficient API management layer.

    1. Implement Comprehensive Rate Limiting and Throttling

    One of the most critical API gateway best practices is implementing robust rate limiting and throttling to shield backend services from traffic spikes and abuse. Rate limiting sets a hard cap on the number of requests a client can make within a specific time window, while throttling smooths out request bursts by queuing or delaying them. These controls are non-negotiable for preventing cascading failures, ensuring fair resource allocation among tenants, and maintaining service stability.

    When a client exceeds a defined rate limit, the gateway must immediately return an HTTP 429 Too Many Requests status code. This clear, standardized response mechanism informs the client application that it needs to back off, preventing it from overwhelming the system.

    An illustration showing a funnel dropping items into a 'rate' bucket, with a 'throttle' gauge controlling the flow.

    Why It's a Top Priority

    Without effective rate limiting, a single misconfigured client, a malicious actor launching a denial-of-service attack, or an unexpected viral event can saturate your backend resources. This leads to increased latency, higher error rates, and potentially a full-system outage, impacting all users. For multi-tenant SaaS platforms, this practice is foundational to guaranteeing a baseline quality of service (QoS) for every customer.

    Practical Implementation and Examples

    • GitHub's API uses a tiered approach based on authentication context: unauthenticated requests (identified by source IP) are limited to 60 per hour, while authenticated requests using OAuth tokens get a much higher limit of 5,000 per hour, identified by the token itself.
    • AWS API Gateway allows configuration of a steady-state rate and a burst capacity using a token bucket algorithm. For example, a configuration of rate: 1000 and burst: 2000 allows for handling brief spikes up to 2,000 requests, while sustaining an average of 1,000 requests per second.
    • Kong API Gateway leverages its rate-limiting plugin, which can be configured with various algorithms (like fixed-window, sliding-window, or sliding-log) and can use a Redis cluster for a distributed counter. A typical configuration would specify limits per minute, hour, and day for a given consumer.

    Actionable Tip: Always include a Retry-After header in your 429 responses. This header tells the client exactly how many seconds to wait before attempting another request, helping well-behaved clients to implement an effective exponential backoff strategy and reduce unnecessary retry traffic. For example: Retry-After: 30.

    2. Implement Centralized Authentication and Authorization

    One of the most impactful API gateway best practices is to centralize authentication (AuthN) and authorization (AuthZ). This approach delegates security enforcement to the gateway, creating a single, robust checkpoint for all incoming API requests. Instead of embedding complex security logic within each downstream microservice, the gateway validates credentials, verifies identities, and enforces access policies upfront, simplifying the overall architecture and reducing the attack surface.

    This model establishes the gateway as the single source of truth for identity. It typically involves standard protocols like OAuth 2.0 and OpenID Connect, using mechanisms like JSON Web Tokens (JWT) to carry identity and permission information. Once the gateway validates a token's signature, expiration, and claims, it can inject verified user information (e.g., X-User-ID, X-Tenant-ID) as HTTP headers before forwarding the request, freeing backend services to focus purely on business logic.

    Hand-drawn diagram of a centralized authentication gateway using JWT for client-service authorization.

    Why It's a Top Priority

    Without centralized security, each microservice team must independently implement, test, and maintain its own authentication and authorization logic. This leads to code duplication, inconsistent security standards (e.g., different JWT validation libraries with varying vulnerabilities), and a significantly higher risk of security gaps. Centralizing this function ensures that security policies are applied uniformly, makes auditing straightforward, and allows security teams to manage policies in one place without requiring code changes in every service.

    Practical Implementation and Examples

    • AWS API Gateway integrates directly with AWS Cognito for user authentication and AWS IAM for fine-grained authorization using SigV4 signatures. It also provides Lambda authorizers for custom logic, such as validating JWTs from an external IdP.
    • Kong Gateway uses plugins like jwt, oauth2, and oidc to connect with identity providers (IdPs) such as Okta, Auth0, or Keycloak. It can offload all token validation and introspection from backend services.
    • Azure API Management can validate JWTs issued by Azure Active Directory. You can use policy expressions to check for specific claims, such as roles or scopes, and reject requests that lack the required permissions (e.g., <validate-jwt header-name="Authorization" failed-validation-httpcode="401"><required-claims><claim name="scp" match="any" separator=" "><value>read:users</value></claim></required-claims></validate-jwt>). For more details, see our guide on effective secrets management strategies.

    Actionable Tip: Use short-lived access tokens (e.g., 5-15 minutes) combined with long-lived refresh tokens. This model, central to OAuth 2.0, minimizes the window of opportunity for a compromised token to be misused. The gateway should only be concerned with validating the access token; the client is responsible for using the refresh token to obtain a new access token from the IdP.

    3. Enable API Versioning and Backward Compatibility

    As APIs evolve, introducing breaking changes is inevitable. Handling this evolution gracefully is a core API gateway best practice that prevents disruptions for existing clients. API versioning at the gateway level allows you to manage multiple concurrent versions of an API, routing requests to the appropriate backend service based on version identifiers. This strategy is essential for innovating your services while maintaining stability for a diverse and established user base.

    The most common versioning strategies managed by the gateway include URL pathing (/api/v2/users), custom request headers (Accept-Version: v2), or query parameters (/api/users?version=2). By abstracting this routing logic to the gateway, you decouple version management from your backend services, allowing them to focus solely on business logic.

    Why It's a Top Priority

    Without a clear versioning strategy, any change to an API, no matter how small, risks breaking client integrations. This forces clients to constantly adapt, creating a frustrating developer experience and potentially leading to churn. For platforms with a public API, such as a SaaS product, maintaining backward compatibility is a non-negotiable aspect of the developer contract. An API gateway provides the perfect control plane to implement and enforce this contract consistently.

    Practical Implementation and Examples

    • Stripe’s API famously uses a date-based version specified in a Stripe-Version header (e.g., Stripe-Version: 2022-11-15). This allows clients to pin their integration to a specific API version, ensuring that their code continues to work even as Stripe releases non-backward-compatible updates.
    • Twilio prefers URL path versioning (e.g., /2010-04-01/Accounts). The API gateway can use a simple regex match on the URL path to route the request to the backend service deployment responsible for that specific version.
    • AWS API Gateway can manage this through "stages." You can deploy different API specifications (e.g., openapi-v1.yaml, openapi-v2.yaml) to different stages (e.g., v1, v2, beta), each with its own endpoint and backend integration configuration, providing clear separation.

    Actionable Tip: Use response headers to communicate deprecation schedules. Include a Deprecation header with a timestamp indicating when the endpoint will be removed and a Link header pointing to documentation for the new version. For example: Deprecation: Tue, 24 Jan 2023 23:59:59 GMT and Link: <https://api.example.com/v2/docs>; rel="alternate". This provides clients with clear, machine-readable warnings and a timeline for migration.

    4. Implement Advanced Logging and Request Tracing

    Comprehensive logging and distributed tracing at the API gateway are fundamental for gaining visibility into system behavior. This practice involves capturing detailed metadata for every request and response, including headers, payloads (sanitized), latency, and status codes. More importantly, it correlates these logs into a single, cohesive view of a request's journey across multiple microservices, which is a non-negotiable for modern distributed architectures.

    This end-to-end visibility is essential for rapidly diagnosing production issues, monitoring system health, and understanding user behavior. By treating the gateway as a centralized observation point, you can debug complex, cross-service failures that would otherwise be nearly impossible to piece together.

    Distributed tracing diagram showing services, a trace timeline, and log details with a magnifying glass.

    Why It's a Top Priority

    Without centralized logging and tracing, debugging becomes a time-consuming process of manually grep-ing through logs on individual services. A single user-facing error could trigger a cascade of events across a dozen backends, and without a correlation ID, linking these events is pure guesswork. This practice transforms your API gateway from a simple proxy into an intelligent observability hub, drastically reducing Mean Time to Resolution (MTTR) for incidents.

    Practical Implementation and Examples

    • AWS API Gateway integrates natively with CloudWatch for logging and AWS X-Ray for distributed tracing. When X-Ray is enabled, the gateway automatically injects a trace header (X-Amzn-Trace-Id) into downstream requests made to other AWS services.
    • Kong API Gateway can be configured to stream logs in a structured format (JSON) to external systems like Fluentd or an ELK stack. It integrates with observability platforms like Datadog or OpenTelemetry collectors for full-stack tracing.
    • Nginx, when used as a gateway, can be extended with the OpenTelemetry module to generate traces. These traces can then be sent to a backend collector like Jaeger or Zipkin for visualization and analysis. A typical log format might include $request_id to correlate entries.

    Actionable Tip: Standardize on a specific trace header across all services, preferably the W3C Trace Context specification (traceparent and tracestate). Your gateway should be configured to generate this header if it's missing or propagate it if it already exists, ensuring every log entry from every microservice involved in a request can be correlated with a single trace ID.

    5. Implement Request/Response Transformation and Validation

    A powerful API gateway best practice is to offload request and response transformation and validation from backend services. The gateway acts as an intermediary, intercepting traffic to remap data structures, validate schemas, and normalize payloads before they reach the backend. This decoupling allows backend services to focus purely on business logic, while the gateway handles the "last mile" of data adaptation and integrity checks. This is invaluable when integrating legacy systems, composing services, or adapting protocols like REST to gRPC.

    By handling this logic at the edge, you can evolve frontend clients and backend services independently. The gateway becomes a smart facade, ensuring that regardless of what a client sends or a service returns, the data conforms to a predefined contract. This prevents malformed data from ever hitting your core systems.

    Why It's a Top Priority

    Without gateway-level transformation, backend services become bloated with boilerplate code for data validation and mapping. Each time a new client requires a slightly different data format, you must modify, test, and redeploy the backend service. This creates tight coupling and slows down development cycles. Placing this responsibility on the gateway centralizes data governance, reduces backend complexity, and enables much faster adaptation to new requirements or service versions. It is a critical enabler of the "Strangler Fig" pattern for modernizing legacy applications.

    Practical Implementation and Examples

    • AWS API Gateway uses Mapping Templates with Velocity Template Language (VTL) to transform JSON payloads. You can define "Models" using JSON Schema to validate incoming requests against a contract, rejecting them with a 400 Bad Request at the gateway if they don't conform.
    • Kong Gateway provides plugins like request-transformer and response-transformer. These allow you to add, replace, or remove headers and body fields using simple declarative configuration, effectively creating a data mediation layer without custom code.
    • Apigee offers a rich set of transformation policies, including "Assign Message" and "JSON to XML," allowing developers to visually configure complex data manipulations and logic flows directly within the API proxy.
    • MuleSoft's Anypoint Platform is built around transformation, using its proprietary DataWeave language to handle even the most complex mappings between different formats like JSON, XML, CSV, and proprietary standards.

    Actionable Tip: Always version your transformation policies alongside your API versions. A change in a data mapping is a breaking change for a consumer. Tie transformation logic to a specific API version route (e.g., /v2/users) to ensure older clients continue to function without interruption while new clients can leverage the updated data structure. Store these transformation templates in version control.

    6. Implement Circuit Breaker and Fault Tolerance Patterns

    In a distributed microservices architecture, temporary service failures are inevitable. A critical API gateway best practice is to implement the circuit breaker pattern, which prevents a localized failure from cascading into a system-wide outage. This pattern monitors backend services for failures (e.g., connection timeouts, 5xx responses), and if the error rate exceeds a configured threshold, the gateway "trips" the circuit. Once open, it immediately rejects further requests to the failing service with a 503 Service Unavailable, giving it time to recover without being overwhelmed by a flood of retries.

    This proactive failure management isolates faults and significantly improves the overall resilience and stability of your application. Instead of allowing requests to time out against a struggling service, the gateway provides an immediate, controlled response, such as a fallback message or data from a cache.

    Diagram illustrating fault tolerance with a client, service, a traffic light circuit breaker, and fallback cache.

    Why It's a Top Priority

    Without a circuit breaker, client applications will continuously retry requests to a failing or degraded backend service. This not only exhausts resources on the client side (like connection pools and threads) but also exacerbates the problem for the backend, preventing it from recovering. This tight coupling of client and service health leads to brittle systems. By implementing this pattern at the gateway, you decouple the client's experience from transient backend issues, ensuring the rest of the system remains operational and responsive.

    Practical Implementation and Examples

    • Resilience4j, a Java library often used with Spring Cloud Gateway, can be configured to open a circuit after 50% of the last 10 requests have failed, then transition to a "half-open" state after a 60-second wait to send a single test request. If it succeeds, the circuit closes; otherwise, it remains open.
    • Envoy Proxy, the foundation for many service meshes like Istio, uses its "outlier detection" feature to achieve the same goal. It can be configured to temporarily eject an unhealthy service instance from the load-balancing pool if it returns a specified number of consecutive 5xx errors.
    • Kong API Gateway offers a circuit-breaker plugin that can be applied to a service or route. You can define rules for tripping the circuit based on thresholds for consecutive failures or failure ratios, protecting your upstream services automatically.

    Actionable Tip: Combine circuit breakers with active and passive health checks. The gateway should actively poll a dedicated endpoint (e.g., /healthz) on the backend service. The circuit breaker's logic can use this health status as a primary signal, allowing it to trip pre-emptively before requests even begin to fail, leading to faster fault detection. This is also a core principle of chaos engineering, where you intentionally test these failure modes.

    7. Implement Comprehensive Monitoring and Alerting

    You cannot manage what you do not measure. Implementing comprehensive monitoring and alerting is a foundational API gateway best practice for transforming your gateway from a black box into a transparent, observable system. This involves continuously tracking key performance indicators (KPIs) like request rates, error rates (by status code family, e.g., 4xx/5xx), latency percentiles (p50, p95, p99), and upstream service health. This data provides the visibility needed to detect issues proactively, often before they impact end-users.

    When a metric crosses a predefined threshold, an integrated alerting system should automatically notify the appropriate on-call team via PagerDuty, Slack, or another tool. This immediate feedback loop is critical for maintaining service reliability, upholding service-level agreements (SLAs), and enabling rapid incident response.

    Why It's a Top Priority

    Without robust monitoring, performance degradation and outages become silent killers. A gradual increase in p99 latency or a spike in 5xx errors might go unnoticed until customer complaints flood your support channels. Proactive monitoring allows you to identify anomalies, correlate them with recent deployments or traffic patterns, and diagnose root causes swiftly. It’s the cornerstone of maintaining high availability and a positive user experience, providing the data needed for intelligent capacity planning and performance tuning.

    Practical Implementation and Examples

    • Prometheus + Grafana is a popular open-source stack. You can configure your API gateway (like Kong or Traefik) to expose metrics in a Prometheus-compatible format on a /metrics endpoint. Then, build detailed Grafana dashboards to visualize latency heatmaps, error budgets, and request volumes per route.
    • Datadog APM provides out-of-the-box integrations for many gateways like AWS API Gateway. It can automatically trace requests from the gateway through to backend services, making it easy to pinpoint bottlenecks and set up sophisticated, multi-level alerts based on anomaly detection algorithms.
    • AWS CloudWatch is the native solution for AWS API Gateway. You can create custom alarms based on metrics like Latency, Count, and 4XXError/5XXError. For instance, you can set an alarm to trigger if the p95 latency for a specific route exceeds 200ms for more than five consecutive one-minute periods.

    Actionable Tip: Focus on business-aligned metrics and Service Level Objectives (SLOs). Instead of just alerting when CPU is high, define an SLO like "99.5% of /login requests must be served in under 300ms over a 28-day window." Then, configure your alerts to fire when your error budget for that SLO is being consumed too quickly. This directly ties system performance to user impact.

    8. Implement CORS and Security Headers Management

    Managing Cross-Origin Resource Sharing (CORS) and security headers at the API gateway layer is a foundational best practice for securing web applications. CORS policies dictate which web domains are permitted to access your APIs from a browser, preventing unauthorized cross-site requests. Simultaneously, security headers like Strict-Transport-Security (HSTS), Content-Security-Policy (CSP), and X-Content-Type-Options instruct browsers on how to behave when handling your site's content, mitigating common attacks like cross-site scripting (XSS) and clickjacking.

    By centralizing this control at the gateway, you enforce a consistent security posture across all downstream services. This approach eliminates the need for each microservice to manage its own security headers and CORS logic, simplifying development and reducing the risk of inconsistent or missing protections.

    Why It's a Top Priority

    Without proper CORS management, malicious websites could potentially make requests to your APIs from a user's browser, exfiltrating sensitive data. Similarly, a lack of security headers leaves your application vulnerable to a host of browser-based attacks. Centralizing these controls at the gateway ensures that no API is accidentally deployed without these critical safeguards, which is a key part of any robust API security strategy. This also prevents security misconfiguration where individual services might have overly permissive settings.

    Practical Implementation and Examples

    • AWS API Gateway provides built-in CORS configuration options, allowing you to specify Access-Control-Allow-Origin, Access-Control-Allow-Methods, and Access-Control-Allow-Headers for REST and HTTP APIs.
    • Kong Gateway uses its powerful CORS plugin to apply granular policies. You can enable it globally or on a per-service or per-route basis, defining specific allowed origins with regex patterns for dynamic environments like development feature branches (e.g., https://*.dev.example.com).
    • NGINX can be configured as a gateway to inject security headers into all responses using the add_header directive within a server or location block. For example: add_header Strict-Transport-Security "max-age=31536000; includeSubDomains" always;. This setup acts similarly to a reverse proxy configuration where the gateway fronts your backend services.

    Actionable Tip: Never use a wildcard (*) for Access-Control-Allow-Origin in a production environment where credentials (cookies, auth headers) are sent. Always specify the exact domains that should have access. A wildcard allows any website on the internet to make requests to your API from a browser, nullifying the security benefit of CORS.

    9. Implement API Analytics and Usage Insights

    Beyond simple operational monitoring, a core API gateway best practice is to capture detailed analytics and usage insights. This involves collecting, processing, and visualizing data on how consumers interact with your APIs, transforming raw request logs into strategic business intelligence. This data reveals popular endpoints, identifies top consumers (by API key), tracks feature adoption, and provides a clear view of performance trends over time, enabling data-driven product and engineering decisions.

    By treating your API as a product, the gateway becomes the primary source of truth for understanding its performance and value. It answers critical questions like "Which API versions are still in use?", "Which customers are approaching their rate limits?", and "Did latency on the /checkout endpoint increase after the last deployment?".

    Why It's a Top Priority

    Without dedicated API analytics, you are operating blindly. You cannot effectively plan for future capacity needs, identify opportunities for new features, or proactively engage with customers who are either struggling or demonstrating high-growth potential. It becomes impossible to measure the business impact of your APIs, justify future investment, or troubleshoot complex issues related to specific usage patterns. Effective analytics turns your API gateway from a simple traffic cop into a powerful business insights engine.

    Practical Implementation and Examples

    • Stripe's API Dashboard provides merchants with detailed analytics on API request volume, error rates, and latency, allowing them to monitor their integration's health and usage patterns directly.
    • AWS API Gateway integrates with CloudWatch to provide metrics and logs, which can be further analyzed using services like Amazon QuickSight or OpenSearch. It also offers usage plans that track API key consumption against quotas, feeding directly into billing and business analytics.
    • Apigee (Google Cloud) offers a powerful, built-in analytics suite that allows teams to create custom reports and dashboards to track API traffic, latency, error rates, and even business-level metrics like developer engagement or API product monetization.

    Actionable Tip: Define your Key Performance Indicators (KPIs) before you start collecting data. Align metrics with business objectives by tracking both technical data (p99 latency, error rate) and business data (active consumers, API call volume per pricing tier, feature adoption rate). Structure your gateway logs as JSON so this data can be easily parsed and ingested by your analytics platform.

    10. Implement API Documentation and Developer Portal

    An often-overlooked yet vital API gateway best practice is to treat your APIs as products by providing a comprehensive developer portal and interactive documentation. The gateway is the ideal place to centralize and automate this process, as it has a complete view of your API landscape. A well-designed portal serves as the front door for developers, offering everything they need to discover, understand, test, and integrate with your services efficiently.

    This includes automatically generated, interactive documentation from OpenAPI/Swagger specifications, detailed guides, code samples, and self-service API key management. By making APIs accessible and easy to use, you significantly reduce the friction for adoption, decrease support overhead, and foster a healthy developer ecosystem.

    Why It's a Top Priority

    Without a centralized, high-quality developer portal, API consumers are left to piece together information from outdated wikis, internal documents, or direct support requests. This creates a frustrating developer experience, slows down integration projects, and can lead to incorrect API usage. A great portal not only accelerates time-to-market for consumers but also acts as a critical tool for governance, ensuring developers are using the correct, most current versions of your APIs.

    Practical Implementation and Examples

    • Stripe's Developer Portal is a gold standard, offering interactive API documentation where developers can make real API calls directly from the browser, alongside extensive guides and recipes for common use cases.
    • Twilio's Developer Portal provides robust SDKs in multiple languages, quickstart guides, and a comprehensive API reference, making it exceptionally easy for developers to integrate their communication APIs.
    • AWS API Gateway can export its configuration as an OpenAPI specification, which can then be used by tools like Swagger UI to render documentation. AWS also offers a managed developer portal feature.
    • SwaggerHub and tools like Redocly allow teams to collaboratively design and document APIs using the OpenAPI specification, then publish them to polished, professional-looking portals that can be hosted independently or integrated with a gateway.

    Actionable Tip: Automate your documentation lifecycle. Integrate your CI/CD pipeline to generate and publish OpenAPI specifications to your developer portal whenever an API is updated. Your pipeline should treat the API spec as an artifact. A failure to generate a valid spec should fail the build, ensuring documentation is never out of sync with the actual implementation.

    10-Point API Gateway Best Practices Comparison

    Practice Implementation complexity Resource requirements Expected outcomes Ideal use cases Key advantages
    Implement Comprehensive Rate Limiting and Throttling Medium — requires algorithms and distributed coordination Medium — gateway config, state store (Redis), monitoring Prevents spikes/DDoS; protects backend stability Multi-tenant SaaS, public APIs with variable traffic Protects backend; enforces fair usage
    Implement Centralized Authentication and Authorization High — integrates identity protocols and providers High — IdPs, token stores, PKI/mTLS, security expertise Consistent access control and auditability across APIs Enterprises, multi-tenant platforms, compliance-driven systems Single security enforcement point; simpler policy updates
    Enable API Versioning and Backward Compatibility Medium — routing and lifecycle management Low–Medium — gateway routing rules, documentation effort Safe API evolution with minimal client disruption APIs with many external clients or long-term integrations Enables gradual migration; preserves backward compatibility
    Implement Advanced Logging and Request Tracing High — distributed tracing design and correlation High — storage, tracing/telemetry tools (OTel, Jaeger), expertise End-to-end visibility for debugging and performance tuning Distributed microservices, incident response, observability initiatives Faster root-cause analysis; performance insights
    Implement Request/Response Transformation and Validation Medium — mapping rules and schema enforcement Medium — CPU for transformations, config management Decouples clients from backends; standardized payloads Legacy integration, protocol translation, API evolution Reduces backend changes; enforces data consistency
    Implement Circuit Breaker and Fault Tolerance Patterns Medium — health checks, state machines, retries Medium — health probes, caching/fallback stores, monitoring Prevents cascading failures; enables graceful degradation Systems with flaky dependencies or high reliability needs Improves resilience; reduces wasted requests to failing services
    Implement Comprehensive Monitoring and Alerting Medium — metrics design and alerting strategy Medium–High — metrics pipeline, dashboards, on-call tooling Proactive detection and SLA/SLO tracking Production services with SLOs and capacity planning needs Reduces MTTD; supports data-driven scaling
    Implement CORS and Security Headers Management Low–Medium — header and TLS configuration Low — gateway config, certificate management Safer browser-based API consumption; consistent security posture Web APIs and browser clients Prevents cross-origin abuse; enforces security policies centrally
    Implement API Analytics and Usage Insights Medium — event collection and reporting pipelines High — data storage, analytics platform, privacy controls Business and usage insights for product and monetization Usage-based billing, product optimization, customer success Drives product decisions; identifies high-value users
    Implement API Documentation and Developer Portal Medium — spec generation and portal tooling Medium — hosting, SDK generation, sandbox environment Faster onboarding and reduced support load Public APIs, partner ecosystems, developer-focused products Improves adoption; enables self-service integration

    From Theory to Production: Operationalizing Your Gateway Strategy

    Navigating the intricate landscape of API gateway best practices can feel like assembling a complex puzzle. We've journeyed through ten critical pillars, from establishing robust rate limiting and centralized authentication to implementing advanced observability with tracing, logging, and analytics. Each practice, whether it's managing API versioning, enforcing security headers, or enabling a seamless developer portal, represents a vital component in constructing a resilient, secure, and scalable API ecosystem.

    The core takeaway is this: an API gateway is far more than a simple traffic cop. When configured with intention, it becomes the central nervous system of your microservices architecture. It enforces your security posture, guarantees service reliability through patterns like circuit breaking, and provides the invaluable usage insights needed for strategic business decisions. It's the critical control plane that unlocks true operational excellence and accelerates developer velocity.

    Moving from Checklist to Implementation

    Merely understanding these concepts is the first step; the real value is unlocked through disciplined operationalization. Your goal should be to transform this checklist into a living, automated, and continuously improving system.

    • Embrace Infrastructure-as-Code (IaC): Your gateway configuration, including routes, rate limits, and security policies, should be defined declaratively using tools like Terraform, Ansible, or custom Kubernetes operators. This approach eliminates configuration drift, enables peer reviews for changes, and makes your gateway setup reproducible and auditable.
    • Integrate into CI/CD: Gateway configuration changes must flow through your CI/CD pipeline. Automate testing for new routes, validate policy syntax, and perform canary or blue-green deployments for gateway updates to minimize the blast radius of any potential issues.
    • Prioritize a Monitoring-First Culture: Your gateway is the perfect vantage point for observing your entire system. The metrics, logs, and traces it generates are not "nice-to-haves"; they are essential. Proactively build dashboards and set up precise alerts for latency spikes, error rate increases (especially 5xx errors), and authentication failures.

    The Strategic Value of a Well-Architected Gateway

    Mastering these API gateway best practices yields compounding returns. A well-implemented gateway doesn't just prevent outages; it builds trust with your users and partners by delivering a consistently reliable and secure experience. It empowers your development teams by abstracting away cross-cutting concerns, allowing them to focus on building business value instead of reinventing security and traffic management solutions for every service.

    Ultimately, your API gateway strategy is a direct reflection of your platform's maturity. By investing the effort to implement these best practices, you are not just managing APIs; you are building a strategic asset that provides a competitive advantage, enhances your security posture, and lays a scalable foundation for future innovation. The journey from a basic proxy to a sophisticated control plane is a defining step in engineering excellence.


    Ready to implement these advanced strategies but need the specialized expertise to get it right? OpsMoon connects you with the top 0.7% of elite DevOps and platform engineers who specialize in architecting, deploying, and managing scalable, secure API infrastructures. Start with a free work planning session at OpsMoon to map your journey from theory to a production-ready, resilient API ecosystem.

  • 10 Actionable Software Security Best Practices for 2026

    10 Actionable Software Security Best Practices for 2026

    In today's fast-paced development landscape, software security can no longer be a final-stage checkbox; it's the bedrock of reliable and trustworthy applications. Reactive security measures are costly, inefficient, and leave organizations exposed to ever-evolving threats. The most effective strategy is to build security into every layer of the software delivery lifecycle. This 'shift-left' approach transforms security from a barrier into a competitive advantage.

    This guide moves beyond generic advice to provide a technical, actionable roundup of 10 software security best practices you can implement today. We will explore specific tools, frameworks, and architectural patterns designed to fortify your code, infrastructure, and processes. Our focus is on practical implementation, covering everything from secure CI/CD pipelines and Infrastructure as Code (IaC) hardening to Zero Trust networking and automated vulnerability scanning.

    Each practice is presented as a building block toward a comprehensive DevSecOps culture, empowering your teams to innovate quickly without compromising on security. We will detail how to integrate these measures directly into your existing workflows, ensuring security becomes a seamless and automated part of development, not an afterthought. Let's dive into the technical details that separate secure software from the vulnerable.

    1. Implement a Secure Software Development Lifecycle (SSDLC)

    A Secure Software Development Lifecycle (SSDLC) is a foundational practice that embeds security activities directly into every phase of your existing development process. Instead of treating security as a final gate before deployment, an SSDLC framework makes it a continuous, shared responsibility from initial design to post-release maintenance. This "shift-left" approach is one of the most effective software security best practices for proactively identifying and mitigating vulnerabilities early, when they are cheapest and easiest to fix.

    The core principle is to integrate specific security checks and balances at each stage: requirements, design, development, testing, and deployment. This model transforms security from a siloed function into an integral part of software creation, dramatically reducing the risk of releasing insecure code.

    How an SSDLC Works in Practice

    Implementing an SSDLC involves augmenting your standard development workflow with targeted security actions. For a comprehensive understanding of how to implement security practices throughout your development process, refer to this Guide to the Secure Software Development Life Cycle (SDLC). A typical implementation includes:

    • Requirements Phase: Define clear security requirements alongside functional ones. Specify data encryption standards (e.g., require TLS 1.3 for all data in transit, AES-256-GCM for data at rest), authentication protocols (e.g., mandate OIDC with PKCE flow for all user-facing applications), and compliance constraints (e.g., GDPR data residency).
    • Design Phase: Conduct threat modeling sessions using frameworks like STRIDE (Spoofing, Tampering, Repudiation, Information Disclosure, Denial of Service, Elevation of Privilege) or DREAD. Document data flows and trust boundaries to identify potential architectural weaknesses, such as an unauthenticated internal API.
    • Development Phase: Developers follow secure coding guidelines (e.g., OWASP Top 10, CERT C) and use Static Application Security Testing (SAST) tools (e.g., SonarQube, Snyk Code) integrated into their IDEs via plugins and pre-commit hooks to catch vulnerabilities in real-time.
    • Testing Phase: Augment standard QA with Dynamic Application Security Testing (DAST) tools like OWASP ZAP, Interactive Application Security Testing (IAST), and manual penetration testing against a staging environment to find runtime vulnerabilities not visible in source code.
    • Deployment & Maintenance: Implement security gates in your CI/CD pipeline (e.g., Jenkins, GitLab CI) that automatically fail a build if SAST or SCA scans detect critical vulnerabilities. Continuously monitor production environments with runtime application self-protection (RASP) tools and have a defined incident response plan.

    OpsMoon Expertise: Our DevOps specialists can help you design and implement a tailored SSDLC framework. We can integrate automated security tools like SAST and DAST into your CI/CD pipelines, establish security gates, and conduct a maturity assessment to identify and close gaps in your current processes.

    2. Enforce Secret Management and Credential Rotation

    Enforcing robust secret management and credential rotation is a critical software security best practice for protecting your most sensitive data. This involves a systematic approach to securely storing, accessing, and rotating credentials like API keys, database passwords, and TLS certificates. Hardcoding secrets in source code or configuration files is a common but dangerous mistake that creates a massive security vulnerability, making centralized management essential.

    The core principle is to treat secrets as dynamic, short-lived assets that are centrally managed and programmatically accessed. By removing credentials from developer workflows and application codebases, you dramatically reduce the risk of accidental leaks and provide a single, auditable point of control for all sensitive information. This practice is fundamental to achieving a zero-trust security posture.

    Sketch of a secure safe with API keys and data cards, connected to cloud networks.

    How Secret Management Works in Practice

    Implementing a strong secret management strategy involves adopting dedicated tools and automated workflows. These systems provide a secure vault and an API for applications to request credentials just-in-time, ensuring they are never exposed in plaintext. For a deeper dive into this topic, explore these secrets management best practices. A typical implementation includes:

    • Centralized Vaulting: Use a dedicated secrets manager like HashiCorp Vault or cloud-native services (AWS Secrets Manager, Azure Key Vault) as the single source of truth for all credentials. Applications authenticate to the vault using a trusted identity (e.g., a Kubernetes Service Account, an AWS IAM Role).
    • Dynamic Secret Generation: Configure the vault to generate secrets on-demand with a short Time-To-Live (TTL). For instance, an application can request temporary database credentials from Vault's database secrets engine that expire in one hour, eliminating the need for long-lived static passwords.
    • Automated Rotation: Enable automatic credential rotation policies for long-lived secrets, such as rotating a root database password every 30-90 days without manual intervention. The secrets manager handles the entire lifecycle of updating the credential in the target system and the vault. Robust secret management extends to securing API access, and a thorough understanding of authentication mechanisms is crucial for protecting sensitive resources. To learn more, see this ultimate guide to API key authentication.
    • CI/CD Integration: Integrate secret scanning tools like GitGuardian or TruffleHog into your CI pipeline's pre-commit or pre-receive hooks to detect and block any commits that contain hardcoded credentials, preventing them from ever entering the codebase.
    • Auditing and Access Control: Implement strict, role-based access control (RBAC) policies within the secrets manager and maintain comprehensive audit logs that track every secret access event, including which identity accessed which secret and when.

    OpsMoon Expertise: Our security and DevOps engineers are experts in deploying and managing enterprise-grade secret management solutions. We can help you implement HashiCorp Vault with Kubernetes integration, configure cloud-native services like AWS Secrets Manager, establish automated rotation policies, and integrate secret scanning directly into your CI/CD pipelines to prevent credential leaks.

    3. Implement Container and Image Security Scanning

    Containerization has revolutionized software deployment, but it also introduces new attack surfaces. Implementing container and image security scanning is a critical software security best practice that prevents vulnerable or misconfigured containers from ever reaching production. This practice involves systematically analyzing container images for known vulnerabilities (CVEs) in OS packages and application dependencies, malware, embedded secrets, and policy violations.

    By integrating scanning directly into the build and deployment pipeline, teams can shift security left and automate the detection of issues within container layers and application dependencies. This proactive approach hardens your runtime environment by ensuring that only trusted, vetted images are used, significantly reducing the risk of exploitation in production.

    How Container and Image Scanning Works in Practice

    The process involves using specialized tools to dissect container images, inspect their contents, and compare them against vulnerability databases and predefined security policies. For a deep dive into container security tools and their integration, you can explore the CNCF's Cloud Native Security Whitepaper, which covers various aspects of securing cloud-native applications. A typical implementation workflow includes:

    • Build-Time Scanning: Integrate an image scanner like Trivy, Grype, or Clair directly into your CI/CD pipeline. For example, in a GitLab CI pipeline, a dedicated job can run trivy image my-app:$CI_COMMIT_SHA --exit-code 1 --severity CRITICAL,HIGH to fail the build if severe vulnerabilities are found.
    • Registry Scanning: Configure your container registry (e.g., AWS ECR, Google Artifact Registry, Azure Container Registry) to automatically scan images upon push. This serves as a second gate and provides continuous scanning for newly discovered vulnerabilities in existing images.
    • Policy Enforcement: Define and enforce security policies as code. For example, use a Kubernetes admission controller like Kyverno or OPA Gatekeeper to block pods from running if their image contains critical vulnerabilities or originates from an untrusted registry.
    • Runtime Monitoring: Use tools like Falco or Sysdig Secure to continuously monitor running containers for anomalous behavior (e.g., unexpected network connections, shell execution in a container) based on predefined rules, providing real-time threat detection.
    • Image Signing: Implement image signing with technologies like Cosign (part of Sigstore) to cryptographically verify the integrity and origin of your container images. This ensures the image deployed to production is the exact same one that was built and scanned in CI.

    OpsMoon Expertise: Our team specializes in embedding robust container security into your Kubernetes and CI/CD workflows. We can integrate and configure advanced scanners like Trivy, Snyk, or Prisma Cloud into your pipelines, establish automated security gates, and implement comprehensive image signing and verification strategies to ensure your containerized applications are secure from build to runtime.

    4. Deploy Infrastructure as Code (IaC) with Security Reviews

    Infrastructure as Code (IaC) is the practice of managing and provisioning infrastructure through machine-readable definition files, such as Terraform, CloudFormation, or Ansible, rather than manual configuration. This approach brings version control, automation, and repeatability to infrastructure management. When combined with rigorous security reviews, it becomes a powerful software security best practice for preventing misconfigurations that often lead to data breaches.

    Treating your infrastructure like application code allows you to embed security directly into your provisioning process. By codifying security policies and running automated static analysis checks against your IaC templates, you can ensure that every deployed resource—from VPCs to IAM roles—adheres to your organization's security and compliance standards before it ever goes live.

    Diagram illustrating a software development and security process, from version control to storage, with compute and network steps.

    How IaC Security Works in Practice

    Implementing secure IaC involves integrating security validation into your development and CI/CD pipelines. This ensures that infrastructure definitions are scanned for vulnerabilities and misconfigurations automatically. For an in-depth look at this process, explore our guide on how to check IaC for security issues. Key actions include:

    • Policy as Code (PaC): Use tools like Open Policy Agent (OPA) or HashiCorp Sentinel to define and enforce security guardrails. For example, write an OPA policy in Rego to deny any AWS Security Group resource that defines an ingress rule with cidr_blocks = ["0.0.0.0/0"] on port 22 (SSH).
    • Static IaC Scanning: Integrate scanners like Checkov, tfsec, or Terrascan directly into your CI pipeline. These tools analyze your Terraform or CloudFormation files for thousands of known misconfigurations, such as unencrypted S3 buckets or overly permissive IAM roles, and can fail the build if issues are found.
    • Peer Review Process: Enforce mandatory pull request reviews for all infrastructure changes via branch protection rules in Git. This human-in-the-loop step ensures that a second pair of eyes validates the logic and security implications before a terraform apply is executed.
    • Drift Detection: Continuously monitor your production environment for drift—manual changes made outside of your IaC workflow. Tools like driftctl or built-in features in Terraform Cloud can detect these changes and alert your team, allowing you to remediate them and maintain the integrity of your code-defined state.

    OpsMoon Expertise: Our cloud and DevOps engineers specialize in building secure, compliant, and scalable infrastructure using IaC. We can help you integrate tools like Checkov and OPA into your CI/CD pipelines, establish robust peer review workflows, and implement automated drift detection to ensure your infrastructure remains secure and consistent.

    5. Establish Comprehensive Logging, Monitoring, and Observability

    Comprehensive logging, monitoring, and observability form the bedrock of a proactive security posture, enabling you to see and understand what is happening across your applications and infrastructure in real-time. Instead of reacting to incidents after significant damage is done, this practice allows for the rapid detection of suspicious activities, forensic investigation of breaches, and continuous verification of security controls. It goes beyond simple log collection by correlating logs, metrics, and traces to provide deep context into system behavior.

    This approach transforms your operational data into a powerful security tool. By establishing a centralized system for collecting, analyzing, and alerting on security-relevant events, you can identify threats like unauthorized access attempts or data exfiltration as they occur. This visibility is not just a best practice; it's often a mandatory requirement for meeting compliance standards like SOC 2, ISO 27001, and GDPR.

    How Comprehensive Observability Works in Practice

    Implementing a robust observability strategy involves instrumenting your entire stack to emit detailed telemetry data and funneling it into a centralized platform for analysis and alerting. For a deeper dive into modern observability platforms, consider reviewing how a service like Datadog provides security monitoring across complex environments. A typical implementation includes:

    • Log Aggregation: Centralize logs from all sources, including applications, servers, load balancers, firewalls, and cloud services (e.g., AWS CloudTrail, VPC Flow Logs). Use agents like Fluentd or Vector to ship structured logs (e.g., JSON format) to a centralized platform like the ELK Stack (Elasticsearch, Logstash, Kibana) or managed solutions like Splunk or Datadog.
    • Real-Time Monitoring & Alerting: Define and configure alerts for specific security events and behavioral anomalies. Examples include multiple failed login attempts from a single IP within a five-minute window, unexpected privilege escalations in audit logs, or API calls to sensitive endpoints from unusual geographic locations or ASNs.
    • Distributed Tracing: Implement distributed tracing with OpenTelemetry to track the full lifecycle of a request as it moves through various microservices. This is critical for pinpointing the exact location of a security flaw or understanding the attack path during an incident by visualizing the service call graph.
    • Security Metrics & Dashboards: Create dashboards to visualize key security metrics, such as authentication success/failure rates, firewall block rates, and the number of critical vulnerabilities detected by scanners over time. This provides an at-a-glance view of your security health and trends.

    OpsMoon Expertise: Our observability specialists can design and deploy a scalable logging and monitoring stack tailored to your specific security and compliance needs. We can configure tools like the ELK Stack or Datadog, establish critical security alerts, and create custom dashboards to give you actionable insights into your environment's security posture.

    6. Implement Network Segmentation and Zero Trust Architecture

    A Zero Trust Architecture (ZTA) is a modern security model built on the principle of "never trust, always verify." It assumes that threats can exist both outside and inside the network, so it eliminates the concept of a trusted internal network and requires strict verification for every user, device, and application attempting to access resources. This approach, often combined with network segmentation, is a critical software security best practice for minimizing the potential impact, or "blast radius," of a security breach.

    A diagram illustrating a multi-layered security model with padlocks and arrows, representing a process of access control.

    The core principle is to enforce granular access policies based on identity and context, not network location. By segmenting the network into smaller, isolated zones and applying strict access controls between them, you can prevent lateral movement from a compromised component to the rest of the system. This model is essential for modern, distributed architectures like microservices and cloud environments where traditional perimeter security is no longer sufficient.

    How Zero Trust Works in Practice

    Implementing a Zero Trust model involves layering multiple security controls to validate every access request dynamically. For a detailed overview of the core principles, you can explore the NIST Special Publication on Zero Trust Architecture. A practical implementation often includes:

    • Micro-segmentation: In a Kubernetes environment, use Network Policies to define explicit ingress and egress rules for pods based on labels. For instance, a policy can specify that pods with the label app=frontend can only initiate traffic to pods with the label app=api-gateway on TCP port 8080.
    • Identity-Based Access: Enforce strong authentication and authorization for all service-to-service communication. Implementing a service mesh like Istio or Linkerd allows you to enforce mutual TLS (mTLS), where each microservice presents a cryptographic identity (e.g., SPIFFE/SPIRE) to authenticate itself before any communication is allowed.
    • Least Privilege Access: Grant users and services the minimum level of access required to perform their functions. Use Role-Based Access Control (RBAC) in Kubernetes or Identity and Access Management (IAM) in cloud providers to enforce this principle rigorously. An IAM role for an EC2 instance should only have permissions for the specific AWS services it needs to call.
    • Continuous Monitoring: Actively monitor network traffic and access logs for anomalous behavior or policy violations. For example, use VPC Flow Logs and a SIEM to set up alerts for any attempts to access a production database from an unauthorized service or IP range, even if the firewall would have blocked it.

    OpsMoon Expertise: Our platform engineers specialize in designing and implementing robust Zero Trust architectures. We can help you deploy and configure service meshes like Istio, write and manage Kubernetes Network Policies, and establish centralized identity and access management systems to secure your cloud-native applications from the ground up.

    7. Enable Automated Security Testing (SAST, DAST, SCA)

    Integrating automated security testing is a non-negotiable software security best practice for modern development teams. This approach embeds different types of security analysis directly into the CI/CD pipeline, allowing for continuous and rapid feedback on the security posture of your code. By automating these checks, you can systematically catch vulnerabilities before they reach production, without slowing down development velocity.

    The three core pillars of this practice are SAST, DAST, and SCA. SAST (Static Application Security Testing) analyzes your source code for flaws without executing it. DAST (Dynamic Application Security Testing) tests your running application for vulnerabilities, and SCA (Software Composition Analysis) scans your dependencies for known security issues. Together, they provide comprehensive, automated security coverage.

    How Automated Security Testing Works in Practice

    Implementing automated security testing involves selecting the right tools for your technology stack and integrating them at key stages of your CI/CD pipeline. The goal is to create a safety net that automatically flags potential security risks, often blocking a build or deployment if critical issues are found. For a deeper look at security scanning tools, consider this OWASP Source Code Analysis Tools list. A robust setup includes:

    • Static Application Security Testing (SAST): Integrate a tool like SonarQube, Semgrep, or GitHub’s native CodeQL to scan code on every commit or pull request. This provides developers with immediate feedback on security hotspots, such as potential SQL injection vulnerabilities identified by taint analysis or hardcoded secrets.
    • Software Composition Analysis (SCA): Use tools like Snyk, Dependabot, or JFrog Xray to scan third-party libraries and frameworks. SCA tools check your project's manifests (e.g., package-lock.json, pom.xml) against a database of known vulnerabilities (CVEs) and can automatically create pull requests to update insecure packages.
    • Dynamic Application Security Testing (DAST): Configure a DAST tool, such as OWASP ZAP or Burp Suite, to run against a staging or test environment after a successful deployment. The pipeline can trigger an authenticated scan that crawls the application, simulating external attacks to find runtime vulnerabilities like cross-site scripting (XSS) or insecure cookie configurations.
    • Security Gates: Establish automated quality gates in your CI/CD pipeline. For example, configure your Jenkins or GitLab CI pipeline to fail if an SCA scan detects a high-severity vulnerability (CVSS score > 7.0) with a known exploit, preventing insecure code from being promoted.

    OpsMoon Expertise: Our team specializes in integrating comprehensive security testing into your CI/CD pipelines. We can help you select, configure, and tune SAST, DAST, and SCA tools to minimize false positives, establish meaningful security gates, and create dashboards that provide clear visibility into your application's security posture.

    8. Enforce Principle of Least Privilege (PoLP) and RBAC

    The Principle of Least Privilege (PoLP) is a foundational security concept stating that any user, program, or process should have only the bare minimum permissions necessary to perform its function. When combined with Role-Based Access Control (RBAC), which groups users into roles with defined permissions, PoLP becomes a powerful tool for controlling access and minimizing the potential damage from a compromised account or service. This is one of the most critical software security best practices for preventing lateral movement and privilege escalation.

    Instead of granting broad, default permissions, this approach forces a deliberate and granular assignment of access rights. By restricting what an entity can do, you dramatically shrink the attack surface. If a component is compromised, the attacker's capabilities are confined to that component’s minimal set of permissions, preventing them from accessing sensitive data or other parts of the system.

    How PoLP and RBAC Work in Practice

    Implementing PoLP and RBAC involves defining roles based on job functions and assigning the most restrictive permissions possible to each. The goal is to move away from a model of implicit trust to one of explicit, verified access. A comprehensive access control strategy is detailed in resources like the NIST Access Control Guide. A practical implementation includes:

    • Cloud Environments: Use AWS IAM policies or Azure AD roles to grant specific permissions. For instance, an application service running on EC2 that only needs to read objects from a specific S3 bucket should have an IAM role with a policy allowing only s3:GetObject on the resource arn:aws:s3:::my-specific-bucket/*, not s3:* on *.
    • Kubernetes: Leverage Kubernetes RBAC to create fine-grained Roles and ClusterRoles. A CI/CD service account deploying to the production namespace should be bound to a Role with permissions limited to create, update, and patch on Deployments and Services resources only within that namespace.
    • Application Level: Define user roles within the application itself (e.g., 'admin', 'editor', 'viewer') and enforce access checks at the API gateway or within the application logic to ensure users can only perform actions and access data aligned with their role.
    • Databases: Create dedicated database roles with specific SELECT, INSERT, or UPDATE permissions on certain tables or schemas, rather than granting a service account full db_owner or root privileges.

    OpsMoon Expertise: Our cloud and security experts can help you design and implement a robust RBAC strategy across your entire technology stack. We audit existing permissions, create least-privilege IAM policies for AWS, Azure, and GCP, and configure Kubernetes RBAC to secure your containerized workloads, ensuring access is strictly aligned with operational needs.

    9. Implement Incident Response and Disaster Recovery Planning

    Even with the most robust preventative measures, security incidents can still occur. A comprehensive Incident Response (IR) and Disaster Recovery (DR) plan is a critical software security best practice that prepares your organization to detect, respond to, and recover from security breaches and service disruptions efficiently. This proactive planning minimizes financial damage, protects brand reputation, and ensures operational resilience by providing a clear, actionable roadmap for chaotic situations.

    The goal is to move from a reactive, ad-hoc scramble to a structured, rehearsed process. A well-defined plan enables your team to contain threats quickly, eradicate malicious actors, restore services with minimal data loss, and conduct post-mortems to prevent future occurrences. It addresses not just the technical aspects of recovery but also the crucial communication and coordination required during a crisis.

    How IR and DR Planning Works in Practice

    Implementing a formal IR and DR strategy involves creating documented procedures, assigning clear responsibilities, and regularly testing your organization's readiness. For a deeper dive into establishing these procedures, explore our Best Practices for Incident Management. A mature plan includes several key components:

    • Preparation Phase: Develop detailed incident response playbooks for common scenarios like ransomware attacks, data breaches, or DDoS attacks. These playbooks should contain technical checklists, communication templates, and contact information. Establish a dedicated Computer Security Incident Response Team (CSIRT) with defined roles and escalation paths.
    • Detection & Analysis: Implement robust monitoring and alerting systems using SIEM (Security Information and Event Management) and observability tools. Define clear criteria for what constitutes a security incident to trigger the response plan, such as alerts from a Web Application Firewall (WAF) indicating a successful SQL injection attack.
    • Containment, Eradication & Recovery: Outline specific technical procedures to isolate affected systems (e.g., using security groups to quarantine a compromised EC2 instance), preserve forensic evidence (e.g., taking a disk snapshot), remove the threat, and restore operations from secure, immutable backups. This includes DR strategies like automated failover to a secondary region or rebuilding services from scratch using Infrastructure as Code (IaC) templates.
    • Post-Incident Activity: Conduct a blameless post-mortem to analyze the incident's root cause, evaluate the effectiveness of the response, and identify areas for improvement. Use these findings to update playbooks, harden security controls, and improve monitoring. Regularly test the plan through tabletop exercises and full-scale DR simulations (e.g., chaos engineering).

    OpsMoon Expertise: Our cloud and security experts specialize in designing and implementing resilient systems based on frameworks like the AWS Well-Architected Framework. We can help you create automated DR strategies, build immutable infrastructure, configure robust backup and recovery solutions, and conduct realistic failure-scenario testing to ensure your business can withstand and recover from any incident.

    10. Maintain Security Patches and Dependency Updates

    Proactive patch management is a critical software security best practice focused on keeping all components of your software stack, including operating systems, third-party libraries, and frameworks, current with the latest security updates. Neglected dependencies are a primary vector for attacks, as adversaries actively scan for systems running software with known, unpatched vulnerabilities (e.g., Log4Shell, Struts). This practice establishes a systematic process for identifying, testing, and deploying patches to close these security gaps swiftly.

    The core principle is to treat dependency and patch management not as an occasional cleanup task but as a continuous, automated part of your operations. By integrating tools that automatically detect outdated components and vulnerabilities, you can address threats before they are exploited, maintaining the integrity and security of your applications and infrastructure.

    How Patch and Dependency Management Works in Practice

    Effective implementation involves automating the detection and, where possible, the application of updates. This reduces manual effort and minimizes the window of exposure. A robust strategy balances the urgency of security fixes with the need for stability, ensuring updates do not introduce breaking changes.

    • Automated Dependency Scanning: Integrate tools like GitHub’s Dependabot, Renovate, or Snyk directly into your source code repositories. Configure them to automatically scan your package.json, pom.xml, or requirements.txt files daily, identify vulnerable dependencies, and create pull requests with the necessary version bumps.
    • Prioritization and Triage: Not all patches are equal. Use the Common Vulnerability Scoring System (CVSS) and other threat intelligence (e.g., EPSS – Exploit Prediction Scoring System) to prioritize updates. Critical vulnerabilities with known public exploits (e.g., CISA KEV catalog) must be addressed within a strict SLA (e.g., 24-72 hours).
    • Base Image and OS Patching: Automate the process of updating container base images (e.g., node:18-alpine) and underlying host operating systems. Set up CI/CD pipelines that periodically pull the latest secure base image, rebuild your application container, and run it through a full regression test suite before promoting it to production.
    • Systematic Rollout: Implement phased rollouts (canary or blue-green deployments) for significant updates, especially for core infrastructure like the Kubernetes control plane or service mesh components. This allows you to validate functionality and performance on a subset of traffic before a full production rollout.
    • End-of-Life (EOL) Monitoring: Actively track the lifecycle of your software components. When a library or framework (e.g., Python 2.7, AngularJS) reaches its end-of-life, it will no longer receive security patches, making it a permanent liability. Plan migrations away from EOL software well in advance.

    OpsMoon Expertise: Our infrastructure specialists excel at creating and managing large-scale, automated patch management systems. We can configure tools like Renovate for complex monorepos, build CI/CD pipelines that automate container base image updates and rebuilds, and establish clear Service Level Agreements (SLAs) for deploying critical security patches across your entire infrastructure.

    Top 10 Software Security Best Practices Comparison

    Practice Implementation complexity Resource requirements Expected outcomes Ideal use cases Key advantages
    Implement Secure Software Development Lifecycle (SSDLC) High — process changes, tool integration, training Moderate–High: security tools, CI/CD integration, skilled staff Fewer vulnerabilities, improved compliance, safer releases Organizations building custom apps, regulated industries Shifts security left, reduces remediation costs, builds security culture
    Enforce Secret Management and Credential Rotation Medium — vault integration and automation Low–Medium: secret vault, rotation tooling, policies Reduced credential leaks, audit trails, limited blast radius Multi-cloud, Kubernetes, services with many secrets Eliminates hardcoded creds, automated rotation, compliance-ready
    Implement Container and Image Security Scanning Medium — CI and registry integration Medium: scanners, compute, vulnerability DB updates, triage Fewer vulnerable images, SBOMs, improved supply-chain visibility Containerized deployments, Kubernetes clusters, CI/CD pipelines Prevents vulnerable containers in prod, enforces image policies
    Deploy Infrastructure as Code (IaC) with Security Reviews Medium–High — IaC adoption and policy-as-code Medium: IaC tools, policy engines, code review processes Consistent secure infra, drift detection, auditable changes Cloud infrastructure teams, multi-environment deployments Repeatable secure deployments, policy enforcement at scale
    Establish Comprehensive Logging, Monitoring, and Observability Medium — telemetry pipelines and alert tuning High: storage, SIEM/monitoring platforms, analyst capacity Faster detection/investigation, forensic evidence, compliance Production systems needing incident detection and audits Provides visibility for threat hunting, detection, and audits
    Implement Network Segmentation and Zero Trust Architecture High — architectural redesign, service mesh, identity High: network, identity, policy management, ongoing ops Reduced lateral movement, granular access control Distributed systems, hybrid cloud, high-security environments Limits blast radius, enforces least privilege across network
    Enable Automated Security Testing (SAST, DAST, SCA) Medium — tool selection and CI integration Medium: testing tools, maintenance, triage resources Early vulnerability detection, faster developer feedback Active dev teams with CI/CD and rapid release cadence Automates security checks, scales with development workflows
    Enforce Principle of Least Privilege (PoLP) and RBAC Medium — role modeling and governance Medium: IAM tooling, access reviews, automation Reduced unauthorized access, simpler audits, less overprivilege Teams with many users/services and cloud resources Minimizes overprivilege, reduces insider and lateral risks
    Implement Incident Response and Disaster Recovery Planning Medium — process design and regular testing High: runbooks, backup systems, forensic tools, drills Lower MTTD/MTTR, clear recovery procedures, auditability Organizations requiring resilience, regulated industries Improves recovery readiness and organizational resilience
    Maintain Security Patches and Dependency Updates Low–Medium — automation and testing workflows Medium: update pipelines, test environments, monitoring Reduced exposure to known vulnerabilities, lower technical debt All software environments, especially dependency-heavy projects Prevents exploitation of known flaws, keeps stack maintainable

    From Theory to Practice: Operationalizing Your Security Strategy

    Navigating the landscape of modern software development requires more than just building functional features; it demands a deep, ingrained commitment to security. We have explored ten critical software security best practices that form the bedrock of a resilient and trustworthy application. From embedding security into the earliest stages with a Secure Software Development Lifecycle (SSDLC) to establishing robust incident response plans, each practice serves as a vital layer in a comprehensive defense-in-depth strategy.

    The journey from understanding these principles to implementing them effectively is where the real challenge lies. It is not enough to simply acknowledge the importance of secret management or dependency updates. The key to a mature security posture is operationalization: transforming these concepts from checklist items into automated, integrated, and repeatable processes within your daily workflows.

    Key Takeaways for a Mature Security Posture

    The transition from a reactive to a proactive security model hinges on several core philosophical and technical shifts. Mastering these is not just about preventing breaches; it is about building a competitive advantage through reliability and user trust.

    • Security is a Shared Responsibility: The "shift-left" principle is not just a buzzword. It represents a cultural transformation where developers, operations engineers, and security teams collaborate from day one. Integrating automated security testing (SAST, DAST, SCA) directly into the CI/CD pipeline empowers developers with immediate feedback, making security a natural part of the development process rather than an afterthought.
    • Automation is Your Greatest Ally: Manual security reviews and processes cannot keep pace with modern release cycles. Automating container image scanning, Infrastructure as Code (IaC) security reviews using tools like tfsec or checkov, and enforcing credential rotation policies are essential. Automation reduces human error, ensures consistent policy application, and frees up your engineering talent to focus on more complex strategic challenges.
    • Assume a Breach, Build for Resilience: The principles of Zero Trust Architecture and Least Privilege (PoLP) are critical because they force you to design systems that are secure by default. By assuming that any internal or external actor could be a threat, you are driven to implement stronger controls like network segmentation, strict Role-Based Access Control (RBAC), and comprehensive observability to detect and respond to anomalous activity quickly.

    Your Actionable Next Steps

    Translating this knowledge into action can feel overwhelming, but a structured approach makes it manageable. Start by assessing your current state and identifying the most significant gaps.

    1. Conduct a Maturity Assessment: Where are you today? Do you have an informal SSDLC? Is secret management handled inconsistently? Use the practices outlined in this article as a scorecard to pinpoint your top 1-3 areas for immediate improvement.
    2. Prioritize and Implement Incrementally: Do not try to boil the ocean. Perhaps your most pressing need is to get control over vulnerable dependencies. Start there by integrating an SCA tool into your pipeline. Next, focus on implementing IaC security reviews for your Terraform or CloudFormation scripts. Each small, incremental win builds momentum and demonstrably reduces risk.
    3. Invest in Expertise: Implementing these technical solutions requires a specialized skill set that blends security acumen with deep DevOps engineering expertise. Building secure, automated CI/CD pipelines, configuring comprehensive logging and monitoring stacks, and hardening container orchestration platforms are complex tasks. Engaging with experts who have done it before can accelerate your progress and help you avoid common pitfalls.

    Ultimately, adopting these software security best practices is an ongoing commitment to excellence and a fundamental component of modern software engineering. It is a continuous cycle of assessment, implementation, and refinement that protects your data, your customers, and your reputation in an increasingly hostile digital world.


    Ready to move from theory to a fully operationalized security strategy? The expert DevOps and SRE talent at OpsMoon specializes in implementing the robust, automated security controls your business needs. Schedule a free work planning session today to build a roadmap for a more secure and resilient software delivery pipeline.

  • The technical definition of uptime: a practical guide for engineers

    The technical definition of uptime: a practical guide for engineers

    In system engineering, uptime is the duration for which a system or service is operational and performing its primary function. It's a quantitative measure of reliability, representing the core contract between a service and its users.

    This metric is almost always expressed as a percentage and serves as a critical Key Performance Indicator (KPI) for any digital product, API, or infrastructure component.

    What "Uptime" Really Means in an Engineering Context

    At its core, uptime provides a binary answer to a critical operational query: "Is our system functioning as specified right now?" For an e-commerce platform, this means the entire transaction pipeline—from product discovery to payment processing—is fully operational. For a SaaS application, it means users can authenticate, access data, and execute core features without encountering errors. A high uptime percentage is the clearest indicator of a resilient, well-architected system.

    However, uptime is not a simple "on/off" state. A system is truly "up" only when it's performing its specified function within acceptable performance parameters. Consider a web server that is running but has a saturated connection pool, preventing it from serving HTTP requests. From a user's perspective, the system is down. This distinction is critical when instrumenting monitoring systems to measure user-facing reliability accurately.

    The Core Components of Uptime Calculation

    To accurately measure uptime, you must decompose it into its fundamental components. These are the primitives used to calculate, report, and ultimately improve system reliability.

    • Operational Time: The total time window during which the service is expected to be available to users, as defined by its Service Level Agreement (SLA).
    • Downtime: Any period within the operational time where the service is unavailable or failing to perform its primary function. This includes both unplanned outages and periods of severe performance degradation.
    • Accessibility: The boolean confirmation that the service is reachable by its intended users, verified through synthetic monitoring or real user monitoring (RUM).

    Uptime is more than a technical metric; it's a direct reflection of engineering quality and operational discipline. It builds user trust, protects revenue, and underpins the entire customer experience. High uptime is not achieved by accident—it is the result of a proactive, engineering-led approach to system health.

    The real-world impact of a marginal decrease in this metric can be significant. One report found that when average API uptime fell from 99.66% to 99.46%, the total annual downtime increased by 60%. That seemingly minor 0.2% drop translated to a weekly downtime increase from 34 minutes to 55 minutes—a substantial disruption. You can analyze more of these reliability insights from the team at Uptrends.

    Why a Precise Technical Definition Is Non-Negotiable

    Establishing a clear, technical definition of uptime is the foundational step toward building resilient systems. Without it, engineering teams operate against a vague target, and the business cannot set clear expectations with customers in its SLAs.

    A precise definition enables teams to implement effective monitoring, establish meaningful Service Level Objectives (SLOs), and execute incident response with clear criteria for success. This foundational understanding is a prerequisite for any mature infrastructure monitoring strategy.

    To clarify these concepts, here is a quick-reference table.

    Uptime At a Glance

    This table breaks down the essential concepts of uptime and their technical and business implications.

    Concept Technical Definition Business Impact
    Uptime The percentage of time a system is fully operational and accessible, meeting all its performance criteria. High uptime directly correlates with customer satisfaction, revenue generation, and brand reputation.
    Measurement Calculated as (Total Time - Downtime) / Total Time * 100. Provides a clear, quantitative benchmark for setting SLOs and tracking reliability engineering efforts.
    Business Value The assurance that digital services are consistently available to meet user and business demands. Protects against financial losses, customer churn, and damage to credibility caused by outages.

    Ultimately, a technical understanding of uptime is about quantifying the health and operational promise of your digital services.

    How to Calculate Uptime With Technical Precision

    Calculating uptime requires a rigorous, objective methodology. A precise calculation is the bedrock of any reliability engineering practice—without it, you're operating on assumptions, not data.

    The standard formula is straightforward in principle:

    Uptime % = ((Total Scheduled Time – Downtime) / Total Scheduled Time) * 100

    However, the critical work lies in defining the variables. If "downtime" is not defined with technical specificity, the resulting percentage is operationally useless and can create friction between engineering, product, and business teams.

    Defining the Variables for Accurate Calculation

    To make the formula produce a meaningful metric, you must establish clear, unambiguous definitions for each component. This ensures consistent measurement across all teams and services.

    • Total Scheduled Time: The total duration the service is expected to be operational. For a 24/7 service, this is the total number of minutes in a given period (e.g., a month). Crucially, this must exclude planned maintenance windows only if your Service Level Agreement (SLA) explicitly permits it.
    • Downtime: Any period within the scheduled time when the system fails to meet its functional or performance requirements. Downtime must include periods of severe performance degradation. For instance, an API whose P99 latency exceeds a 2000ms threshold should be considered "down" for that period, even if it's still returning 200 OK responses.

    This dashboard provides a clear visualization of these metrics: average uptime percentage juxtaposed with the change in total downtime.

    A dashboard displaying system uptime metrics, including 99.99% average uptime, old downtime of 30 days, and new downtime of 5 days.

    This provides a direct feedback loop on reliability initiatives. A rising uptime percentage must correlate with a measurable reduction in service unavailability.

    Applying the Uptime Formula: A Practical Example

    Let's apply this to a real-world scenario. Assume a core e-commerce API experienced a 45-minute outage during a 30-day month.

    1. Calculate Total Scheduled Time in minutes:
      • 30 days * 24 hours/day * 60 minutes/hour = 43,200 minutes
    2. Quantify total Downtime:
      • The outage duration is 45 minutes.
    3. Plug these values into the formula:
      • Uptime % = ((43,200 – 45) / 43,200) * 100
      • Uptime % = (43,155 / 43,200) * 100
      • Uptime % = 99.896%

    In a distributed microservices architecture, this becomes more complex. If a non-critical product recommendation service fails but the primary checkout flow remains operational, is the entire system down? The answer lies in your Service Level Objectives (SLOs). A best practice is to calculate uptime independently for each critical user journey.

    The primary goal is not merely reducing outage duration but minimizing the time to full recovery. This is where metrics like Mean Time To Recovery (MTTR) are paramount. A low MTTR is the direct output of robust observability, well-defined runbooks, and automated incident response systems. To improve your incident response capabilities, it's essential to implement strategies that lower your Mean Time To Recovery.

    Translating Uptime Percentages into Downtime Reality

    Abstract percentages like "99.9% uptime" can obscure the operational reality. The following table translates these common targets—often referred to as "the nines"—into the corresponding "downtime budget" they allow.

    Translating Uptime Percentages into Downtime Reality

    Uptime Percentage The Nines Downtime per Day Downtime per Week Downtime per Month Downtime per Year
    99% Two Nines 14m 24s 1h 40m 48s 7h 18m 17s 3d 15h 39m
    99.9% Three Nines 1m 26s 10m 5s 43m 50s 8h 45m 57s
    99.95% 43s 5m 2s 21m 55s 4h 22m 58s
    99.99% Four Nines 8.6s 1m 1s 4m 23s 52m 36s
    99.999% Five Nines 0.86s 6s 26s 5m 15s
    99.9999% Six Nines 0.086s 0.6s 2.6s 31.6s

    This table highlights the exponential difficulty of increasing reliability. The transition from "three nines" to "four nines" reduces the acceptable annual downtime from over eight hours to under one hour—a significant engineering investment requiring mature operational practices.

    Uptime vs. Availability vs. Reliability

    In engineering, precise terminology is essential for setting clear objectives and avoiding costly misinterpretations. While often used interchangeably, uptime, availability, and reliability are distinct concepts. Understanding these distinctions is fundamental to establishing a mature engineering culture.

    Uptime is the most basic measure. It is a raw, quantitative metric of a system's operational state. Is the server powered on? Are the application processes running? Uptime is system-centric and does not account for whether the service is accessible or performing its function correctly.

    Availability, in contrast, is user-centric. A system can have high uptime but zero availability. This is a critical distinction. Availability answers the definitive question: "Can a user successfully execute a transaction on the service right now?" It encompasses the entire service delivery chain, including networking, firewalls, load balancers, and dependencies.

    Illustrative diagram explaining the relationship between uptime, availability, and reliability concepts.

    For example, a database server could have 100% uptime, but if a misconfigured network ACL blocks all incoming connections, its availability is 0%. Uptime metrics would report green while the service is effectively offline for users.

    Differentiating Uptime from Availability

    The fundamental difference is perspective: uptime is system-centric, while availability is user-centric.

    Consider a fleet of autonomous delivery drones:

    • Uptime: Measures the total time the drone's flight systems are powered on. A drone on a charging pad, fully powered but not in flight, contributes to uptime.
    • Availability: Measures whether a drone can accept a delivery request and successfully initiate flight. A drone that is powered on (high uptime) but grounded due to being inside a no-fly zone has zero availability.

    Availability is uptime plus accessibility. It is the true measure of a service's readiness to perform its function for a user and is therefore a far more valuable indicator of system health.

    This distinction directly influences the formulation of Service Level Objectives (SLOs). An SLO based solely on process uptime might show 99.99%, while users experience persistent connection timeouts—a clear availability crisis masked by a misleading metric.

    Introducing Reliability into the Equation

    If uptime is a historical record and availability is a real-time state, reliability is a forward-looking probability. Reliability is the probability that a system will perform its required function without failure under stated conditions for a specified period. It answers the question, "What is the likelihood this service will continue to operate correctly for the next X hours?"

    Reliability is measured by forward-looking metrics, primarily:

    • Mean Time Between Failures (MTBF): The predicted elapsed time between inherent failures of a system during normal operation. A higher MTBF indicates a more reliable system.
    • Mean Time To Repair (MTTR): The average time required to repair a failed component or device and return it to operational status. A low MTTR indicates a resilient system with effective incident response.

    Returning to our drone analogy:

    • Reliability: The probability that a drone can complete a full delivery mission without hardware or software failure. A drone with an MTBF of 2,000 flight hours is significantly more reliable than one with an MTBF of 200 hours.

    A system can be highly available yet unreliable. Consider a web service that crashes every hour but is restarted by a watchdog process in under one second. Its availability would be extremely high—perhaps 99.99%—but its frequent failures make it highly unreliable. This instability erodes user trust, even if total downtime is minimal. This is why mature engineering teams focus on both increasing MTBF (preventing failures) and decreasing MTTR (recovering quickly).

    Using SLAs and SLOs to Set Uptime Targets

    While the technical definition of uptime is a clear metric, its real power is realized when used to manage expectations and drive business outcomes. This is the domain of Service Level Agreements (SLAs) and Service Level Objectives (SLOs). These instruments transform uptime from a passive metric into an active commitment.

    An SLA is a formal contract between a service provider and a customer that defines the level of service expected. It contractually guarantees a specific level of uptime, often with financial penalties (e.g., service credits) for non-compliance.

    An SLO, conversely, is an internal reliability target set by an engineering team. A well-architected SLO is always more stringent than the external SLA it is designed to support.

    The Crucial Buffer Between SLOs and SLAs

    The delta between an SLO and an SLA creates an "error budget." For example, if an SLA promises 99.9% uptime, the internal SLO might be set to 99.95%. This gap is a critical operational buffer.

    This buffer provides the engineering team with a calculated risk allowance. It permits them to perform maintenance, deploy new features, or absorb minor incidents without violating the customer-facing SLA. This is how high-velocity teams balance innovation with reliability.

    An SLO is your engineering team's commitment to itself. An SLA is your organization's commitment to its customers. The error budget between them is the space where calculated risks, such as feature deployments and infrastructure changes, can occur.

    This strategic gap is a core principle of modern service reliability engineering, which seeks to quantify the trade-offs between the cost of achieving perfect reliability and the need for rapid innovation.

    Setting Realistic Uptime Targets for Different Services

    Not all services are created equal; their uptime targets must reflect their criticality. The cost and engineering effort required to achieve each additional "nine" of uptime increase exponentially. Therefore, targets must be aligned with business impact.

    Consider these technical examples:

    • B2B SaaS Platform: An SLO of 99.95% is a strong, achievable target. This allows for approximately 21 minutes of downtime per month, an acceptable threshold for most non-mission-critical business applications.
    • Core Financial API: For a payment processing service, the stakes are far higher. An uptime target of 99.999% ("five nines") is often the standard. This provides an error budget of only 26 seconds of downtime per month, reflecting its critical function.
    • Internal Analytics Dashboard: For an internal-facing tool, a more lenient target is appropriate. A 99.5% uptime SLO provides over three hours of downtime per month, which is sufficient for non-production systems.

    While outage frequency is declining, dependency on third-party services introduces new failure modes. Recent analysis shows that over a nine-year period, these external providers were responsible for two-thirds of all publicly reported outages. Furthermore, IT and networking issues now account for 23% of impactful incidents. You can discover more insights on outage trends from the Uptime Institute. This data underscores the necessity of having precise SLAs with all third-party vendors.

    By using SLAs and SLOs strategically, engineering leaders can manage reliability as a feature, aligning operational goals with specific business requirements.

    A Practical Playbook for Engineering High Uptime

    Achieving a high uptime percentage is not a matter of chance; it is the direct outcome of deliberate engineering decisions and a culture of operational excellence. Engineering for reliability means designing systems that anticipate and gracefully handle failure. This requires a systematic approach to identifying and eliminating single points of failure across architecture, infrastructure, and deployment processes.

    This technical playbook outlines five core pillars for building and maintaining highly available systems. Each pillar provides actionable strategies to systematically enhance resilience.

    Five pillars supporting high uptime: redundancy, observability, automated response, zero-downtime, and infrastructure as code.

    Pillar 1: Build in Architectural Redundancy

    The foundational principle of high availability is the elimination of single points of failure. Architectural redundancy ensures that the failure of a single component does not cascade into a full-system outage. A redundant component is always available to take over the workload, often transparently to the user.

    Key implementation tactics include:

    • Failover Clusters: For stateful systems like databases, active-passive or active-active cluster configurations are essential. If a primary database node fails, a standby replica is automatically promoted, preventing a database failure from causing an application-level outage.
    • Multi-Region Load Balancing: This is the highest level of redundancy. By distributing traffic across multiple, geographically isolated regions (e.g., AWS us-east-1 and us-west-2) using services like AWS Route 53 or Google Cloud Load Balancing, you can survive a complete regional outage. Traffic is automatically rerouted to healthy regions, maintaining service availability.

    Pillar 2: Get Ahead with Proactive Observability

    You cannot fix what you cannot see. Proactive observability involves instrumenting systems to provide deep, real-time insights into their health and performance. The objective is to detect anomalous behavior and potential issues before they escalate into user-facing outages.

    True observability is not just data collection; it is the ability to ask arbitrary questions about your system's state without having to know in advance what you wanted to ask. It shifts the operational posture from reactive ("What broke?") to proactive ("Why is P99 latency increasing?").

    Implementing this requires a robust monitoring stack, using tools like Prometheus for time-series metric collection and Grafana for visualization and alerting. This allows you to monitor leading indicators of failure, such as P99 latency, error rates (e.g., HTTP 5xx), and resource saturation, enabling preemptive action.

    Pillar 3: Automate Your Incident Response

    During an incident, every second of manual intervention increases the Mean Time To Repair (MTTR). Automated incident response aims to minimize MTTR by using software to handle common failure scenarios automatically, removing human delay and error from the recovery process.

    A powerful technique is runbook automation. Pre-defined scripts are triggered by specific alerts from your observability platform. For example, an alert indicating high memory utilization on a web server can automatically trigger a script to perform a graceful restart of the application process. The issue is remediated in seconds, often before an on-call engineer is even paged.

    Pillar 4: Ship Code with Zero-Downtime Deployments

    Deployments are a leading cause of self-inflicted downtime. Zero-downtime deployment strategies allow you to release new code into production without interrupting service. This is a mandatory component of any modern CI/CD pipeline.

    Two common strategies are:

    • Blue-Green Deployments: You maintain two identical production environments ("blue" and "green"). New code is deployed to the inactive environment (green). After validation, the load balancer is reconfigured to route all traffic to the green environment. If issues arise, traffic can be instantly routed back to blue, providing near-instantaneous rollback.
    • Canary Releases: The new version is gradually rolled out to a small subset of users. Its performance and error rates are closely monitored. If stable, the rollout is progressively expanded to the entire user base. This strategy minimizes the "blast radius" of a faulty deployment.

    Pillar 5: Define Your Infrastructure as Resilient Code

    Manually configured infrastructure is brittle and prone to human error. Resilient Infrastructure as Code (IaC), using tools like Terraform, allows you to define and manage your entire infrastructure declaratively. This ensures environments are consistent, repeatable, and easily recoverable.

    With IaC, you can codify redundancy and fault-tolerant patterns, ensuring they are applied consistently across all environments. If a critical server fails, your Terraform configuration can be used to provision a new, identical instance in minutes, drastically reducing manual recovery time. Robust infrastructure is critical, as foundational issues are a common cause of outages. The weighted average Power Usage Effectiveness (PUE) in data centers has stagnated at 1.54 for six years, and half of all operators have experienced a major outage in the last three years, often due to power or cooling failures. As you can learn more about data center reliability insights here, disciplined infrastructure management is paramount.

    Common Questions We Hear About Uptime

    When moving from theoretical discussion to practical implementation of reliability engineering, several key questions consistently arise. These are the real-world trade-offs and definitions that engineering teams must navigate.

    Let's address some of the most common questions with technical clarity.

    Does Scheduled Maintenance Count as Downtime?

    The definitive answer is determined by your Service Level Agreement (SLA). A well-drafted SLA will specify explicit, pre-communicated maintenance windows. Downtime occurring within these approved windows is typically excluded from uptime calculations.

    However, if the maintenance exceeds the scheduled window or causes an unintended service impairment, the downtime clock starts immediately. The goal of a mature engineering organization is to leverage zero-downtime deployment techniques to make this question moot.

    What Uptime Percentage Should We Even Aim For?

    The appropriate uptime target is a function of customer expectations, business criticality, and budget. The pursuit of each additional "nine" of uptime has an exponential cost curve in terms of both infrastructure and engineering complexity.

    A more effective approach is to frame the target in terms of its user impact and error budget:

    • 99.9% ("Three Nines"): An excellent and achievable target for most SaaS products. This equates to an annual downtime budget of 8.77 hours. This level of reliability satisfies most users without requiring an exorbitant budget.
    • 99.99% ("Four Nines"): This is the domain of critical services like payment gateways or core platform APIs, where downtime has a direct and immediate financial impact. The annual downtime budget is just 52.6 minutes.
    • 99.999% ("Five Nines"): Reserved for mission-critical infrastructure where failure is not an option (e.g., telecommunications, core financial systems). This allows for a razor-thin 5.26 minutes of downtime per year.

    How Do MTBF and MTTR Fit Into This?

    Mean Time Between Failures (MTBF) and Mean Time To Repair (MTTR) are not merely related to uptime; they are the two primary variables that determine it.

    Uptime is an emergent property of a high MTBF and a low MTTR.

    Think of it as a two-pronged strategy:

    • MTBF is a measure of reliability. It quantifies how long a system operates correctly before a failure occurs. You increase MTBF through robust architectural design, redundancy, and practices like chaos engineering.
    • MTTR is a measure of recoverability. It quantifies how quickly you can restore service after a failure. You decrease MTTR through advanced observability, automated incident response, and well-rehearsed on-call procedures.

    A truly resilient system is achieved by engineering improvements on both fronts. You build systems designed to fail less frequently (high MTBF) while ensuring that when they inevitably do fail, they are recovered rapidly (low MTTR).


    Building and maintaining high-uptime systems requires a dedicated strategy and expert execution. At OpsMoon, we connect you with the top 0.7% of DevOps engineers who specialize in creating resilient, scalable infrastructure. Whether you need to implement zero-downtime deployments, build out multi-region redundancy, or sharpen your incident response, our experts are ready to help. Start with a free work planning session to map your path to superior reliability. Get in touch with us today.

  • What is the Goal of a DevOps Methodology? A Technical Guide

    What is the Goal of a DevOps Methodology? A Technical Guide

    At its core, the goal of a DevOps methodology is to unify software development (Dev) and IT operations (Ops) to ship better software, faster and more reliably. It systematically dismantles the organizational and technical walls between the teams building new features and the teams responsible for production stability, creating a single, highly automated workflow from code commit to production deployment.

    This fusion is engineered to increase deployment frequency and reduce lead time for changes while simultaneously improving operational stability and mean time to recovery (MTTR).

    Balancing Software Velocity and System Stability

    In traditional IT structures, a fundamental conflict exists. Development teams are incentivized by feature velocity—how quickly they can ship new code. Operations teams are measured on stability and uptime, making them inherently risk-averse to frequent changes. This creates a natural tension, a "wall of confusion" that slows down value delivery and pits teams against each other.

    DevOps doesn't just reduce this friction; it re-engineers the system to align incentives and processes.

    Consider a Formula 1 team. The driver (Development) is focused on maximum speed to win the race. The pit crew (Operations) needs the car to be mechanically sound and predictable to avoid catastrophic failure. Without tight integration and real-time data flow, they are guaranteed to lose. The driver might over-stress the engine, or an overly cautious pit crew might perform slow, unnecessary checks that cost valuable seconds.

    A true DevOps culture integrates them into a single functional unit. The driver receives constant telemetry from the car (monitoring), and the pit crew uses that data to perform precise, high-speed adjustments (automated deployments). They share the same objective, measured by the same KPIs: win the race by perfectly balancing raw speed with flawless execution and resilience.

    The Shift From Silos to Synergy

    This is more than a procedural adjustment; it's a fundamental re-architecture of culture and technology. High-performing organizations that correctly implement DevOps can deploy 30 times more frequently with 200 times shorter lead times than their peers. This performance leap isn't achieved by a single tool—it's the result of breaking down silos, automating workflows, and focusing the entire engineering organization on shared, measurable outcomes. You can read more about the impact of these statistics on DevOps trends from invensislearning.com.

    To fully grasp this paradigm, it’s useful to understand its relationship with other frameworks. DevOps and Agile, for example, both value iterative delivery and continuous improvement, but they address different scopes within the software lifecycle. A deeper technical comparison of Agile vs DevOps can clarify their distinct roles and synergistic potential.

    To illustrate the technical and philosophical shift, let's contrast the operational goals.

    DevOps Goals vs Traditional IT Goals

    The table below contrasts the siloed metrics of traditional IT with the shared, outcome-focused goals of a DevOps culture. It’s a clear illustration of the shift from protecting functional domains to optimizing end-to-end value delivery.

    Metric Traditional IT Goal DevOps Goal
    Deployment Minimize deployments to reduce risk. Each release is a large, high-stakes event. Increase deployment frequency. Small, frequent releases lower risk and speed up feedback.
    Failure Management Avoid failure at all costs (Maximize Mean Time Between Failures – MTBF). Recover from failure instantly (Minimize Mean Time To Recovery – MTTR).
    Team Responsibility Dev builds it, Ops runs it. Clear separation of duties and handoffs. "You build it, you run it." Shared ownership across the entire application lifecycle.
    Change Control and restrict change through rigid processes and long approval cycles. Embrace and enable change through automation and collaborative review.
    Measurement Measure individual team performance (e.g., tickets closed, server uptime). Measure end-to-end delivery performance (e.g., lead time for changes, change failure rate).

    This comparison makes it obvious: DevOps isn't just about doing the same things faster. It's about changing what you measure, what you value, and ultimately, how you work together.

    The central objective is to create a resilient, efficient, and value-driven software delivery lifecycle. It’s not just about tools or automation; it's a strategic approach to achieving measurable business outcomes through a combination of cultural philosophy and technical excellence.

    Ultimately, DevOps redefines engineering success. Instead of grading teams on isolated metrics like "story points completed" or "99.9% server uptime," the focus shifts to holistic results—like faster time-to-market, improved mean time to recovery (MTTR), and lower change failure rates. This alignment gets the entire organization moving in the same direction, delivering real value to users faster and more safely than ever before.

    Exploring the Five Technical Pillars of DevOps

    To truly understand DevOps, we must move beyond the abstract goal of "balancing speed and stability" and analyze the concrete technical pillars that enable it. These five pillars—Speed, Quality, Stability, Collaboration, and Security—are not just concepts. They are implemented through specific engineering practices and toolchains. Each pillar supports the others, creating a robust system for delivering high-quality software.

    This concept map illustrates the core principle: a continuous, automated loop between Development and Operations.

    DevOps concept map showing the continuous flow between Development and Operations for faster delivery and stable systems.

    It’s no longer a linear handoff from one team to the next. Development and Operations are fused into a single, unending cycle of building, deploying, and operating software. This continuous flow is what powers the five pillars.

    Accelerating Delivery with Speed

    Speed in DevOps is not about cutting corners; it's about building an automated, repeatable, and low-friction pipeline from a developer's local machine to production. Continuous Integration/Continuous Delivery (CI/CD) pipelines are the engine of this speed.

    A CI/CD pipeline automates the entire software release process: compiling code, executing automated tests, packaging artifacts (e.g., Docker images), and deploying to various environments. Instead of manual handoffs that introduce delays and human error, automated pipelines execute these steps in minutes.

    A crucial enabler of speed is Infrastructure as Code (IaC). Using declarative tools like Terraform or AWS CloudFormation, you define your entire infrastructure—VPCs, subnets, EC2 instances, load balancers, databases—in version-controlled configuration files.

    With IaC, provisioning a complete, production-identical staging environment is reduced to a single command (terraform apply). This eliminates configuration drift between environments and transforms a multi-week manual process into a repeatable, on-demand action.

    Embedding Quality from the Start

    The goal of DevOps is to ship high-quality software rapidly, not just to ship software rapidly. This pillar focuses on shifting quality assurance from a final, manual inspection gate to a continuous, automated process that begins with the first line of code. This is known as "shifting left."

    This is achieved by integrating a suite of automated tests directly into the CI/CD pipeline:

    • Unit Tests: Fast, isolated tests (e.g., using JUnit, PyTest) that verify the correctness of individual functions or classes. They are the first line of defense, executed on every commit.
    • Integration Tests: Verify that different components or microservices interact correctly, ensuring that API contracts are honored and data flows as expected.
    • Static Code Analysis: Tools like SonarQube or linters are integrated into the pipeline to automatically scan source code for bugs, security vulnerabilities, and code complexity issues ("code smells"). This enforces coding standards and prevents common errors from being merged.

    Automating these checks provides developers with immediate feedback within minutes of a commit, allowing them to fix issues while the context is fresh, dramatically reducing the cost and effort of remediation.

    Engineering for Stability and Resilience

    Stability is the foundation of user trust. A high-velocity pipeline is a liability if it consistently deploys fragile, failure-prone software. This pillar is about architecting resilient systems and instrumenting them with deep, real-time visibility. This is the domain of observability.

    A robust observability strategy is built on three core data types:

    1. Metrics: Time-series numerical data that provides a high-level view of system health. Tools like Prometheus scrape endpoints to track key indicators like CPU utilization, memory consumption, and request latency.
    2. Logs: Immutable, timestamped records of discrete events. Implementing structured logging (e.g., outputting logs as JSON) is critical, as it allows for efficient parsing, querying, and analysis in platforms like Elasticsearch or Splunk.
    3. Traces: Capture the end-to-end journey of a single request as it propagates through a distributed system (e.g., multiple microservices). This is essential for debugging latency issues and identifying bottlenecks.

    This telemetry is aggregated into dashboards using tools like Grafana, providing engineering teams with a unified view for performance monitoring, anomaly detection, and rapid troubleshooting.

    Fostering Technical Collaboration

    While DevOps is a cultural shift, specific technical practices are required to facilitate that collaboration. The cornerstone is version control, specifically Git. Git provides the distributed model necessary for parallel development and the branching/merging strategies (like GitFlow or trunk-based development) that enable controlled, auditable code integration.

    Beyond source code, technical processes like blameless postmortems are critical. When an incident occurs, the objective is not to assign blame but to conduct a systematic root cause analysis across the technical stack and operational procedures. This creates a culture of psychological safety where engineers can openly discuss failures, which is the only way to implement meaningful preventative actions.

    Integrating Security into the Lifecycle

    Historically, security was a final, often manual, gate before a release, frequently causing significant delays. DevSecOps reframes this by "shifting security left," embedding automated security controls into every phase of the software lifecycle.

    Key DevSecOps practices integrated into the CI/CD pipeline include:

    • Static Application Security Testing (SAST): Scans source code for known vulnerability patterns (e.g., SQL injection, cross-site scripting).
    • Dynamic Application Security Testing (DAST): Analyzes the running application to identify security flaws from an external perspective.
    • Software Composition Analysis (SCA): Scans project dependencies (e.g., npm packages, Maven libraries) against databases of known vulnerabilities (CVEs).

    By automating these scans, security becomes a shared, continuous responsibility, ensuring applications are secure by design, not by a last-minute audit.

    Measuring Success with Actionable DevOps KPIs

    To truly understand the goal of DevOps, you must move from principles to empirical data. Goals without measurement are merely aspirations. Key Performance Indicators (KPIs) transform the five pillars of DevOps into a practical dashboard that demonstrates value, justifies investment, and guides continuous improvement.

    Without data, you're flying blind. You might feel like your processes are improving, but can you prove it? KPIs provide the objective evidence needed to demonstrate a return on investment (ROI) and make data-driven decisions.

    The real-world results are compelling. According to research highlighted on Instatus.com, elite DevOps performers recover from failures 24 times faster and have a 3 times lower change failure rate. They also spend 22% less time on unplanned work and rework, freeing up engineering cycles for innovation rather than firefighting.

    The Four DORA Metrics

    The DevOps Research and Assessment (DORA) team identified four key metrics that are powerful predictors of engineering team performance. Elite teams excel at these, and they have become the industry gold standard for measuring DevOps effectiveness.

    1. Deployment Frequency: How often an organization successfully releases to production. This is a direct proxy for batch size and team throughput.
    2. Lead Time for Changes: The median time it takes for a commit to get into production. This measures the efficiency of the entire development and delivery pipeline.
    3. Change Failure Rate: The percentage of deployments to production that result in a degraded service and require remediation (e.g., a rollback, hotfix). This is a critical measure of quality and stability.
    4. Mean Time to Recovery (MTTR): The median time it takes to restore service after a production failure. This is the ultimate measure of a system's resilience and the team's incident response capability.

    These four metrics create a balanced system. They ensure that velocity (Deployment Frequency, Lead Time) is not achieved at the expense of stability (Change Failure Rate, MTTR). Optimizing one pair while ignoring the other leads to predictable failure modes.

    How to Technically Measure These KPIs

    Tracking these KPIs is not a manual process; it's about instrumenting your toolchain to extract this data automatically.

    • Lead Time for Changes: This is calculated as timestamp(deployment) - timestamp(commit). Your version control system (like Git) provides the commit timestamp, and your CI/CD tool (like GitLab CI, GitHub Actions, or Jenkins) provides the successful deployment timestamp.
    • Deployment Frequency: This is a simple count of successful production deployments over a given time period. This data is extracted directly from the deployment logs of your CI/CD tool.
    • Change Failure Rate: This requires correlating deployment events with incidents. An API integration can link a deployment from your CI/CD tool to an incident ticket created in a system like Jira or a high-severity alert from PagerDuty. The formula is: (Number of deployments causing a failure / Total number of deployments) * 100.
    • Mean Time to Recovery (MTTR): This is calculated as timestamp(incident_resolved) - timestamp(incident_detected). This data is sourced from your incident management or observability platform.

    For a more comprehensive guide, see our article on engineering productivity measurement, which details how to build a complete measurement framework.

    Beyond DORA: Other Essential Metrics

    While the DORA four are your north star, a holistic view of operational health requires additional telemetry.

    A well-rounded DevOps dashboard doesn't just measure delivery speed; it also quantifies system reliability, user experience, and financial efficiency. This holistic view connects engineering efforts directly to business value.

    Here are other critical KPIs to monitor:

    • System Uptime/Availability: A fundamental measure of reliability, typically expressed as a percentage (e.g., 99.99% uptime), often tied to Service Level Objectives (SLOs).
    • Error Rates: The frequency of application-level errors (e.g., HTTP 500s) or unhandled exceptions, often tracked via Application Performance Monitoring (APM) tools.
    • Cloud Spend Optimization (FinOps): Tracking cloud resource costs against utilization to prevent waste and ensure financial efficiency. This metric links operational decisions directly to business profitability.

    This reference table outlines the technical implementation for tracking key metrics.

    | Key DevOps KPIs and Measurement Methods |
    | —————————————– | ——————————————————————————————————————– | ———————————————————————————————— |
    | KPI | What It Measures | How to Track It (Example Tools) |
    | Deployment Frequency | The rate of successful deployments to production, indicating development velocity. | CI/CD pipeline logs from tools like Jenkins, GitLab CI, or GitHub Actions. |
    | Lead Time for Changes | The time from code commit to successful production deployment, measuring pipeline efficiency. | Timestamps from Git (commit) and CI/CD tools (deployment). |
    | Change Failure Rate | The percentage of deployments that result in a production failure or service degradation. | Correlate deployment data (CI/CD tools) with incident data (Jira, PagerDuty). |
    | Mean Time to Recovery (MTTR) | The average time it takes to restore service after a production failure, reflecting system resilience. | Incident management platforms like PagerDuty or observability tools like Datadog. |
    | System Uptime/Availability | The percentage of time a system is operational and accessible to users. | Monitoring tools like Prometheus, Grafana, or cloud provider metrics (e.g., AWS CloudWatch). |
    | Error Rates | The frequency of errors (e.g., HTTP 500s) generated by the application. | Application Performance Monitoring (APM) tools like Sentry, New Relic, or Datadog. |
    | Cloud Spend | The cost of cloud infrastructure, ideally correlated with usage and business value. | Cloud provider billing dashboards (AWS Cost Explorer, Azure Cost Management) or FinOps platforms. |

    Tracking these metrics provides an objective, data-driven view of your DevOps implementation's performance and highlights areas for targeted improvement.

    Adoption Models and Common Implementation Pitfalls

    Knowing the goals of DevOps is necessary but insufficient for success. Transitioning from theory to practice requires a deliberate adoption strategy, and no single model fits all organizations. The optimal path depends on your company's scale, existing team structure, and technical maturity.

    Choosing an adoption model is a strategic decision aimed at achieving the core DevOps balance of velocity and stability. However, even the best strategy can be undermined by common implementation pitfalls that derail progress.

    Choosing Your Implementation Path

    Organizations typically follow one of three primary models when initiating a DevOps transformation. Each presents distinct advantages and challenges.

    • The Pilot Project Model: This involves selecting a single, non-critical but high-impact project to serve as a testbed for new tools, processes, and collaborative structures. This model contains risk and allows a small, dedicated team to iterate quickly, creating a proven blueprint for broader organizational adoption.
    • The Center of Excellence (CoE) Model: A central team of DevOps experts is established to research, standardize, and promote best practices and tooling across the organization. The CoE acts as an internal consultancy, ensuring consistency and preventing disparate teams from solving the same problems independently. This is particularly effective in large enterprises.
    • The Embedded Platform Model: This modern approach involves creating a platform engineering team that builds and maintains a paved road of self-service tools and infrastructure. Platform engineers may be embedded within product teams to help them leverage these shared services effectively, ensuring the platform evolves to meet real developer needs.

    As you consider your implementation, understanding the context of other methodologies is helpful. For a detailed comparison, see this guide on Agile vs. DevOps methodologies.

    Critical Pitfalls to Avoid on Your Journey

    Successful DevOps adoption is as much about avoiding common failure modes as it is about choosing the right model. Many initiatives fail due to a fundamental misunderstanding of the required changes.

    The most common reason DevOps initiatives fail is a narrow focus on tools while ignoring the necessary cultural and process transformation. A shiny new CI/CD pipeline is useless if development and operations teams still operate in adversarial silos.

    Here are four of the most destructive traps and how to architect your way around them:

    1. Focusing Only on Tools, Not Culture
      This is the "cargo cult" approach: buying a suite of automation tools and expecting behavior to change. True DevOps requires automating re-engineered, collaborative processes, not just paving over existing broken ones.

      Actionable Advice: Prioritize cultural change. Institute blameless postmortems, establish shared SLOs for Dev and Ops, and create unified dashboards so everyone is looking at the same data.

    2. Creating a New "DevOps Team" Silo
      Ironically, many organizations try to break down silos by creating a new one: a "DevOps Team" that becomes a bottleneck for all automation and infrastructure requests, sitting between Dev and Ops.

      Actionable Advice: Adopt a platform engineering mindset. The goal of a central team should be to build self-service capabilities that empower product teams to manage their own delivery pipelines and infrastructure, not to do the work for them.

    3. Neglecting Security Until the End (Bolting It On)
      If security reviews remain a final, manual gate before deployment, you are not practicing DevOps. "Bolting on" security at the end of the lifecycle creates friction, delays, and an adversarial relationship with the security team.

      Actionable Advice: Implement DevSecOps by integrating automated security tools (SAST, DAST, SCA) directly into the CI/CD pipeline. Make security a shared responsibility from the first commit.

    4. Failing to Secure Executive Sponsorship
      A genuine DevOps transformation requires investment in tools, training, and—most critically—time for teams to learn and adapt. Without strong, consistent support from leadership, initiatives will stall when they encounter organizational resistance or require budget.

      Actionable Advice: Frame the business case for DevOps in terms of the KPIs leadership cares about: reduced time-to-market, lower change failure rates, and improved system resilience and availability.

    Understanding your organization's current state is crucial. You can assess your progress by mapping your practices against standard DevOps maturity levels to identify the next logical steps in your evolution.

    The Future of DevOps Goals: Resilience and Governance

    The DevOps landscape is constantly evolving. While speed and stability remain foundational, the leading edge of DevOps has shifted its focus toward two more advanced goals: building inherently resilient systems and embedding automated governance.

    This represents a significant evolution in thinking. The original question was, "How fast can we deploy code?" The more mature, business-critical question is now: "How quickly can we detect and recover from failure with minimal user impact?" The focus is shifting from preventing failure (an impossibility in complex systems) to building antifragile systems that gracefully handle failure.

    An archway of interconnected gears visually linking 'Resilience' with a shield to 'Governance' with a feature flag and lightning bolt.

    From Reactive Fixes to Proactive Resilience

    Modern resilience engineering is not about having an on-call team that is good at firefighting. It's about proactively discovering system weaknesses before they manifest as production incidents. This is the domain of chaos engineering. This practice involves running controlled experiments to inject failures—such as terminating EC2 instances, injecting network latency, or maxing out CPU—to verify that the system responds as expected. The goal is to uncover hidden dependencies and single points of failure before they impact users.

    Another key component is progressive delivery. Instead of high-risk "big bang" deployments, teams use advanced deployment strategies to limit the blast radius of a potential failure.

    • Canary Releases: A new version is deployed to a small subset of production traffic. The system's key metrics (error rates, latency) are monitored closely. If they remain healthy, traffic is gradually shifted to the new version.
    • Feature Flags: This technique decouples code deployment from feature release. New code can be deployed to production in a "dark" or "off" state. This allows for instant rollbacks by simply flipping a switch in a configuration service, without requiring a full redeployment.

    These practices are central to Site Reliability Engineering (SRE), a discipline focused on building ultra-reliable, scalable systems. To delve deeper, it's essential to understand the core site reliability engineering principles that underpin this mindset.

    Weaving Governance into the Automation Fabric

    As DevOps matures within an organization, governance and compliance cannot remain manual, after-the-fact processes. The goal is to automate these controls directly within the CI/CD pipeline, making them an inherent part of the delivery process rather than a bottleneck.

    This emerging discipline shifts the focus from deployment velocity alone to the system's ability to absorb change safely. Mature organizations measure resilience with metrics that track the time to detect, isolate, and remediate failures. Governance is no longer a separate function but is encoded into the system with automated policy enforcement and auditable trails.

    Two technologies are central to this shift:

    Policy as Code (PaC): Using frameworks like Open Policy Agent (OPA), teams define security, compliance, and operational policies as code. This code is version-controlled, testable, and can be automatically enforced at various stages of the CI/CD pipeline. For example, a pipeline could automatically fail a Terraform plan if it attempts to create a publicly exposed S3 bucket.

    FinOps (Cloud Financial Operations): This practice integrates cost management directly into the DevOps lifecycle. By incorporating cost estimation tools into the CI/CD pipeline, teams can see the financial impact of their infrastructure changes before they are applied, preventing budget overruns.

    The future of DevOps is about building intelligent, self-healing, and self-governing systems. The goal is a software delivery apparatus that is not just fast, but secure, compliant, resilient, and cost-effective by design.

    How to Actually Hit Your DevOps Goals

    Understanding the technical goals of DevOps is the first step. Executing them successfully is the real challenge. This is where a specialist partner like OpsMoon can bridge the gap between strategy and implementation. The process begins not with tool selection, but with a rigorous, data-driven assessment of your current state.

    We start by benchmarking your current DevOps maturity against elite industry performers. This analysis identifies specific gaps in your culture, processes, and technology stack. The output is not a generic recommendation, but a detailed, actionable roadmap with prioritized initiatives designed to deliver the highest impact on your software delivery performance.

    Overcoming the Engineering Skill Gap

    One of the most significant impediments to achieving DevOps goals is the highly competitive market for specialized engineering talent. Finding engineers with deep, hands-on expertise in foundational DevOps technologies is a major bottleneck for many organizations. A managed framework provides an immediate solution.

    Instead of engaging in a lengthy and expensive talent search, you gain access to pre-vetted engineers from the top 0.7% of the global talent pool. These are not generalists; they are specialists who have designed, built, and scaled complex systems using the exact technologies you need.

    • Kubernetes Orchestration: Experts in designing and operating resilient, scalable containerized platforms.
    • Terraform Expertise: Masters of creating modular, reusable, and automated infrastructure using Infrastructure as Code (IaC).
    • CI/CD Pipeline Mastery: Architects of sophisticated, secure, and efficient build, test, and deployment workflows.
    • Advanced Observability: Specialists in implementing the monitoring, logging, and tracing stacks required for deep system visibility.

    Integrating this level of expertise instantly closes critical skill gaps, allowing your in-house team to focus on their core competency—building business-differentiating product features—rather than being mired in complex infrastructure management.

    A true strategic partner doesn’t just provide staff augmentation. They deliver a managed framework, complete with architectural oversight and continuous progress monitoring, making ambitious DevOps goals achievable for any organization.

    Flexible Models for Every Business Need

    DevOps is not a monolithic solution. A startup building its first CI/CD pipeline has vastly different requirements from a large enterprise migrating legacy workloads to a multi-cloud environment. A rigid, one-size-fits-all engagement model is therefore ineffective.

    Flexible engagement models are crucial. Whether you require strategic advisory consulting, end-to-end project delivery, or hourly capacity to augment your existing team, the right model ensures you receive the precise expertise you need, precisely when you need it. This makes world-class DevOps capabilities accessible, regardless of your organization's scale or maturity.

    With a clear roadmap, elite engineering talent, and a flexible structure, achieving your DevOps goals transforms from an abstract objective into a systematic, measurable process of value creation.

    DevOps Goals: Your Questions Answered

    When teams begin their DevOps journey, several practical, technical questions inevitably arise. Here are direct answers to the most common ones.

    What's the First Real Technical Step We Should Take?

    Start with universal version control using Git. Put everything under version control: application source code, infrastructure configurations (e.g., Terraform files), pipeline definitions (e.g., Jenkinsfile), and application configuration. This establishes a single source of truth for your entire system.

    This is the non-negotiable prerequisite for both Infrastructure as Code (IaC) and CI/CD. Once everything is in Git, the next logical step is to automate your build. Configure a CI server (like Jenkins or GitLab CI) to trigger on every commit, compile the code, and run unit tests. This initial automation creates immediate value and builds momentum for more advanced pipeline stages.

    How Is DevOps Actually Different from Agile Day-to-Day?

    They are complementary but address different scopes. Agile is a project management methodology focused on organizing the work of the development team. It uses iterative cycles (sprints) to manage complexity and adapt to changing product requirements. Its domain is primarily "plan, code, and build."

    DevOps extends the principles of iterative work and fast feedback to the entire software delivery lifecycle, from a developer's commit to production operations. It encompasses Agile development but also integrates QA, security, and operations through automation. DevOps is concerned with the "test, release, deploy, and operate" phases that follow the initial build.

    In technical terms: Agile optimizes the git commit loop for developers. DevOps optimizes the entire end-to-end process from git push to production monitoring and incident response.

    Can a Small Startup Really Build a Full CI/CD Pipeline?

    Absolutely. In fact, startups are often in the best position to do it right from the start without the burden of legacy systems or entrenched processes. Modern cloud-native CI/CD platforms have dramatically lowered the barrier to entry.

    A startup can achieve significant value with a minimal viable pipeline:

    1. Trigger: A developer pushes code to a specific branch in a Git repository.
    2. Build & Test: A cloud-based CI/CD service like GitHub Actions or GitLab CI is triggered. It spins up a containerized environment, builds the application artifact (e.g., a Docker image), and runs a suite of automated tests (unit, integration).
    3. Deploy: Upon successful test completion, the pipeline automatically pushes the Docker image to a container registry and triggers a deployment to a container orchestration platform like Kubernetes or AWS ECS.

    This entire workflow can be defined in a single YAML file and implemented in a matter of days, providing immediate ROI in the form of automated, repeatable, and low-risk deployments.


    Hitting your DevOps goals comes down to having the right strategy and the right people. At OpsMoon, we connect you with the top 0.7% of global engineering talent to build, automate, and scale your infrastructure the right way. Start with a free work planning session to map out your path to success. Learn more at https://opsmoon.com.

  • Mastering CI/CD with Kubernetes: A Technical Guide

    Mastering CI/CD with Kubernetes: A Technical Guide

    Integrating CI/CD with Kubernetes is a transformative step for software delivery. By automating the build, test, and deployment of containerized applications on an orchestrated platform, you establish a resilient, scalable, and reproducible process. This combination definitively solves legacy pipeline constraints and eliminates the "it works on my machine" anti-pattern.

    Why Kubernetes Is Essential for Modern CI/CD

    Legacy CI/CD systems often relied on a fleet of dedicated, static build servers. This architecture was a breeding ground for systemic issues: resource contention during concurrent builds, prolonged queue times, and environment drift between development, testing, and production. A single build server failure could halt all development velocity. Scaling this model was a manual, error-prone, and expensive task.

    Kubernetes fundamentally changes this paradigm. Instead of fixed infrastructure, you have a dynamic, API-driven platform for orchestrating containers. This allows your CI/CD system to provision clean, isolated, and fully configured build environments on-demand for every pipeline execution. We call these ephemeral build agents.

    The workflow is straightforward: a developer pushes code, triggering a pipeline that instantly schedules a Kubernetes Pod. This Pod contains all necessary build tools, compilers, and dependencies defined in its container spec. It executes the build and test stages in a pristine environment. Upon completion, the Pod is terminated, and its resources are reclaimed by the cluster, ready for the next job.

    Solving Legacy Pipeline Bottlenecks

    This on-demand model eradicates scalability bottlenecks. As development activity peaks, Kubernetes can automatically scale the number of build agent Pods via the Cluster Autoscaler to meet demand. During lulls, it scales them back down, optimizing resource utilization and cost. Achieving this level of elasticity with traditional CI/CD required significant bespoke engineering effort.

    Crucially, Kubernetes enforces environmental consistency. Build environments are defined declaratively as container images (e.g., Dockerfiles), guaranteeing that every pipeline executes in an identical context. This consistency extends from CI all the way to production. The exact same container image artifact that passes all tests is the one promoted through environments, achieving true build-to-runtime parity.

    The core strength of Kubernetes lies in its declarative model. You shift from writing imperative scripts that specify how to deploy an application to creating manifest files (e.g., YAML) that declare the desired state. Kubernetes' control loop continuously works to reconcile the cluster's current state with your desired state. This is the foundation of modern, reliable automation.

    The entire process, from a git push to a container-native deployment, becomes a seamless, automated flow orchestrated by Kubernetes.

    Visual representation of the Kubernetes CI/CD workflow, detailing steps from code push to container build and deployment.

    This workflow demonstrates how a single Git commit can trigger a chain of automated, container-native actions, all managed by the orchestrator.

    To understand how these components interact, let's dissect the core stages of a typical pipeline.

    Core Components of a Kubernetes CI/CD Pipeline

    Pipeline Stage Core Purpose Common Tools
    Source Code Management Triggering the pipeline on code changes (e.g., git push or merge). GitLab, GitHub, Bitbucket
    Continuous Integration (CI) Building, testing, and validating the application code automatically. Jenkins, GitLab CI, CircleCI
    Image Build & Scan Packaging the application into a container image and scanning for vulnerabilities. Docker, Kaniko, Trivy, Snyk
    Image Registry Storing and versioning the built container images. Docker Hub, ECR, GCR, Harbor
    Continuous Deployment (CD) Automatically deploying the new container image to Kubernetes clusters. Argo CD, Flux, Spinnaker

    Each stage represents a critical, automated step in moving source code from a developer's local environment to a running production service.

    The Rise of GitOps and Declarative Workflows

    The adoption of Kubernetes has been massive. A recent CNCF survey revealed that a staggering 96% of organizations are either using or evaluating Kubernetes, largely because of how well it integrates with CI/CD. If you want to dive deeper, you can discover more about these Kubernetes trends and their impact. This shift has also brought GitOps into the spotlight, an operational model where Git is the single source of truth for both your application and your infrastructure.

    A typical GitOps workflow functions as follows:

    • A developer pushes new application code to a source repository.
    • The CI pipeline triggers, automatically building, testing, and pushing a new, uniquely tagged container image to a registry.
    • The pipeline's final step is to update a Kubernetes manifest (e.g., a Deployment YAML) in a separate configuration repository with the new image tag.
    • A GitOps agent running inside the Kubernetes cluster (like Argo CD or Flux) detects the commit in the configuration repository and automatically pulls and applies the change, reconciling the cluster state.

    This "pull-based" deployment model enhances security and auditability, creating a fully declarative and auditable trail from a line of code to a running production service.

    Architecting Your Kubernetes CI/CD Pipeline

    A diagram showing a developer laptop connecting to a scalable Kubernetes build process, leading to ephemeral builds.

    Before writing any pipeline code, a critical architectural decision must be made: how will application artifacts be deployed to your Kubernetes cluster? This choice determines your entire workflow and security posture.

    You are choosing between two fundamental models: the traditional push-based model and the modern, declarative pull-based GitOps approach. Selecting the right one will define how you manage deployments, handle credentials, and scale your operations.

    The push-based model is common in legacy systems. A central CI server, such as Jenkins or GitLab CI, is granted direct credentials to the Kubernetes API server. After a successful build, the CI server executes commands like kubectl apply or helm upgrade to push the new version into the cluster.

    This model is simple to conceptualize but presents significant security and operational risks. Granting a CI server administrative privileges on a Kubernetes cluster creates a large attack surface. A compromise of the CI system could lead to a full compromise of the production environment.

    The GitOps Pull-Based Model

    GitOps inverts this model entirely.

    Instead of an external CI server pushing changes, an agent running inside the cluster—such as ArgoCD or Flux—continuously pulls the desired state from a designated Git repository. This Git repository becomes the single source of truth for all declarative configuration running in the cluster. The CI pipeline's sole deployment-related responsibility is to update a manifest in this repository.

    This pull architecture offers several advantages:

    • Enhanced Security: The in-cluster agent requires only read-access to the Git repository and the necessary RBAC permissions to manage resources within its target namespaces. The CI server never needs cluster credentials.
    • Complete Auditability: Every change to the infrastructure is a Git commit, providing an immutable, auditable log of who changed what, when, and why.
    • Simplified Rollbacks: A faulty deployment can be reverted by executing a git revert command on the problematic commit. The GitOps agent will detect the change and automatically synchronize the cluster back to the previous known-good state.
    • Drift Detection and Reconciliation: The agent constantly compares the live state of the cluster with the state defined in Git. If it detects any manual, out-of-band changes (configuration drift), it can automatically correct them or alert an operator.

    GitOps transitions your operational mindset from imperative commands to declarative state management. You stop telling the system what to do (kubectl run...) and start describing what you want (kind: Deployment...). This is the key to building a scalable, self-healing, and fully auditable delivery platform.

    Choosing Your Architectural Path

    The choice between push and pull models depends on your team's maturity, security requirements, and operational goals.

    • Push-Based (e.g., Jenkins): A viable starting point, especially for teams with existing investments in imperative CI tools. It is faster to implement initially but requires rigorous management of secrets and RBAC permissions to mitigate security risks.
    • Pull-Based (e.g., ArgoCD): The recommended and more secure approach for teams prioritizing security, auditability, and a scalable, declarative workflow. It requires more upfront design of Git repository structures but yields significant long-term operational benefits.

    A Practical Push-Based Example

    This Jenkinsfile snippet demonstrates a typical container build-and-push stage using Kaniko. Note how the CI server is actively executing commands and pushing the final artifact, a hallmark of the push model.

    pipeline {
        agent {
            kubernetes {
                yaml '''
    apiVersion: v1
    kind: Pod
    spec:
      containers:
      - name: kaniko
        image: gcr.io/kaniko-project/executor:debug
        imagePullPolicy: Always
        command:
        - /busybox/cat
        tty: true
        volumeMounts:
        - name: jenkins-docker-cfg
          mountPath: /kaniko/.docker
      volumes:
      - name: jenkins-docker-cfg
        projected:
          sources:
          - secret:
              name: regcred
              items:
                - key: .dockerconfigjson
                  path: config.json
    '''
            }
        }
        stages {
            stage('Build and Push') {
                steps {
                    container('kaniko') {
                        sh '''
                        /kaniko/executor --context `pwd` --destination=your-registry/your-app:$GIT_COMMIT --cache=true
                        '''
                    }
                }
            }
        }
    }
    

    A Declarative GitOps Example

    In contrast, this ArgoCD ApplicationSet manifest is purely declarative. It instructs ArgoCD to automatically discover and deploy any new service defined as a subdirectory within a specific Git repository path. The CI pipeline's only task is to add a new folder with Kubernetes manifests to the apps/ directory. ArgoCD manages the entire reconciliation loop.

    apiVersion: argoproj.io/v1alpha1
    kind: ApplicationSet
    metadata:
      name: my-app-generator
    spec:
      generators:
      - git:
          repoURL: https://github.com/your-org/config-repo.git
          revision: HEAD
          directories:
          - path: apps/*
      template:
        metadata:
          name: '{{path.basename}}'
        spec:
          project: default
          source:
            repoURL: https://github.com/your-org/config-repo.git
            targetRevision: HEAD
            path: '{{path}}'
          destination:
            server: https://kubernetes.default.svc
            namespace: '{{path.basename}}'
          syncPolicy:
            automated:
              prune: true
              selfHeal: true
    

    This separation of concerns—CI for building artifacts, GitOps for deploying state—is the foundation of a modern, secure, and scalable Kubernetes CI/CD architecture.

    Building a Container-Native CI Workflow

    A robust cicd with kubernetes pipeline begins with a Continuous Integration (CI) workflow designed to execute within the cluster itself. This represents a significant departure from static build servers, leveraging container-native runners that provision clean, isolated environments for each commit.

    The principle is simple yet powerful: upon a code push, the CI system dynamically schedules a Kubernetes Pod purpose-built for that job. This Pod acts as a self-contained build environment, containing specific versions of compilers, libraries, and testing frameworks. After the job completes, the Pod is terminated. This ensures every build runs in a fresh, predictable, and reproducible environment.

    From Code to Container Image

    The primary function of the CI stage is to transform source code into a secure, versioned, and deployable container image. This involves a series of automated steps designed to validate code quality and produce a reliable artifact.

    A typical container-native CI workflow includes these phases:

    • Checkout Code: The pipeline fetches the specific Git commit that triggered the execution.
    • Run Unit Tests: The application's core logic is validated via a comprehensive test suite running within a container. This is the first validation gate.
    • Build & Tag Image: A container image is built from a Dockerfile. The best practice is to tag the image with the unique Git commit SHA, creating an immutable and traceable link between the source code and the resulting artifact.
    • Push to Registry: The newly built image is pushed to a container registry such as Amazon ECR, Docker Hub, or Google Container Registry, making it available for subsequent deployment stages.

    While automation is key, it should be complemented by rigorous human processes. To ensure high code quality, follow established best practices for code review. Peer review can identify logical errors, architectural issues, and design flaws that automated tests may miss.

    An Example GitHub Actions Workflow

    This is a complete GitHub Actions workflow that builds a Go application, runs unit tests, and pushes the final container image to Amazon ECR using OIDC for secure, short-lived credentials.

    name: CI for Go Application
    
    on:
      push:
        branches: [ "main" ]
    
    jobs:
      build-and-push:
        runs-on: ubuntu-latest
        permissions:
          id-token: write
          contents: read
        steps:
          - name: Checkout repository
            uses: actions/checkout@v3
    
          - name: Configure AWS Credentials
            uses: aws-actions/configure-aws-credentials@v2
            with:
              role-to-assume: arn:aws:iam::123456789012:role/GitHubActionRole
              aws-region: us-east-1
    
          - name: Login to Amazon ECR
            id: login-ecr
            uses: aws-actions/amazon-ecr-login@v1
    
          - name: Set up Go
            uses: actions/setup-go@v4
            with:
              go-version: '1.21'
    
          - name: Run Unit Tests
            run: go test -v ./...
    
          - name: Build and push Docker image
            env:
              ECR_REGISTRY: ${{ steps.login-ecr.outputs.registry }}
              ECR_REPOSITORY: my-go-app
              IMAGE_TAG: ${{ github.sha }}
            run: |
              docker build -t $ECR_REGISTRY/$ECR_REPOSITORY:$IMAGE_TAG .
              docker push $ECR_REGISTRY/$ECR_REPOSITORY:$IMAGE_TAG
    

    This workflow automates the entire process, from secure AWS authentication to tagging the image with the precise commit SHA that generated it.

    Optimizing Your CI Pipeline

    Pipeline execution speed is critical for developer productivity. Two of the most effective optimization techniques are build caching and multi-stage builds.

    Build caching dramatically accelerates pipeline execution by reusing unchanged layers from previous builds. Instead of rebuilding the entire image from scratch, the build tool only processes layers affected by code changes, often reducing build times by over 50%.

    Similarly, multi-stage builds are essential for creating lean, secure production images. This technique involves using a builder stage with a full build-time environment to compile the application, followed by a final, minimal stage that copies only the compiled binary and necessary runtime dependencies.

    For a detailed walkthrough, see our guide on implementing an effective Docker multi-stage build. This approach removes compilers, SDKs, and build tools from the final image, significantly reducing its size and attack surface.

    Getting Continuous Deployment Right With GitOps

    Diagram showing a container-native CI workflow on Kubernetes: clone, unit test, build image, and push to registry.

    With a reliable CI pipeline producing versioned container images, the next objective is to automate their deployment to your Kubernetes cluster. This is where GitOps provides a robust and declarative framework.

    GitOps establishes your Git repository as the single source of truth for the desired state of your applications in the cluster. This eliminates manual kubectl apply commands and the security risk of granting CI servers direct cluster access.

    At its core, GitOps employs a "pull-based" model. An agent, such as ArgoCD or Flux, runs inside your cluster and continuously monitors a designated Git repository containing your Kubernetes manifests. When it detects a change—such as a new image tag committed by your CI pipeline—it pulls the configuration and reconciles the cluster's state to match. This is the foundation of a secure and auditable cicd with kubernetes system.

    Getting Started with ArgoCD for Continuous Sync

    ArgoCD is a popular, feature-rich GitOps tool. After installation in your cluster, you configure it to track a Git repository containing your Kubernetes manifests. Best practice dictates using a separate repository for this configuration, distinct from your application source code.

    To link a repository to a deployment, you define an Application custom resource. This manifest provides ArgoCD with three key pieces of information:

    • Source: The Git repository URL, target branch/tag, and path to the manifests.
    • Destination: The target Kubernetes cluster and namespace where the application should be deployed.
    • Sync Policy: Defines how ArgoCD applies changes. An automated policy with selfHeal: true is highly recommended. This configures ArgoCD to automatically apply new commits and correct any manual configuration drift detected in the cluster.

    With this configuration, your entire deployment workflow is driven by Git commits. To release a new version, your CI pipeline's final step is to commit a change to an image tag in a deployment manifest. ArgoCD handles the rest.

    How to Structure Your Git Repo for Multiple Environments

    A common and effective pattern for managing multiple environments (e.g., dev, staging, production) is to use Kustomize overlays. This approach promotes DRY (Don't Repeat Yourself) configurations by defining a common base set of manifests and applying environment-specific overlays to patch them.

    A typical repository structure would be:

    ├── base/
    │   ├── deployment.yaml
    │   ├── service.yaml
    │   └── kustomization.yaml
    ├── overlays/
        ├── dev/
        │   ├── patch-replicas.yaml
        │   └── kustomization.yaml
        └── production/
            ├── patch-replicas.yaml
            ├── patch-resources.yaml
            └── kustomization.yaml
    

    The base directory contains standard, environment-agnostic manifests. The overlays directories contain patches that modify the base. For example, overlays/dev/patch-replicas.yaml might scale the deployment to 1 replica, while the production patch scales it to 5 and applies stricter CPU and memory resource limits.

    For a deeper dive into repository structure, refer to our guide on GitOps best practices.

    When choosing a tool to manage your manifests, several excellent options are available.

    Deployment Manifest Management Tools Compared

    Tool Best For Key Strengths Considerations
    Helm Teams that need a full-featured package manager for distributing and managing complex, third-party applications. Templating, versioning, dependency management, and a vast ecosystem of public charts. Can introduce a layer of abstraction that makes manifests harder to debug. Templating logic can get complex.
    Kustomize Teams looking for a declarative, template-free way to customize manifests for different environments. Simple, patch-based approach. Native to kubectl. Great for keeping configs DRY without complex logic. Less suited for packaging and distributing software. Doesn't handle complex application dependencies.
    Plain YAML Simple applications or teams just starting out who want maximum clarity and control. Easy to read and write. No extra tools or learning curve. What you see is exactly what gets applied. Becomes very difficult to manage at scale. Prone to copy-paste errors and configuration drift between environments.

    Regardless of your choice, standardizing on a single manifest management strategy within your GitOps repository is crucial for maintaining consistency and clarity.

    Keeping Secrets Out of Git—The Right Way

    Committing plaintext secrets (API keys, database passwords) to a Git repository is a critical security vulnerability and must be avoided. Several tools integrate seamlessly with the GitOps model to manage secrets securely.

    Two highly effective approaches are:

    • Sealed Secrets: This solution from Bitnami uses a controller in your cluster with a public/private key pair. You use a CLI tool (kubeseal) to encrypt a standard Kubernetes Secret manifest using the controller's public key. This generates a SealedSecret custom resource, which is safe to commit to Git. Only the controller, with its private key, can decrypt the data and create the actual Secret inside the cluster.

    • HashiCorp Vault Integration: For more advanced secrets management, integrating with a system like HashiCorp Vault is the recommended path. Kubernetes operators like the Vault Secrets Operator or External Secrets Operator allow your pods to securely fetch secrets directly from Vault at runtime. Your Git repository stores only references to the secret paths in Vault, never the secrets themselves.

    By integrating a dedicated secrets management solution, you address one of the most common security gaps in CI/CD. Your Git repository can declaratively define the entire application state—including its dependency on specific secrets—without ever exposing a single credential. This is an essential practice for a production-grade GitOps workflow.

    Integrating Security and Observability

    Deployment velocity is a liability without robust security and observability. A CI/CD pipeline that rapidly ships vulnerable or unmonitored code is an operational risk. Security and observability must be integrated into your cicd with kubernetes workflow from the outset, not added as an afterthought.

    This practice is often termed DevSecOps, a cultural shift where security is a shared responsibility throughout the entire software development lifecycle. The objective is to "shift left," identifying and remediating vulnerabilities early in the development process rather than during a late-stage audit.

    The market reflects this priority. The DevSecOps sector is projected to grow from $3.73 billion in 2021 to $41.66 billion by 2030. However, challenges remain. A recent survey highlighted that 72% of organizations view security as a significant hurdle in cloud-native CI/CD adoption, with 51% citing similar concerns for observability.

    Shifting Security Left in Your CI Pipeline

    The CI pipeline is the ideal place to begin integrating security. Before a container image is pushed to a registry, it must be scanned for known vulnerabilities. This step acts as a critical quality gate, preventing insecure code from reaching your artifact repository or production clusters.

    An excellent open-source tool for this is Trivy. You can easily integrate a Trivy scan into any CI workflow. The key is to configure the pipeline to fail if vulnerabilities exceeding a defined severity threshold (e.g., CRITICAL or HIGH) are detected.

    Here is an example of a Trivy scan step in a GitHub Actions workflow:

    - name: Scan image for vulnerabilities
      uses: aquasecurity/trivy-action@master
      with:
        image-ref: 'your-registry/your-app:${{ github.sha }}'
        format: 'table'
        exit-code: '1'
        ignore-unfixed: true
        vuln-type: 'os,library'
        severity: 'CRITICAL,HIGH'
    

    This configuration instructs the pipeline to scan the image and fail the build if any high or critical vulnerabilities are discovered, effectively blocking the insecure artifact.

    Pro Tip: Do not stop at image scanning. Integrate static analysis security testing (SAST) tools like SonarQube to identify security flaws in your source code. Additionally, use infrastructure-as-code (IaC) scanners like checkov to validate your Kubernetes manifests for security misconfigurations before they are committed.

    Enforcing Security at the Kubernetes Level

    Security must extend beyond the CI pipeline into your Kubernetes manifests. These resources define the runtime security posture of your application, limiting the potential blast radius in the event of a compromise.

    Before implementing controls, it is wise to start by performing a thorough cybersecurity risk assessment to identify vulnerabilities in your existing architecture. With that data, you can enforce security using key Kubernetes resources.

    • Security Context: This manifest section defines privilege and access controls for a Pod or Container. At minimum, you must configure runAsUser to a non-zero value and set allowPrivilegeEscalation to false.
    • Network Policies: By default, all Pods in a Kubernetes cluster can communicate with each other. Network Policies act as a firewall for Pods, allowing you to define explicit ingress and egress traffic rules based on labels.
    • Role-Based Access Control (RBAC): Ensure the ServiceAccount used by your application Pod is granted the absolute minimum permissions required for its function (the principle of least privilege). A deep dive into these practices is available in our article on DevOps security best practices.

    Building Observability into Your Deployments

    You cannot secure or operate what you cannot see. Observability—metrics, logs, and traces—provides insight into the real-time health and performance of your system. In the Kubernetes ecosystem, Prometheus is the de facto standard for metrics collection.

    The first step is to instrument your application code. Most modern languages provide Prometheus client libraries to expose custom application metrics (e.g., active users, transaction latency) via a standard HTTP endpoint, typically /metrics.

    Once your application exposes metrics, you must configure Prometheus to scrape them. The Kubernetes-native method for this is the Prometheus Operator, which introduces the ServiceMonitor custom resource. This allows you to define scrape configurations declaratively.

    By applying a ServiceMonitor that targets your application's Service via a label selector, you instruct the Prometheus Operator to automatically generate and manage the necessary scrape configurations. This is a powerful pattern. Developers can enable monitoring for a new service simply by including a ServiceMonitor manifest in their GitOps repository, making observability a standard, automated component of every deployment.

    Putting Advanced Deployment Strategies into Play

    Establishing a CI pipeline and a GitOps workflow is a major achievement. The next step is to evolve from basic, all-or-nothing deployments to more sophisticated release strategies that minimize risk and downtime.

    This enables zero-downtime releases and prevents a faulty deployment from impacting the user experience. For this, we need specialized tools built for Kubernetes, like Argo Rollouts.

    Argo Rollouts is a Kubernetes controller that replaces the standard Deployment object with a more powerful Rollout custom resource. This single change unlocks advanced deployment strategies like Canary and Blue/Green releases directly within Kubernetes, providing fine-grained control over the release process.

    Rolling Out a Canary Deployment with Argo

    A Canary release is a technique for incrementally rolling out a new version. Instead of directing all traffic to the new version simultaneously, you start by routing a small percentage of production traffic—for example, 5%—to the new application pods.

    You then observe key performance indicators (KPIs) like error rates and latency. If the new version is stable, you gradually increase the traffic percentage until 100% of users are on the new version.

    The combination of Argo Rollouts with a service mesh like Istio or Linkerd provides precise traffic shaping capabilities. The Rollout resource configures the service mesh to split traffic accurately, while its analysis features can automatically query a monitoring system like Prometheus to validate the health of the new release.

    Here is an example of a Rollout manifest for a Canary strategy:

    apiVersion: argoproj.io/v1alpha1
    kind: Rollout
    metadata:
      name: my-app-rollout
    spec:
      replicas: 5
      strategy:
        canary:
          steps:
          - setWeight: 10
          - pause: { duration: 5m }
          - setWeight: 25
          - pause: { duration: 10m }
          - analysis:
              templates:
              - templateName: check-error-rate
              args:
              - name: service-name
                value: my-app-service
          - setWeight: 50
          - pause: { duration: 10m }
      selector:
        matchLabels:
          app: my-app
      template:
        metadata:
          labels:
            app: my-app
        spec:
          containers:
          - name: my-app
            image: your-registry/my-app:new-version
            ports:
            - containerPort: 8080
    

    This Rollout object executes the release in controlled stages with built-in pauses. The critical step is the automated analysis that runs after reaching 25% traffic.

    Let the Metrics Drive Your Promotions

    The analysis step transforms a Canary release from a manual, high-stress process into an automated, data-driven workflow. It allows the Rollout controller to query a monitoring system and make an objective decision about whether to proceed or abort the release.

    The analysis logic is defined in an AnalysisTemplate. For instance, you can configure it to monitor the HTTP 5xx error rate of the new canary version.

    apiVersion: argoproj.io/v1alpha1
    kind: AnalysisTemplate
    metadata:
      name: check-error-rate
    spec:
      args:
      - name: service-name
      metrics:
      - name: error-rate
        interval: 1m
        count: 3
        successCondition: result[0] <= 0.01
        failureLimit: 1
        provider:
          prometheus:
            address: http://prometheus.example.com:9090
            query: |
              sum(rate(http_requests_total{job="{{args.service-name}}",code=~"5.*"}[1m]))
              /
              sum(rate(http_requests_total{job="{{args.service-name}}"}[1m]))
    

    This template queries Prometheus for the 5xx error rate. If the rate remains at or below 1% for three consecutive minutes, the analysis succeeds, and the rollout continues. If the threshold is breached, the analysis fails.

    The primary benefit here is the automated safety net. If a Canary deployment fails its analysis, Argo Rollouts automatically triggers a rollback to the previous stable version. This occurs instantly, without human intervention, ensuring a faulty release has minimal impact on users.

    This automated validation and rollback capability is what enables rapid, confident releases in a cicd with kubernetes environment. You are no longer reliant on manual observation. The system becomes self-healing, promoting releases only when data verifies their stability. This frees up engineers to focus on feature development, confident that the deployment process is safe and reliable.

    Got Questions? We've Got Answers

    Diagram showing advanced deployment strategies: Blue/Green with Canary Splitting, Traffic Splitting, and performance feedback.

    As you implement a cicd with kubernetes system, several common technical challenges arise. Let's address some of the most frequent questions from engineering teams.

    How Do You Handle Database Schema Migrations?

    A mismatch between your application version and database schema can cause a critical outage. The most robust pattern is to execute schema migrations as a Kubernetes Job, triggered by a pre-install or pre-upgrade Helm hook.

    This approach ensures the migration completes successfully before the new application version begins to receive traffic. If the database migration Job fails, the entire deployment is halted, preventing the application from starting with an incompatible schema. This synchronous check maintains consistency and service availability.

    What's the Real Difference Between ArgoCD and Flux?

    Both are leading GitOps tools, but they differ in their architecture and user experience.

    • Argo CD is an integrated, opinionated platform. It provides a comprehensive UI, robust multi-cluster management from a single control plane, and an intuitive Application CRD that simplifies onboarding for teams.
    • Flux is a composable, modular toolkit. It consists of a set of specialized controllers (e.g., source-controller, helm-controller, kustomize-controller) that you assemble to create a custom workflow. This offers high flexibility but may require more initial configuration.

    The choice depends on whether you prefer an all-in-one solution or a highly modular, build-your-own toolkit.

    Ultimately, both tools adhere to the core GitOps principle: Git is the single source of truth. An in-cluster operator continuously reconciles the live state with the desired state defined in your repository.

    Can I Pair Jenkins for CI with ArgoCD for CD?

    Absolutely. This is a very common and highly effective architecture that leverages the strengths of each tool, creating a clear separation of concerns.

    The workflow is as follows:

    1. Jenkins (CI): Acts as the build engine. It checks out source code, runs unit tests and security scans, and builds a new container image upon success.
    2. The Handoff: Jenkins pushes the new image to a container registry. Its final step is to commit a change to a manifest file in your GitOps configuration repository, updating the image tag to the new version.
    3. ArgoCD (CD): Continuously monitors the GitOps repository. Upon detecting the new commit from Jenkins, it automatically initiates the deployment process, syncing the new version into the Kubernetes cluster.

    This workflow cleanly separates the "build" (CI) and "deploy" (CD) processes, resulting in a powerful and auditable automated pipeline.


    Ready to build a robust CI/CD pipeline without getting lost in the complexity? The experts at OpsMoon specialize in designing and implementing Kubernetes-native automation that accelerates your releases. Start with a free work planning session to map out your DevOps roadmap.

  • 10 CI/CD Pipeline Best Practices for Flawless Deployments in 2026

    10 CI/CD Pipeline Best Practices for Flawless Deployments in 2026

    In today's competitive landscape, the speed and reliability of software delivery are no longer just technical goals; they are core business imperatives. A highly optimized CI/CD pipeline is the engine that drives this delivery, transforming raw code into customer value with velocity and precision. However, building a pipeline that is fast, secure, and resilient is a complex challenge. It requires moving beyond basic automation to adopt a holistic set of practices that govern everything from testing and infrastructure to security and feedback loops.

    This article dives deep into the 10 most critical CI/CD pipeline best practices that elite engineering teams use to gain a competitive edge. We will move past surface-level advice to provide technical, actionable guidance, complete with configuration examples, tool recommendations, and real-world scenarios to help you build a deployment machine that truly performs. Whether you are a startup CTO defining your initial DevOps strategy or an enterprise SRE looking to refine a complex, multi-stage delivery system, these principles will provide a clear roadmap.

    While optimizing the technical aspects of CI/CD is critical for efficient delivery, ensuring that the right products are built in the first place relies on solid product management. For a comprehensive look at the strategic side of development, you can explore actionable product management best practices for 2025. This guide focuses on the engineering execution, covering essential topics from Infrastructure as Code (IaC) and container orchestration to integrated security scanning and comprehensive observability. You will learn not just what to do, but how and why, empowering your team to ship better software, faster.

    1. Automated Testing at Every Stage

    Automated testing is the cornerstone of modern CI/CD pipeline best practices, serving as a critical quality gate that prevents defects from reaching production. This approach involves embedding a comprehensive suite of tests directly into the pipeline, which are automatically triggered by events like code commits or pull requests. By systematically validating code at each stage, from unit tests on individual components to full-scale end-to-end tests on a staging environment, teams can catch bugs early, reduce manual effort, and significantly accelerate the feedback loop for developers.

    Diagram showing a continuous integration and testing pipeline: code commits, unit, integration, end-to-end, and fast feedback.

    This practice is essential because it builds confidence in every deployment. For example, Google’s internal tooling runs millions of automated tests daily, ensuring that any single change doesn't break the vast ecosystem of interdependent services. This allows them to maintain development velocity without compromising stability.

    Practical Implementation Steps

    To effectively integrate this practice, follow a layered approach:

    • Start with Unit Tests: Begin by creating unit tests that cover critical business logic and complex functions. Use frameworks like Jest for JavaScript, JUnit for Java, or PyTest for Python. Aim for a code coverage target of 70-80%; while 100% is often impractical, this range ensures most critical paths are validated.
    • Expand to Integration and E2E Tests: Once a solid unit test foundation exists, add integration tests to verify interactions between services and end-to-end (E2E) tests to simulate user journeys. Tools like Cypress or Selenium are excellent for E2E testing.
    • Optimize for Speed: Keep pipeline execution times under 15 minutes to maintain a fast feedback loop. Achieve this by running tests in parallel across multiple agents or containers.
    • Integrate and Visualize: Configure your CI server (e.g., Jenkins, GitLab CI) to display test results directly in pull requests. This provides immediate visibility and helps developers pinpoint failures quickly.

    Staying current is also crucial; for instance, understanding the latest advances in regression testing APIs for CI/CD integration can help you further automate and strengthen the validation of your application's core functionalities after changes.

    2. Infrastructure as Code (IaC)

    Infrastructure as Code (IaC) is a pivotal practice for modern CI/CD pipelines, treating infrastructure management with the same rigor as application development. It involves defining and provisioning infrastructure through machine-readable definition files (e.g., Terraform, AWS CloudFormation) rather than manual configuration. This code-based approach ensures environments are consistent, reproducible, and easily versioned, making infrastructure changes transparent and auditable. By integrating IaC into the pipeline, infrastructure updates follow the same automated testing and deployment flow as application code.

    Diagram illustrating version-controlled code securely deploying and managing server and database infrastructure.

    This methodology is fundamental for achieving scalable and reliable operations. For instance, Airbnb leverages Terraform to manage its complex AWS infrastructure, allowing engineering teams to rapidly provision and modify resources in a standardized, automated fashion. This prevents configuration drift and empowers developers to manage their service dependencies safely, a critical advantage for dynamic, large-scale systems.

    Practical Implementation Steps

    To successfully adopt IaC as one of your core CI/CD pipeline best practices, focus on building a robust, automated workflow:

    • Choose the Right Tool: Start with a tool that fits your ecosystem. Use Terraform for multi-cloud flexibility or Pulumi for using general-purpose programming languages. If you're deeply integrated with AWS, CloudFormation is a powerful native choice.
    • Establish Version Control and State Management: Store your IaC files in a Git repository alongside your application code. Implement remote state locking using a backend like an S3 bucket with DynamoDB to prevent concurrent modifications and ensure a single source of truth for your infrastructure's state.
    • Create Reusable Modules: Structure your code into reusable modules (e.g., a standard VPC setup or a database cluster configuration). This promotes consistency, reduces code duplication, and simplifies infrastructure management across multiple projects or environments.
    • Integrate IaC into Your Pipeline: Add dedicated stages in your CI/CD pipeline to validate (terraform validate), plan (terraform plan), and apply (terraform apply) infrastructure changes. Enforce mandatory code reviews for all pull requests modifying infrastructure code.

    It is also crucial to incorporate security and compliance checks directly into your workflow; for more detail, you can explore best practices for how to check your IaC for potential vulnerabilities before deployment.

    3. Continuous Integration with Automated Builds

    Continuous Integration (CI) is a foundational practice where developers frequently merge their code changes into a central repository, after which automated builds and tests are run. This process acts as the first line of defense in modern CI/CD pipeline best practices, ensuring that new code integrates seamlessly with the existing codebase. By automating the build and initial validation steps for every single commit, teams can detect integration errors almost immediately, preventing them from escalating into more complex problems later in the development cycle.

    This practice is essential for maintaining a high-velocity, high-quality development process. For instance, LinkedIn’s engineering teams rely heavily on CI to manage thousands of daily commits across their complex microservices architecture. Each commit triggers a dedicated CI pipeline that builds the service, runs a battery of tests, and provides immediate feedback, allowing developers to address issues while the context is still fresh in their minds.

    Practical Implementation Steps

    To implement this practice effectively, focus on speed, consistency, and clear communication:

    • Establish a Fast Feedback Loop: Target a CI build duration of under 10 minutes. If builds take longer, developers may start batching commits or lose focus, defeating the purpose of rapid feedback. Run quick, lightweight checks like linting and unit tests first to fail fast.
    • Ensure Consistent Build Environments: Use containers (e.g., Docker) to define and manage your build environment. This guarantees that code is built in a consistent, reproducible environment, eliminating "it works on my machine" issues and ensuring builds behave identically in CI and local development.
    • Optimize Build Speed with Caching and Parallelization: Implement artifact caching for dependencies to avoid re-downloading them on every run. Furthermore, parallelize independent build stages (like running different test suites simultaneously) to significantly reduce the total pipeline execution time.
    • Implement Immediate Failure Notifications: Configure your CI server (like GitHub Actions or Jenkins) to instantly notify the relevant team or developer of a build failure via Slack, email, or other communication channels. This enables swift troubleshooting and prevents a broken build from blocking other developers.

    4. Containerization and Container Orchestration

    Containerization and its orchestration are foundational to modern CI/CD pipeline best practices, creating a consistent, portable, and scalable environment for applications. This approach involves packaging an application and its dependencies into a standardized unit, a container, using tools like Docker. These containers run identically anywhere, from a developer's laptop to production servers, eliminating the "it works on my machine" problem. Orchestration platforms like Kubernetes then automate the deployment, scaling, and management of these containers.

    A diagram showing Kubernetes managing rolling updates of containerized applications from a container registry for zero-downtime deployments.

    This practice is essential because it decouples the application from the underlying infrastructure, enabling unprecedented speed and reliability. For instance, Netflix leverages its own container orchestrator, Titus, to manage its massive streaming infrastructure, while Airbnb runs thousands of microservices on Kubernetes. This ensures their services are resilient, scalable, and can be updated with zero downtime, a key requirement for high-availability systems.

    Practical Implementation Steps

    To effectively integrate containerization into your CI/CD pipeline, focus on automation and security:

    • Build Minimal, Secure Images: Start with official, lean base images (e.g., alpine or distroless) to reduce the attack surface and deployment time. Integrate container image scanning tools like Trivy or Snyk directly into your CI pipeline to detect vulnerabilities before they reach a registry.
    • Tag Images for Traceability: Automate image tagging using the Git commit SHA. For example, my-app:1.2.0-a1b2c3d immediately links a running container back to the exact code version that built it, simplifying debugging and rollbacks.
    • Automate Kubernetes Manifests: Use tools like Helm or Kustomize to manage and template your Kubernetes deployment configurations. This allows you to define application deployments as code, making them repeatable and version-controlled across different environments (dev, staging, prod).
    • Enforce Resource Management: Always define CPU and memory requests and limits for every container in your Kubernetes manifests. This prevents resource contention, ensures predictable performance, and improves cluster stability by allowing the scheduler to make informed decisions.

    5. Deployment Automation and GitOps

    Deployment automation eliminates error-prone manual steps, ensuring consistent and repeatable releases through scripted workflows. GitOps evolves this concept by establishing a Git repository as the single source of truth for both infrastructure and application configurations. In this model, changes to the production environment are made exclusively through Git commits, with automated agents continuously reconciling the live state to match the declarations in the repository. This approach is a cornerstone of modern CI/CD pipeline best practices, providing a clear audit trail, simplified rollbacks, and enhanced security.

    This practice is essential for managing complex, modern infrastructure with confidence and scalability. For instance, Intuit adopted ArgoCD to manage deployments across hundreds of Kubernetes clusters, empowering developers with a self-service, Git-based workflow that significantly reduced deployment failures and operational overhead. This model shifts the focus from imperative commands to a declarative state, where the desired system state is version-controlled and auditable.

    Practical Implementation Steps

    To effectively implement GitOps and deployment automation, follow these steps:

    • Establish Git as the Source of Truth: Begin by creating dedicated Git repositories for your application manifests and infrastructure-as-code (e.g., Kubernetes YAML, Helm charts, Terraform). Use separate repositories to decouple application and infrastructure lifecycles.
    • Implement a Pull Request Workflow: Enforce a PR-based process for all changes. Use branch protection rules in Git to require peer reviews and automated checks (like linting and validation) before any change can be merged into the main branch. This ensures every change is vetted.
    • Deploy a GitOps Agent: Install a GitOps tool like ArgoCD or Flux CD in your cluster. Configure it to monitor your Git repository and automatically apply changes to synchronize the cluster state with the repository's declared state.
    • Automate Secret Management: Avoid committing secrets directly to Git. Integrate a secure solution like Sealed Secrets or HashiCorp Vault to manage sensitive information declaratively and safely within the GitOps workflow.
    • Enable Drift Detection and Alerting: Configure your GitOps tool to continuously monitor for "drift" – discrepancies between the live cluster state and the Git repository. Set up alerts to notify the team immediately if manual changes or configuration drift is detected.

    6. Comprehensive Monitoring and Observability

    Comprehensive observability is a critical evolution from traditional monitoring, providing deep, real-time insights into your system's internal state. It's a cornerstone of CI/CD pipeline best practices because it enables teams to validate deployment health and rapidly diagnose issues in complex, distributed environments. By collecting and correlating logs, metrics, and traces, you can move from asking "Is the system down?" to "Why is the system slowing down for users in this specific region after the last deployment?"

    This practice is essential for building resilient and reliable systems. For example, Netflix has built a sophisticated, custom observability platform that allows its engineers to instantly visualize the impact of a code change across thousands of microservices. This capability is key to their model of high-velocity development, enabling rapid, confident deployments while maintaining service stability for millions of users worldwide.

    Practical Implementation Steps

    To build a robust observability framework into your pipeline, focus on the three pillars:

    • Implement the Three Pillars: Instrument your applications to emit logs, metrics, and traces. Use structured logging (e.g., JSON format) for easy parsing, Prometheus for metrics collection, and OpenTelemetry for standardized, vendor-agnostic distributed tracing. This trifecta provides a complete picture of system behavior.
    • Integrate Health Checks into Deployments: Use metric-based validation as a quality gate in your pipeline. Before promoting a new version from staging to production, your pipeline should automatically query key Service Level Objectives (SLOs) like error rate and latency. If these metrics degrade beyond a set threshold, the deployment is automatically rolled back.
    • Establish Actionable Dashboards: Create tailored dashboards in tools like Grafana for different audiences. Engineering teams need granular dashboards showing application performance and resource usage, while business stakeholders need high-level views of user experience and system availability.
    • Centralize and Analyze Logs: Employ log aggregation tools like Loki or the ELK Stack (Elasticsearch, Logstash, Kibana) to centralize application and system logs. This allows for powerful querying and historical analysis, which is invaluable for debugging complex, intermittent issues that are not immediately apparent through metrics alone.

    7. Security Scanning and Policy Enforcement

    Integrating security into the pipeline, often called DevSecOps, is a non-negotiable CI/CD pipeline best practice that transforms security from a final-stage bottleneck into a continuous, automated process. This "shift-left" approach involves embedding security checks directly into the workflow, automatically scanning for vulnerabilities in code, dependencies, containers, and infrastructure configurations. By enforcing security policies as automated gates, teams can proactively identify and remediate threats long before they reach production, drastically reducing risk and the cost of fixes.

    This practice is essential for building resilient and trustworthy systems in a high-velocity development environment. For example, GitHub's Dependabot automatically scans repositories for vulnerable dependencies and creates pull requests to update them, while Google's internal systems perform mandatory security scanning on all container images before they can be deployed. This level of automation ensures that security standards are consistently met without slowing down developers.

    Practical Implementation Steps

    To effectively integrate security scanning and policy enforcement, adopt a multi-layered strategy:

    • Implement Pre-Commit and Pre-Push Hooks: Start by catching issues at the earliest possible moment. Use tools like pre-commit with hooks for secrets detection (e.g., gitleaks or trufflehog) to prevent sensitive data from ever entering the repository's history.
    • Automate Dependency and Container Scanning: Integrate Static Application Security Testing (SAST) and Software Composition Analysis (SCA) tools like Snyk or Trivy into your pipeline. Configure them to run on every build to scan application code and third-party dependencies for known vulnerabilities. Similarly, scan container images for OS-level vulnerabilities upon creation and before pushing to a registry.
    • Audit Infrastructure as Code (IaC): Use tools like Checkov or Terrascan to scan your Terraform, CloudFormation, or Kubernetes manifests for security misconfigurations. This prevents insecure infrastructure from being provisioned in the first place.
    • Establish and Enforce Policy Gates: Define clear, severity-based policies for your security gates. For instance, automatically fail any build that introduces a "critical" or "high" severity vulnerability. This ensures that only code meeting your security baseline can proceed to deployment.

    Adopting these measures is a foundational step in building a robust DevSecOps culture. To explore this topic further, you can learn more about implementing DevSecOps in CI/CD pipelines and how it enhances overall software security.

    8. Pipeline Orchestration and Visibility

    Effective pipeline orchestration involves designing a workflow with clearly defined, single-responsibility stages that manage build, test, and deployment activities in a logical sequence. This practice transforms the pipeline from a monolithic script into a modular, manageable process. Coupled with comprehensive visibility, which provides real-time dashboards and notifications, orchestration ensures all stakeholders, from developers to project managers, have a clear understanding of the release process, its status, and any bottlenecks that arise.

    This practice is critical for maintaining control and clarity in complex software delivery cycles. For example, GitLab CI/CD excels by providing a built-in "Pipeline Graph" that visually maps out every stage, job, and dependency. This graphical representation allows teams to instantly pinpoint failures or performance lags in specific stages, such as an integration test suite that takes too long to run, enabling targeted optimizations.

    Practical Implementation Steps

    To implement robust orchestration and visibility in your CI/CD pipeline best practices, focus on modularity and communication:

    • Define Granular Stages: Break down your pipeline into distinct, single-purpose stages like build, unit-test, security-scan, deploy-staging, and e2e-test. Using a tool like GitHub Actions, you can define these as separate jobs that depend on one another, ensuring a logical and fault-tolerant flow.
    • Establish Naming Conventions: Use clear and consistent naming for jobs, stages, and artifacts (e.g., app-v1.2.0-build-42.zip). This discipline makes it easier to track builds and debug failures when looking through logs or artifact repositories.
    • Implement Real-Time Notifications: Configure your CI tool to send automated alerts to communication platforms like Slack or Microsoft Teams. Set up notifications for key events such as pipeline success, failure, or manual approval requests to keep the team informed and responsive.
    • Visualize Key Metrics: Use dashboards to track and display critical CI/CD metrics, including Deployment Frequency (DF), Lead Time for Changes (LT), and Mean Time to Recovery (MTTR). Tools like GitKraken's Insights can provide visibility into CI/CD health, helping you measure and improve your pipeline's efficiency over time.

    9. Environment Parity and Configuration Management

    Maintaining environment parity is a critical CI/CD pipeline best practice that involves keeping development, staging, and production environments as identical as possible. This practice drastically reduces the "it worked on my machine" problem, where code behaves differently across stages due to subtle variations in operating systems, dependencies, or configurations. By ensuring consistency, teams can prevent unexpected deployment failures and ensure that an application validated in staging will perform predictably in production.

    This principle is essential for building reliable deployment processes. For example, Docker revolutionized this by allowing developers to package an application and its dependencies into a container that runs identically everywhere, from a local laptop to a production Kubernetes cluster. This eliminates an entire class of environment-specific bugs and streamlines the path to production.

    Practical Implementation Steps

    To achieve and maintain environment parity, focus on automation and versioning:

    • Standardize with Containerization: Use Docker or a similar container technology as the foundation for all environments. Define your application's runtime environment in a Dockerfile to ensure every instance is built from the same blueprint.
    • Implement Infrastructure as Code (IaC): Provision all environments (dev, staging, prod) using IaC tools like Terraform or AWS CloudFormation. Store these definitions in version control to track changes and automate environment creation and updates, preventing configuration drift.
    • Centralize Configuration Management: Avoid hardcoding configuration values like API keys or database URLs. Instead, manage them externally using tools like HashiCorp Vault, AWS Secrets Manager, or Kubernetes Secrets. This separation allows the same application artifact to be deployed to any environment with the appropriate configuration.
    • Automate Environment Provisioning: Integrate your IaC scripts into your CI/CD pipeline. This allows for dynamic creation of ephemeral testing environments for pull requests, providing the highest degree of confidence before merging code.

    Effectively managing these configurations is key to success. You can explore a variety of best-in-class configuration management tools to find the right fit for your technology stack and operational needs.

    10. Feedback Loops and Continuous Improvement

    An effective CI/CD pipeline is not a static artifact; it is a dynamic system that must evolve. The practice of building feedback loops and fostering a culture of continuous improvement is fundamental to this evolution. This involves more than just pipeline notifications; it means systematically collecting, analyzing, and acting on data to enhance development velocity, stability, and overall efficiency. By treating the pipeline itself as a product, teams can identify bottlenecks, refine processes, and ensure their delivery mechanism continually adapts to new challenges.

    This data-driven approach is essential for turning a functional pipeline into a high-performing one. For instance, companies across the industry rely on Google's DORA (DevOps Research and Assessment) metrics to benchmark their performance. By tracking these key indicators, organizations gain objective insights into their DevOps maturity, enabling them to make informed decisions that drive measurable improvements in their CI/CD pipeline best practices.

    Practical Implementation Steps

    To build a robust culture of continuous improvement, focus on a metrics-driven feedback system:

    • Establish Key DORA Metrics: Begin by tracking the four core DORA metrics. Use your CI/CD tool (e.g., GitLab, CircleCI, Jenkins with plugins) to measure Deployment Frequency and Lead Time for Changes. For production, use monitoring tools like Datadog or Prometheus to track Change Failure Rate and Mean Time to Recovery (MTTR).
    • Conduct Blameless Post-Mortems: After any significant production incident, hold a blameless post-mortem. The goal is not to assign fault but to identify systemic weaknesses in your pipeline, testing strategy, or deployment process. Document action items and assign owners to ensure follow-through.
    • Implement Meaningful Alerts: Configure alerts that focus on user impact and service-level objectives (SLOs), not just system noise like high CPU usage. This ensures that when an alert fires, it signifies a genuine issue that requires immediate attention, making the feedback loop more effective.
    • Visualize and Share Metrics: Create dashboards that display metric trends over time. Share these transparently across all engineering teams. This visibility helps align everyone on common goals and highlights areas where collective effort is needed for improvement.

    CI/CD Pipeline Best Practices — 10-Point Comparison

    Practice Implementation complexity Resource requirements Expected outcomes Ideal use cases Key advantages
    Automated Testing at Every Stage Medium–High: design/maintain unit, integration, E2E suites Test infra, CI capacity, test frameworks, maintenance effort Fewer defects, faster feedback, higher deployment confidence Frequent deployments, microservices, regression-prone codebases Early bug detection, reduced manual testing, scalable dev velocity
    Infrastructure as Code (IaC) Medium: module design, state management, governance IaC tools (Terraform/CF), remote state, reviewers, security controls Reproducible infra, reduced drift, auditability Multi-cloud, repeatable environments, compliance and DR needs Eliminates drift, automates provisioning, improves collaboration
    Continuous Integration with Automated Builds Low–Medium: CI pipelines, build/test orchestration Build servers/CI service, artifact storage, test suites Immediate integration issue detection, consistent artifacts Teams with frequent commits, rapid feedback requirements Prevents broken merges, consistent builds, faster dev cycles
    Containerization & Orchestration High: container lifecycle + Kubernetes operations Container registry, orchestration clusters, SRE expertise Consistent deployments, scalable workloads, easy rollbacks Microservices, large-scale apps, multi-cloud deployments Environment consistency, efficient scaling, portable deployments
    Deployment Automation & GitOps Medium–High: Git workflows, reconciliation, policy control GitOps tools (Argo/Flux), policy engines, secret management Auditable, repeatable, safer deployments with automated sync Teams wanting declarative deployments, regulated environments Git single source of truth, automated rollbacks, deployment audit trail
    Comprehensive Monitoring & Observability High: instrumentation, traces, correlation across services Monitoring stack, storage, dashboards, alerting, instrumentation effort Faster detection & RCA, performance insights, SLO validation Distributed systems, production-critical services, high-availability apps Improved MTTR, data-driven ops, deployment validation
    Security Scanning & Policy Enforcement Medium: integrate SAST/DAST/SCA, tune policies Security tools, SBOMs, secrets scanners, security expertise Fewer vulnerabilities, compliance evidence, safer releases Security-sensitive apps, regulated industries, supply-chain risk Shift-left security, automated gates, developer self-service checks
    Pipeline Orchestration & Visibility Medium: define stages, parallelism, dashboards CI/CD platform, dashboards, ownership/process definitions Clear progress visibility, bottleneck identification, audit trails Organizations with complex pipelines or many teams Stage-level visibility, artifact promotion, clearer responsibilities
    Environment Parity & Configuration Mgmt Medium: maintain IaC, configs, secret stores Containers/IaC, secret manager, staging environments Fewer environment surprises, realistic testing, smoother rollouts Teams needing reliable staging and reproducible infra Reduces "works on my machine", simplifies debugging, reliable repro
    Feedback Loops & Continuous Improvement Low–Medium: metrics, retrospectives, SLIs/SLOs Metrics tooling, dashboards, process discipline, incident tracking Continuous optimization, improved lead times and reliability Organizations tracking DORA metrics, maturing DevOps practices Data-driven improvements, faster issue resolution, learning culture

    Turn Best Practices into Your Competitive Advantage

    You've explored the ten pillars of modern software delivery, from atomic, automated tests to comprehensive observability. It’s clear that mastering these ci cd pipeline best practices is no longer a luxury reserved for tech giants; it is the foundational requirement for any organization aiming to compete on innovation, speed, and reliability. The journey from a manual, error-prone release process to a fully automated, secure, and resilient delivery engine is transformative. It's about more than just shipping code faster. It’s about building a culture of quality, empowering developers with rapid feedback, and creating a system that can adapt and scale with your business ambitions.

    Each practice we've detailed, whether it's managing your infrastructure with Terraform or integrating SAST and DAST scans directly into your pipeline, is a crucial component of a larger, interconnected system. Think of it not as a checklist to be completed, but as a framework for continuous evolution. Your pipeline is a living product that serves your development teams, and like any product, it requires consistent iteration and improvement.

    From Theory to Tangible Business Value

    Adopting these principles moves your organization beyond simple automation and into the realm of strategic engineering. When your pipeline is robust, the benefits cascade across the entire business:

    • Reduced Time-to-Market: By automating everything from builds and tests to security scans and deployments, you drastically shorten the cycle time from an idea to a feature in the hands of a customer. This agility is your primary weapon in a fast-moving market.
    • Enhanced Code Quality and Stability: A pipeline that enforces rigorous testing, environment parity, and automated security checks acts as your ultimate quality gate. The result is fewer bugs in production, reduced downtime, and a more stable, reliable product for your users.
    • Improved Developer Productivity and Morale: Developers are most effective when they can focus on writing code, not wrestling with broken builds or convoluted deployment scripts. A well-oiled CI/CD pipeline provides them with the fast feedback and autonomy they need to innovate confidently.
    • Stronger Security and Compliance Posture: Embedding security directly into the development lifecycle, a concept known as DevSecOps, turns security from a bottleneck into a shared responsibility. This "shift-left" approach helps you identify and remediate vulnerabilities early, reducing risk and simplifying compliance.

    Your Actionable Roadmap to CI/CD Excellence

    The path to maturity is an incremental one. Don't aim to implement all ten best practices overnight. Instead, focus on a phased approach that delivers immediate value and builds momentum. Start by assessing your current state. Where are the biggest bottlenecks? Where do the most frequent errors occur?

    1. Establish a Baseline: Implement robust monitoring and define key DORA metrics (Deployment Frequency, Lead Time for Changes, Change Failure Rate, and Time to Restore Service). You cannot improve what you cannot measure.
    2. Target High-Impact Areas First: If your deployment process is manual and slow, start by automating it for a single, low-risk service. If testing is a bottleneck, focus on implementing a solid unit and integration test suite.
    3. Iterate and Expand: Once you've solidified one practice, move to the next. Use the success of your initial efforts to gain buy-in and resources for broader implementation across more teams and services.

    Ultimately, a world-class CI/CD pipeline is a powerful engine for growth. It codifies your engineering standards, accelerates your feedback loops, and provides the stable foundation upon which you can build, scale, and innovate without fear. By committing to these ci cd pipeline best practices, you are not just optimizing a process; you are investing in a core competitive advantage that will pay dividends for years to come.


    Ready to transform your CI/CD pipeline from a functional tool into a strategic asset? The elite DevOps and Platform Engineers at OpsMoon specialize in designing and implementing the robust, scalable, and secure pipelines that drive business velocity. Start your journey to engineering excellence with a free, no-obligation work planning session and see how our top 0.7% talent can help you implement these best practices today.

  • Kubernetes for Developers: A Practical, Technical Guide

    Kubernetes for Developers: A Practical, Technical Guide

    For developers, the first question about Kubernetes is simple: is this another complex tool for the ops team, or does it directly improve my development workflow?

    The answer is a definitive yes. Kubernetes empowers you to build, test, and deploy applications with a level of consistency and speed that finally eliminates the classic "it works on my machine" problem. This guide provides actionable, technical steps to integrate Kubernetes into your daily workflow.

    Why Developers Should Care About Kubernetes

    Kubernetes can seem like a world of endless YAML files and cryptic kubectl commands, something best left to operations. But that view misses the point. Kubernetes isn't just about managing servers; it’s about giving you, the developer, programmatic control over your application's entire lifecycle through declarative APIs.

    Thinking of Kubernetes as just an ops tool is a fundamental misunderstanding. It's an orchestrated system designed for predictable application behavior. Your containerized application is a standardized, immutable artifact. Kubernetes is the control plane that ensures this artifact runs reliably, scales correctly, and recovers from failures automatically.

    From Local Code to Production Cloud

    The core promise of Kubernetes for developers is environment parity. The exact same container configuration and declarative manifests you run locally with tools like Minikube or Docker Desktop are what get deployed to production. This consistency eliminates an entire class of bugs that arise from subtle differences between dev, staging, and production environments.

    This isn't a niche technology. The latest data shows that 5.6 million developers worldwide now use Kubernetes. On the backend, about 30% of all developers are building on Kubernetes, making it the industry standard for cloud-native application deployment. You can find more details in recent research from SlashData.

    When you adopt Kubernetes, you're not just learning a new tool. You're adopting a workflow that radically shortens your feedback loops by providing a production-like environment on your local machine. You gain true ownership over your microservices and control your application's deployment lifecycle through code.

    Understanding Kubernetes Core Concepts for Coders

    Let's skip the abstract definitions and focus on the technical implementation of core Kubernetes objects. These API resources are the building blocks you'll use to define how your application runs. You define them in YAML and apply them to the cluster using kubectl apply -f <filename>.yaml.

    The primary function of Kubernetes is to act as a reconciliation engine. You declare the desired state of your application in YAML manifests, and the Kubernetes control plane works continuously to make the cluster's actual state match your declaration.

    Diagram showing a developer writing and deploying code to Kubernetes, which then manages and orchestrates an application.

    This workflow illustrates how your code, packaged as a container image, is handed to the Kubernetes scheduler, which then places it on a worker node to run as a live, orchestrated application.

    Pods: The Atomic Scheduling Unit

    The most fundamental building block in Kubernetes is the Pod. It is the smallest and simplest unit in the Kubernetes object model that you create or deploy. A Pod represents a single instance of a running process in your cluster. It encapsulates one or more containers (like Docker containers), storage resources (volumes), a unique network IP, and options that govern how the container(s) should run.

    While a Pod can run multiple tightly-coupled containers that share a network namespace (a "sidecar" pattern), the most common use case is a one-to-one mapping: one Pod encapsulates one container. This isolation is key. Every Pod is assigned its own internal IP address within the cluster, enabling communication between services without manual network configuration.

    Deployments: The Declarative Application Manager

    You almost never create Pods directly. Instead, you use higher-level objects like a Deployment. A Deployment is a declarative controller that manages the lifecycle of a set of replica Pods. You specify a desired state in the Deployment manifest, and the Deployment Controller changes the actual state to the desired state at a controlled rate.

    You tell the Deployment, "I need three replicas of my application running the nginx:1.14.2 container image." The Deployment controller instructs the scheduler to find nodes for three Pods. If a Pod crashes, the controller instantly creates a replacement. This self-healing is one of the most powerful features of Kubernetes.

    A Deployment is all about maintaining a desired state. Its spec.replicas field defines the number of Pods, and the spec.template field defines the Pod specification. Kubernetes works tirelessly to ensure the number of running Pods matches this declaration.

    Services: The Stable Network Abstraction

    Since Pods are ephemeral—they can be created and destroyed—their IP addresses are not stable. Trying to connect directly to a Pod IP is brittle and unreliable.

    This is where the Service object is critical. A Service provides a stable network endpoint (a single, unchanging IP address and DNS name) for a set of Pods. It uses a selector to dynamically identify the group of Pods it should route traffic to. This completely decouples clients from the individual Pods, ensuring reliable communication.

    For example, a Service with selector: {app: my-api} will load-balance traffic across all Pods that have the label app: my-api.

    ConfigMaps and Secrets: The Configuration Primitives

    Hardcoding configuration data into your container images is a critical anti-pattern. Kubernetes provides two dedicated objects for managing configuration externally.

    • ConfigMaps: Store non-sensitive configuration data as key-value pairs. You can inject this data into your Pods as environment variables or as mounted files in a volume.
    • Secrets: Used for sensitive data like API keys, database passwords, and TLS certificates. Secrets are stored base64-encoded by default and offer more granular access control mechanisms within the cluster (like RBAC).

    This separation of configuration from the application artifact is a core principle of cloud-native development. A game-changing 41% of enterprises report their app portfolios are already predominantly cloud-native, and a massive 82% are planning to use Kubernetes for future projects. You can dive deeper into the latest cloud-native developer trends in the recent CNCF report.

    Kubernetes Objects: A Developer's Cheat Sheet

    This technical reference table summarizes the core Kubernetes objects from a developer's perspective.

    Kubernetes Object Technical Function Developer's Use Case
    Pod The atomic unit of scheduling; encapsulates container(s), storage, and a network IP. Represents a running instance of your application or microservice.
    Deployment A controller that manages a ReplicaSet, providing declarative updates and self-healing for Pods. Defines your application's desired state, replica count, and rolling update strategy.
    Service Provides a stable IP address and DNS name to load-balance traffic across a set of Pods. Exposes your application to other services within the cluster or externally.
    ConfigMap An API object for storing non-confidential data in key-value pairs. Externalizes application configuration (e.g., URLs, feature flags) from your code.
    Secret An API object for storing sensitive information, such as passwords, OAuth tokens, and ssh keys. Manages credentials and other sensitive data required by your application.

    Mastering these five objects provides the foundation for building and deploying production-grade applications on Kubernetes.

    Building Your Local Kubernetes Development Workflow

    Switching from a simple npm start or rails server to Kubernetes can introduce friction. The cycle of building a new Docker image, pushing it to a registry, and running kubectl apply for every code change is prohibitively slow for active development.

    The goal is to optimize the "inner loop"—the iterative cycle of coding, building, and testing—to be as fast and seamless on Kubernetes as it is locally. A fast, automated inner loop is the key to productive Kubernetes for developers.

    Slow feedback loops are a notorious drain on developer productivity. Optimizing this cycle means you spend more time writing code and less time waiting for builds and deployments. As you get your K8s workflow dialed in, you might also find some helpful practical tips for faster coding and improving developer productivity.

    A developer's workflow: code, build, deploy to local Kubernetes using Skaffold, getting fast feedback.

    Choosing Your Local Cluster Environment

    First, you need a Kubernetes cluster running on your machine. Several tools provide this, each with different trade-offs in resource usage, setup complexity, and production fidelity.

    If you're coming from a Docker background, you might want to check out our detailed Docker Compose tutorial to see how some of the concepts translate.

    Here’s a technical breakdown of popular local cluster tools:

    Tool Architecture Best For Technical Advantage
    Minikube Single-node cluster inside a VM (e.g., HyperKit, VirtualBox) or container. Beginners and straightforward single-node testing. Simple minikube start/stop/delete lifecycle. Good for isolated environments.
    kind (Kubernetes in Docker) Runs Kubernetes cluster nodes as Docker containers. Testing multi-node setups and CI environments. High fidelity to production multi-node clusters; fast startup and teardown.
    Docker Desktop Single-node cluster integrated into the Docker daemon. Developers heavily invested in the Docker ecosystem. Zero-config setup; seamless integration with Docker tools and dashboard.

    For most developers, kind or Docker Desktop offers the best balance. Kind provides high-fidelity, multi-node clusters with low overhead, while Docker Desktop offers unparalleled convenience for those already using it.

    Automating Your Workflow with Skaffold

    Manually running docker build, docker push, and kubectl apply repeatedly is inefficient. A tool like Skaffold automates this entire build-and-deploy pipeline, watching your local source code for changes.

    When you save a file, Skaffold detects the change, rebuilds the container image, and redeploys it to your local cluster in seconds.

    To set it up, you create a skaffold.yaml file in your project's root. This file declaratively defines the build and deployment stages of your application.

    Skaffold bridges the gap between the speed of traditional local development and the power of a real container-orchestrated environment, providing the best of both worlds with minimal configuration.

    A Practical Skaffold Example

    Here is a minimal skaffold.yaml for a Node.js application. This assumes you have a Dockerfile for building your image and a Kubernetes manifest file named k8s-deployment.yaml.

    # skaffold.yaml
    apiVersion: skaffold/v4beta7
    kind: Config
    metadata:
      name: my-node-app
    build:
      artifacts:
        - image: my-node-app # The name of the image to build
          context: . # The build context is the current directory
          docker:
            dockerfile: Dockerfile # Points to your Dockerfile
    deploy:
      kubectl:
        manifests:
          - k8s-deployment.yaml # Points to your Kubernetes manifests
    

    With this file in your project, you start the development loop with a single command:

    skaffold dev

    Now, Skaffold performs the following actions:

    1. Watch: It monitors your source files for any changes.
    2. Build: On save, it automatically rebuilds your Docker image. For local development, it intelligently loads the image directly into your local cluster's Docker daemon, skipping a slow push to a remote registry.
    3. Deploy: It applies your k8s-deployment.yaml manifest, triggering a rolling update of your application in the cluster.

    This instant feedback loop makes iterating on a Kubernetes-native application feel fluid and natural, allowing you to focus on writing code, not on manual deployment chores.

    Debugging Your Application Inside a Live Cluster

    Once your application is running inside a Kubernetes Pod, you can no longer attach a local debugger directly. The code is executing in an isolated network namespace within the cluster. This abstraction is great for deployment but complicates debugging.

    Kubernetes provides a powerful set of tools to enable interactive debugging of live, containerized applications. Mastering these kubectl commands is essential for any developer working with Kubernetes.

    Workflow illustrating Kubernetes debugging using kubectl logs, port-forwarding, and remote debugging with breakpoints.

    Streaming Logs in Real-Time

    The most fundamental debugging technique is tailing your application's log output. The kubectl logs command streams the stdout and stderr from a container within a Pod.

    First, get the name of your Pod (kubectl get pods), then stream its logs:

    kubectl logs -f <your-pod-name>

    This provides immediate, real-time feedback for diagnosing errors, observing startup sequences, or monitoring request processing. Effective logging is the foundation of observability. For a deeper dive, check out these Kubernetes monitoring best practices.

    Accessing Your Application Locally

    Often, you need to interact with your application directly with a browser, an API client like Postman, or a database tool. While a Kubernetes Service might expose your app inside the cluster, it's not directly accessible from your localhost.

    Port-forwarding solves this. The kubectl port-forward command creates a secure tunnel from your local machine directly to a Pod inside the cluster. It maps a local port to a port on the target Pod.

    To forward a local port to a Pod managed by a Deployment:

    kubectl port-forward deployment/<your-deployment-name> 8080:80

    This command instructs kubectl: "Forward all traffic from my local port 8080 to port 80 on a Pod managed by <your-deployment-name>." You can now access your application at http://localhost:8080 as if it were running locally.

    Connecting Your IDE for Remote Debugging

    For the deepest level of insight, nothing beats connecting your IDE's debugger directly to the process running inside a Pod. This allows you to set breakpoints, inspect variables, step through code line-by-line, and analyze the call stack of the live application.

    This process involves two steps:

    1. Enable the Debug Agent: Configure your application's runtime to start with a debugging agent listening on a specific network port.
    2. Port-Forward the Debug Port: Use kubectl port-forward to create a tunnel from your local machine to that debug port inside the container.

    Let's walk through a technical example with a Node.js application.

    Hands-On Example: Remote Debugging Node.js

    First, modify your Dockerfile to expose the debug port and adjust the startup command. The --inspect=0.0.0.0:9229 flag tells the Node.js process to listen for a debugger on port 9229 and bind to all network interfaces.

    # Dockerfile
    ...
    # Expose the application port and the debug port
    EXPOSE 3000 9229
    
    # Start the application with the debug agent enabled
    CMD [ "node", "--inspect=0.0.0.0:9229", "server.js" ]
    

    After rebuilding and deploying the image, use kubectl port-forward to connect your local machine to the exposed debug port:

    kubectl port-forward deployment/my-node-app 9229:9229

    Finally, configure your IDE (like VS Code) to attach to a remote debugger. In your .vscode/launch.json file, create an "attach" configuration:

    {
      "version": "0.2.0",
      "configurations": [
        {
          "name": "Attach to Remote Node.js",
          "type": "node",
          "request": "attach",
          "port": 9229,
          "address": "localhost",
          "localRoot": "${workspaceFolder}",
          "remoteRoot": "/usr/src/app"
        }
      ]
    }
    

    Launching this debug configuration connects your IDE through the tunnel directly to the Node.js process inside the Pod. You can now set breakpoints and step through code that is executing live inside your Kubernetes cluster.

    Automating Deployments with a CI/CD Pipeline

    Connecting your local development loop to a reliable, automated deployment process is where Kubernetes delivers its full value. Manual deployments are error-prone and unscalable. A well-designed Continuous Integration and Continuous Delivery (CI/CD) pipeline automates the entire path from code commit to a live, running application.

    This section outlines a modern pipeline using automated checks and a Git-centric deployment model.

    Building the CI Foundation with GitHub Actions

    Continuous Integration (CI) is the process of taking source code, validating it, and packaging it into a production-ready container image. A tool like GitHub Actions allows you to define and execute these automated workflows directly from your repository.

    A robust CI workflow for a containerized application includes these steps:

    1. Trigger on Push: The workflow is triggered automatically on pushes to a specific branch, like main.
    2. Run Tests: The full suite of unit and integration tests is executed. A single test failure halts the pipeline, preventing regressions.
    3. Scan for Vulnerabilities: A security scanner like Trivy is used to scan the base image and application dependencies for known CVEs.
    4. Build and Push Image: If all checks pass, the workflow builds a new Docker image, tags it with an immutable identifier (like the Git commit SHA), and pushes it to a container registry (e.g., Docker Hub, GCR).

    This process ensures every image in your registry is tested, secure, and traceable. For a deeper dive, you can explore our guides on setting up a robust Kubernetes CI/CD pipeline.

    Embracing GitOps for Continuous Delivery

    With a trusted container image available, Continuous Delivery (CD) is the process of deploying it to the cluster. We'll use a modern paradigm called GitOps, implemented with a tool like Argo CD.

    The core principle of GitOps is that your Git repository is the single source of truth for the desired state of your application. Instead of running imperative kubectl apply commands, you declaratively define your application's configuration in a Git repository.

    GitOps decouples the CI process (building an image) from the CD process (deploying it). The CI pipeline's only responsibility is to produce a verified container image. The deployment itself is managed by a separate, observable, and auditable process.

    This provides an immutable, version-controlled audit trail of every change to your production environment. Rolling back a deployment is as simple and safe as a git revert.

    How Argo CD Powers the GitOps Workflow

    Argo CD is a declarative GitOps tool that runs inside your Kubernetes cluster. Its primary responsibility is to ensure the live state of your cluster matches the state defined in your Git repository.

    The workflow is as follows:

    1. Configuration Repository: A dedicated Git repository stores your Kubernetes YAML manifests (Deployments, Services, etc.).
    2. Argo CD Sync: You configure Argo CD to monitor this repository.
    3. Deployment Trigger: To deploy a new version of your application, you do not use kubectl. Instead, you open a pull request in the configuration repository to update the image tag in your Deployment manifest.
    4. Automatic Synchronization: Once the PR is merged, Argo CD detects a drift between the live cluster state and the desired state in Git. It automatically pulls the latest manifests and applies them to the cluster, triggering a controlled rolling update of your application.

    This workflow empowers developers to manage deployments using Git, providing a secure, auditable, and automated path to production. As pipelines mature, observability becomes critical. 51% of experts identify observability as a top concern, second only to security (72%). Mature pipelines integrate monitoring of SLOs and SLIs, a topic you can explore by seeing what 500 experts revealed about Kubernetes adoption.

    Got a solid handle on the concepts? Good. But let's be real, the day-to-day work is where the real questions pop up. Here are a few common ones I hear from developers diving into Kubernetes for the first time.

    So, Do I Actually Have to Learn Go Now?

    Short answer: No.

    Longer answer: Absolutely not. While Kubernetes itself is written in Go, as an application developer, you interact with its declarative API primarily through YAML manifests, the kubectl CLI, and CI/CD pipeline configurations.

    Your expertise in your application's language (e.g., Python, Java, Node.js) and a solid understanding of Docker are what matter most. You would only need to learn Go if you were extending the Kubernetes API itself by writing custom controllers or operators, which is an advanced use case.

    Kubernetes vs. Docker Swarm: What's the Real Difference?

    Think of it as two different tools for different scales.

    Docker Swarm is integrated directly into the Docker engine, making it extremely simple to set up for basic container orchestration. It's a good choice for smaller-scale applications where ease of use is the primary concern.

    Kubernetes, in contrast, is the de facto industry standard for large-scale, complex, and highly available systems. It has a steeper learning curve but offers a vastly larger ecosystem of tools (for monitoring, networking, security, etc.), greater flexibility, and is supported by every major cloud provider.

    How Should I Handle Config and Secrets? This Seems Important.

    It is important, and the golden rule is: never hardcode configuration or credentials into your container images. This is a major security vulnerability and makes your application inflexible.

    Kubernetes provides two dedicated API objects for this:

    • ConfigMaps: For non-sensitive configuration data like environment variables, feature flags, or service URLs. They are stored as key-value pairs and can be mounted into Pods as files or injected as environment variables.
    • Secrets: For sensitive data like API keys, database passwords, and TLS certificates. They are stored base64-encoded and can be integrated with more secure storage backends like HashiCorp Vault.

    I Keep Hearing About "Helm Charts." What Are They and Why Should I Care?

    Deploying a complex application often involves managing multiple interdependent YAML files: a Deployment, a Service, an Ingress, a ConfigMap, Secrets, etc. Managing these manually is tedious and error-prone.

    Helm is the package manager for Kubernetes.

    A Helm Chart bundles all these related YAML files into a single, versioned package. It uses a templating engine, allowing you to parameterize your configurations (e.g., set the image tag or replica count during installation). Instead of applying numerous files individually, you can install, upgrade, or roll back your entire application with simple Helm commands, making your deployments repeatable and manageable.


    Navigating Kubernetes is a journey, not a destination. But you don't have to go it alone. When you need expert guidance to build cloud infrastructure that’s secure, scalable, and automated, OpsMoon is here to help. Let's map out your Kubernetes strategy together in a free work planning session.

  • How to Hire and Leverage an Expert Cloud DevOps Consultant

    How to Hire and Leverage an Expert Cloud DevOps Consultant

    A Cloud DevOps Consultant is not just an advisor; they are the hands-on technical architect and engineer for your entire software delivery lifecycle. They design, build, and optimize the automated systems that directly determine your organization's velocity, reliability, and cloud expenditure. They are the specialists who construct the high-performance factory floor for your code.

    This critical, hands-on expertise is why the DevOps consulting market is projected to surge from $8.6 billion in 2025 to an estimated $16.9 billion by 2033. Organizations that engage these experts report tangible outcomes, including up to 30% savings on infrastructure costs and shipping code 60% faster. You can read more about the growth of the DevOps consulting market and its impact.

    A sketch illustrating a DevOps pipeline with code, build, test, deploy stages, observability monitoring, and infrastructure as code.

    So what does this "factory" actually look like from a technical standpoint? It breaks down into three core engineering domains.

    The Automated Code Assembly Line

    At the core is the CI/CD (Continuous Integration/Continuous Delivery) pipeline. This is the automated system that compiles, tests, secures, and deploys code from a Git commit to a live production environment with minimal human intervention.

    A consultant doesn't just install a tool; they engineer a multi-stage pipeline that executes critical quality and security gates:

    • Code Compilation & Static Analysis: Compiling source code and running tools like SonarQube or ESLint to catch code quality issues and bugs before runtime.
    • Automated Testing: Executing a suite of unit tests, integration tests, and security scans (SAST/DAST) to validate functionality and identify vulnerabilities.
    • Secure Packaging: Building the application into a standardized, immutable artifact, typically a minimal-footprint Docker container using multi-stage builds.
    • Deployment Strategy Execution: Implementing and automating advanced deployment patterns like blue-green, canary, or rolling updates to ensure zero-downtime releases.

    The Resilient, Code-Defined Factory Floor

    Next, a consultant constructs the underlying cloud infrastructure using Infrastructure as Code (IaC). With tools like Terraform or Pulumi, they define every component—VPCs, subnets, security groups, IAM roles, compute instances, and databases—in declarative, version-controlled configuration files.

    This fundamentally transforms your infrastructure from a manually-configured, fragile asset into a software product.

    Your infrastructure becomes a predictable, auditable, and repeatable blueprint. An entire production environment can be programmatically provisioned, updated, or destroyed in minutes. This is the bedrock of effective disaster recovery, ephemeral testing environments, and rapid scalability.

    The Sophisticated Observability Control Room

    Finally, every modern platform requires a control room. A consultant implements a comprehensive observability stack for deep, proactive insight into system health and performance. This goes far beyond legacy monitoring of CPU and memory.

    They integrate and configure tools like Prometheus for time-series metrics, Grafana for visualization, and OpenTelemetry for distributed tracing. This setup enables engineering teams to diagnose the root cause of latency or errors across complex microservices, moving from reactive alerting to proactive performance optimization.

    To put it all together, here's a quick look at how these technical functions deliver tangible business value.

    Core Competencies of a Cloud DevOps Consultant

    Technical Function Key Deliverables Business Impact
    CI/CD Pipeline Automation Multi-stage, fully automated build, test, and deployment pipelines (e.g., Jenkins, GitLab CI, GitHub Actions). Increased Velocity: Reduce lead time for changes from weeks to hours. Ship features faster and more frequently. Minimize manual deployment errors.
    Infrastructure as Code (IaC) Modular, reusable, and version-controlled infrastructure definitions (e.g., Terraform, CloudFormation, Pulumi). Cost Optimization & Reliability: Eliminate configuration drift, enable one-click disaster recovery, and optimize cloud spend via automated provisioning/de-provisioning.
    Observability & Monitoring Integrated metrics, logging, and tracing stacks (e.g., Prometheus, Grafana, OpenTelemetry, ELK Stack). Improved Uptime & MTTR: Proactively identify and resolve performance bottlenecks before they impact customers. Drastically reduce Mean Time to Recovery.
    Cloud Security & Compliance (DevSecOps) Automated security scanning (SAST, DAST, SCA) in pipelines, policy-as-code (e.g., OPA), secrets management (e.g., Vault). Reduced Risk & Audit Overhead: Embed security into the development lifecycle ("Shift Left"). Automate compliance evidence gathering for standards like SOC 2 or ISO 27001.
    Containerization & Orchestration Optimized Dockerfiles, Kubernetes (K8s) cluster architecture, Helm charts, and custom operators. Enhanced Scalability & Efficiency: Standardize application runtime environments. Improve resource utilization and simplify the management of distributed microservices.

    By architecting these interconnected systems, a Cloud DevOps consultant creates a robust, automated, and observable platform that empowers your engineering teams to focus on building business value.

    The Technical Skill Matrix for Vetting Candidates

    When hiring an elite cloud DevOps consultant, you must evaluate their ability to solve complex technical problems, not just recite buzzwords. This technical matrix is a blueprint for vetting a candidate's practical, hands-on capabilities in building and managing modern cloud-native systems.

    Genuine mastery of at least one major cloud provider is the non-negotiable foundation. This means deep architectural knowledge, not just surface-level familiarity with the console.

    Core Cloud and Infrastructure Proficiency

    A qualified consultant must have production-grade experience with one of the "big three" public clouds, understanding the nuanced trade-offs between their services.

    • Cloud Provider Mastery (AWS, Azure, or GCP): Test their architectural depth. Ask them to design a highly available, multi-AZ architecture for a stateful web application. A strong candidate will justify their choice of AWS RDS Multi-AZ over a self-managed database on EC2, or explain the networking implications of using Azure Private Link versus VNet Peering.
    • Infrastructure as Code (IaC) Fluency: Terraform is the de facto standard. A senior consultant should be able to explain how to structure Terraform code using modules for reusability and composition. Ask them to describe strategies for managing remote state securely (e.g., using S3 with DynamoDB for locking) and their experience with tools like Terragrunt for managing multiple environments. Bonus points for proficiency in Pulumi or the AWS CDK.
    • Containerization and Orchestration: Expert-level knowledge of Docker and Kubernetes is mandatory. Can they write a lean, secure, multi-stage Dockerfile that minimizes image size and attack surface? Can they design a Kubernetes deployment manifest that correctly configures readiness/liveness probes, resource requests/limits, and pod anti-affinity rules for high availability? These are the practical skills that matter.

    Automation and Observability Skills

    Infrastructure is just the foundation. A consultant's true value is demonstrated through their ability to automate processes and build self-healing systems with deep observability.

    A consultant who cannot automate themselves out of a job is missing the point of DevOps. Their goal should be to build self-healing, automated systems that reduce manual toil, not create dependencies on their continued presence.

    Look for deep, practical experience in these domains:

    1. Scripting for Automation: Proficiency in a language like Python or Go is essential for writing custom automation, interacting with cloud provider SDKs, and building CLI tools. Ask them for a specific example of a script they wrote to automate a tedious operational task, like rotating credentials or pruning old snapshots.
    2. CI/CD Pipeline Architecture: They must have designed and implemented CI/CD pipelines. Ask about their experience with securing pipelines, managing secrets, caching dependencies for faster builds, and implementing GitOps workflows with tools like ArgoCD or Flux. Their knowledge should span tools like GitHub Actions or GitLab CI.
    3. Building the Observability Stack: A consultant must have hands-on experience implementing the three pillars of observability. Ask them how they would instrument an application using OpenTelemetry to capture traces. They should be able to write PromQL queries in Prometheus to calculate SLIs like error rates and p99 latency, and build insightful dashboards in Grafana.

    Beyond the Tech Stack: Soft Skills and Certifications

    Technical expertise alone is insufficient. A great cloud DevOps consultant must be able to translate complex technical decisions into business impact and mentor teams effectively. Look for evidence of systems thinking and clear, concise communication.

    Certifications can validate foundational knowledge, though they are secondary to proven experience.

    • AWS Certified DevOps Engineer – Professional: This certification validates deep expertise in provisioning, operating, and managing distributed application systems on the AWS platform.
    • Certified Kubernetes Administrator (CKA): This performance-based exam proves a candidate possesses the hands-on, command-line skills to administer production-grade Kubernetes clusters.

    Ultimately, you are looking for a practitioner with a rare combination of deep technical ability and the strategic communication skills needed to drive meaningful organizational change. To learn more about identifying these experts, see our guide on effective consultant talent acquisition.

    Identifying the Right Time to Hire a Consultant

    Engaging a cloud DevOps consultant is a strategic decision, not a reactive measure. Identifying the right moment to bring in an expert is as crucial as selecting the right person. Proper timing ensures the engagement is a high-ROI investment that accelerates your roadmap and fortifies your technical platform.

    The need for this expertise is widespread. The global Cloud Professional Services market is forecast to grow from $30.5 billion in 2025 to $130.4 billion by 2034, driven by companies seeking to manage cloud complexity and accelerate innovation.

    Common Technical Triggers for Hiring an Expert

    Certain technical anti-patterns are clear indicators that your team's cognitive load is too high and an external expert is needed. These are not minor inconveniences; they are symptoms of systemic issues that erode engineering velocity and increase operational risk.

    Here are the classic inflection points where a consultant provides immediate value:

    • Deployment Frequency Stalls: Your team's deployment frequency has regressed from multiple times a week to a high-ceremony, bi-weekly or monthly event. This signals friction in your CI/CD process—brittle tests, manual steps, or slow builds—that a consultant can diagnose and automate.
    • Manual Rollbacks Are the Norm: If a failed deployment triggers a "war room" and requires manual database changes or server logins to roll back, your release process is broken. A consultant can implement automated, reliable deployment strategies like blue-green or canary releases with automatic rollback triggers.
    • Cloud Costs Are Spiraling Out of Control: Your monthly cloud bill is increasing without a clear correlation to business growth. An expert can implement FinOps practices, use IaC to enforce resource tagging, identify idle or oversized resources, and establish automated cost monitoring and alerting.

    Strategic Goals That Demand Specialized Knowledge

    Sometimes, the trigger is an opportunity, not a problem. You are ready to adopt a transformative technology or methodology, but your team lacks the deep, production-level experience to execute it successfully.

    A consultant acts as a catalyst here. They bring in proven patterns and best practices, helping your team sidestep common pitfalls and massively shorten the learning curve. This ensures the project actually delivers value instead of becoming a technical dead end.

    Key strategic initiatives that warrant a consultant include:

    1. Migrating to Kubernetes: Adopting a container orchestrator like Kubernetes is a significant architectural shift. A consultant ensures your cluster is designed for security, scalability, and operational efficiency from day one, covering aspects like networking (CNI), ingress, and RBAC.
    2. Implementing a Real DevSecOps Strategy: You want to "shift security left," but your developers aren't security experts. A consultant can integrate automated security tooling (SAST, DAST, SCA, container scanning) directly into the CI/CD pipeline, making security an automated, transparent part of the development workflow.
    3. Building a True Observability Platform: Moving beyond basic CPU/memory monitoring to a rich stack with metrics, logs, and traces requires specialized expertise. A consultant can architect and implement a platform that enables you to debug production issues in minutes, not hours.

    When considering external help, it is vital to understand the difference between staff augmentation vs consulting. Staff augmentation adds manpower; consulting provides expert ownership of a specific outcome. A cloud DevOps consultant is hired to drive a tangible transformation.

    A Step-by-Step Technical Evaluation Checklist

    Hiring a cloud DevOps consultant requires a rigorous, hands-on process that validates their ability to architect and implement solutions, not just talk about them. This technical checklist is designed to help engineering leaders identify true practitioners who can deliver value from day one.

    Step 1: Architect the Scope

    Before screening candidates, you must define the problem with technical precision. A vague objective leads to a vague outcome.

    Create a "Current State vs. Future State" technical document. This serves as the blueprint for the engagement.

    • Current State: Quantify the pain points. Instead of "deployments are slow," specify: "Our monolithic application deployment takes 4 hours, requires manual SQL schema updates, and has a 15% change failure rate, necessitating frequent, disruptive rollbacks."
    • Future State: Define success with measurable, technical KPIs. For example: "Achieve a fully automated CI/CD pipeline for our containerized microservices on Kubernetes that executes in under 15 minutes with a change failure rate below 5% and a Mean Time to Recovery (MTTR) of less than 30 minutes."

    This document becomes your North Star, providing a clear definition of "done" for both you and the candidate.

    Step 2: Design a Practical Technical Challenge

    Abandon abstract whiteboard problems. The most effective evaluation is a small-scale, hands-on challenge that mirrors the actual work. This reveals their technical proficiency, problem-solving approach, and attention to detail.

    A robust technical challenge should include:

    1. A Sample Application: Provide a simple web application (e.g., a basic Node.js or Python API) in a Git repository.
    2. A Clear, Bounded Task: Ask the candidate to:
      • Containerize the application using a secure, multi-stage Dockerfile.
      • Write Terraform code to provision the necessary cloud infrastructure (e.g., a container registry and a serverless container service).
      • Create a CI pipeline script (GitHub Actions or GitLab CI) that builds the image, runs linters/tests, pushes to the registry, and deploys the application.
    3. A Thorough Code Review: Evaluate the solution's quality, not just its functionality. Did they minimize the Docker image size? Is the Terraform code modular and idempotent? Is the pipeline script efficient and readable?

    This exercise tests core competencies—Docker, IaC, CI/CD—in a realistic context.

    The goal of a technical challenge isn't to trip someone up. It's to create a collaborative scenario where you can see how they think. The way they ask questions, communicate trade-offs, and justify their decisions is often more telling than the final code itself.

    Step 3: Ask About Failures and Trade-Offs

    During the interview, move beyond success stories. The most insightful discussions revolve around failures, production outages, and complex trade-off decisions. This is where you uncover true seniority.

    Ask targeted, open-ended questions that probe their reasoning:

    • "Describe the most significant production outage you were involved in. Walk me through the incident response, the post-mortem process, and the specific technical and process changes you implemented to prevent recurrence."
    • "Describe a time you had to choose between a managed cloud service (e.g., AWS RDS) and a self-hosted alternative on VMs. What factors did you consider (cost, operational overhead, performance), and how did you justify your final recommendation?"
    • "Tell me about a time a major infrastructure migration or platform upgrade went wrong. What was the root cause, what did you learn, and how did it change your approach to future projects?"

    Listen for answers that demonstrate technical depth, ownership, and an understanding of the business context.

    Step 4: Verify Past Work and Impact

    Validate the candidate's claims. A top-tier consultant will have a portfolio of work (e.g., public GitHub repositories, blog posts) or can speak with extreme detail about their specific contributions to past projects. During reference checks, ask specific, technical questions to their former managers or peers.

    Use a weighted scorecard to standardize your evaluation and mitigate bias.

    Consultant Evaluation Scorecard

    Evaluation Criteria Weight (1-5) Candidate A Score Candidate B Score Notes
    Technical Challenge Performance 5 4 3 Candidate A's Dockerfile was optimized for size and security.
    Cloud Platform Expertise (AWS/GCP/Azure) 5 5 4 B had less experience with our primary cloud, AWS.
    CI/CD & Automation Skills 4 4 5 B showed deeper knowledge of advanced GitLab CI features.
    Infrastructure as Code (Terraform/Pulumi) 4 5 3 A has extensive production Terraform experience.
    Problem-Solving & Critical Thinking 5 4 4 Both candidates demonstrated strong analytical skills.
    Communication & Collaboration 3 5 4 A was exceptionally clear in explaining complex trade-offs.
    Culture Fit & Alignment 2 4 5 B's approach to teamwork seems a perfect fit for our org.
    Total Weighted Score 4.5 4.0

    This structured process ensures you hire a consultant who can not only strategize but also execute, building the resilient, automated systems your business requires. For more on this, our production readiness checklist provides a comprehensive framework.

    Sample Project Roadmaps for Common Engagements

    To move from abstract requirements to concrete execution, let's outline what a cloud DevOps consultant's engagement looks like in practice. A successful project is not an open-ended arrangement; it is a structured initiative with well-defined phases, technical deliverables, and measurable milestones.

    These technical playbooks illustrate what to expect week-by-week for common, high-impact projects. They provide a clear framework for collaboration and progress tracking.

    First, however, a solid evaluation is key to ensuring you've chosen a consultant capable of executing these roadmaps.

    A consultant evaluation timeline infographic with phases: Define, Test, Verify. Define and Test are preparatory, Verify is a key phase.

    This process ensures that the scope is defined, capabilities are tested, and the consultant is verified before the project begins.

    30 Day CI/CD Pipeline Build

    Objective: A rapid, focused engagement to build a production-ready, automated CI/CD pipeline for a new or existing service, dramatically reducing lead time for changes.

    • Week 1: Discovery and Scaffolding
      • Milestone: Finalize pipeline requirements and select the toolchain (e.g., GitHub Actions, GitLab CI).
      • Deliverables: An optimized, multi-stage Dockerfile for the service; initial pipeline configuration files (.yml); and a secure secrets management strategy (e.g., using Vault or native cloud KMS).
    • Weeks 2-3: Pipeline Construction and Integration
      • Milestone: Implement and integrate all core pipeline stages: build, test, and security scanning.
      • Deliverables: A fully functioning pipeline that automatically triggers on code commits, runs unit/integration tests, performs static analysis (SAST), and scans container images for known vulnerabilities (SCA).
    • Week 4: Deployment Automation and Handover
      • Milestone: Automate deployment to staging and production environments using a zero-downtime strategy.
      • Deliverables: A production-ready pipeline with promotion triggers (e.g., manual approval for production), comprehensive documentation, and a knowledge transfer session with the engineering team.

    60 Day Infrastructure as Code Migration

    Objective: Migrate an existing, manually-managed application infrastructure to Terraform, establishing a single source of truth that is version-controlled, auditable, and reproducible.

    • Weeks 1-2: Audit and Architectural Design
      • Milestone: Conduct a thorough audit of the existing cloud infrastructure and design a modular, scalable Terraform architecture.
      • Deliverables: A detailed "current vs. future state" architecture diagram; a defined Terraform project structure with a plan for module composition; a strategy for importing existing resources into Terraform state.
    • Weeks 3-5: IaC Development and Validation
      • Milestone: Write and test the Terraform code for all infrastructure components (networking, compute, storage, IAM).
      • Deliverables: A complete set of reusable Terraform modules; a CI/CD pipeline for validating Terraform code (terraform fmt, validate, plan); a secure remote backend configuration for state management. For more on this, see our guide on cloud migration consultation.
    • Weeks 6-8: Phased Cutover and Optimization
      • Milestone: Execute a carefully planned, low-risk migration from the manually-managed infrastructure to the new Terraform-managed environment.
      • Deliverables: A successfully migrated production environment; documentation and training on the new IaC workflow; implementation of cost-saving policies (e.g., automated shutdown of non-production environments).

    90 Day Kubernetes and Observability Implementation

    Objective: Architect and deploy a production-grade Kubernetes platform and integrate a comprehensive observability stack to enable proactive performance management.

    This project shifts the organization's operational posture from reactive ("is the system down?") to proactive ("why is this API call 50ms slower?"), providing deep insights rather than just basic alerts.

    1. Month 1: Kubernetes Foundation
      • Milestone: Provision a secure, scalable Kubernetes cluster (EKS, GKE, or AKS) using Infrastructure as Code.
      • Deliverables: A production-ready cluster with a hardened control plane, proper network policies, role-based access control (RBAC), and a configured ingress controller.
    2. Month 2: Application Onboarding and CI/CD Integration
      • Milestone: Containerize the target application and create the necessary Kubernetes manifests for deployment.
      • Deliverables: A set of version-controlled Helm charts for the application; a CI/CD pipeline that automatically builds, tests, and deploys the application to the Kubernetes cluster using a GitOps controller like ArgoCD.
    3. Month 3: Observability Stack Integration
      • Milestone: Deploy and configure a full observability stack using tools like Prometheus for metrics, Grafana for dashboards, Loki for logging, and OpenTelemetry for tracing.
      • Deliverables: Custom Grafana dashboards visualizing key application SLIs/SLOs; distributed tracing implemented in the application; a centralized logging solution; training for the engineering team on how to use these new tools to debug and optimize their services.

    How to Measure the ROI of Your DevOps Consultant

    Hiring a cloud DevOps consultant is a significant investment that must be justified with measurable returns. To demonstrate value to stakeholders, you need a framework that translates technical improvements into tangible business outcomes, moving beyond anecdotal evidence to hard data.

    The industry-standard DORA metrics are the starting point. These four key performance indicators provide a quantitative, data-driven assessment of your software delivery capabilities, creating a clear "before and after" picture of a consultant's impact.

    Quantifying Engineering Velocity and Stability

    DORA metrics offer a universal language for engineering performance. A skilled consultant will instrument your CI/CD and deployment systems to track these metrics automatically, providing objective proof of improvement.

    • Deployment Frequency: How often does your organization successfully release to production? A consultant's work should increase this from monthly or weekly to multiple times per day for elite teams, directly increasing the rate of value delivery.
    • Lead Time for Changes: What is the elapsed time from code commit to code successfully running in production? By removing bottlenecks in the CI/CD pipeline, a consultant can slash this time from weeks to hours, accelerating the entire development lifecycle.
    • Mean Time to Recovery (MTTR): How long does it take to restore service after a production impairment? Implementing better monitoring, automated rollbacks, and IaC for rapid environment rebuilds can reduce MTTR from hours to minutes, minimizing customer impact.
    • Change Failure Rate: What percentage of deployments to production result in a degraded service and require remediation? By improving automated testing and implementing progressive delivery strategies, a consultant should drive this rate down, increasing system reliability.

    These metrics are not just internal engineering vanity stats. A lower Change Failure Rate translates directly to fewer customer support tickets. A shorter Lead Time for Changes means the sales team can promise features that engineering can actually deliver in the same quarter.

    Tracking the Impact on Your Bottom Line

    Beyond engineering metrics, a consultant's work must demonstrably affect financial and business KPIs. This connection is crucial for calculating the full ROI and aligns with the transformative cloud computing business benefits that leadership expects.

    The global DevOps market is projected to reach $86.16 billion by 2034 because companies that master it see real financial gains, saving an average of 30% on infrastructure and cutting deployment times by 60%. For more details, explore these DevOps statistics and their impact.

    Track these critical business KPIs:

    1. Reduction in Cloud Spend (TCO): An effective consultant will immediately apply FinOps principles, using IaC to right-size resources, eliminate waste, and leverage cost-saving plans. Monitor your monthly Total Cost of Ownership (TCO); you should see a measurable decrease in your cloud bill.
    2. Improved Developer Productivity: Measure the time developers spend on operational toil versus feature development. By automating infrastructure provisioning, deployments, and testing, a consultant frees up expensive engineering hours to be spent on innovation, not maintenance.
    3. Increased System Uptime and SLO Adherence: Track your Service Level Objectives (SLOs) and overall system availability. Every minute of downtime has a direct revenue or reputational cost. A consultant's work on system resilience and automated recovery directly translates into higher availability and customer satisfaction.

    Frequently Asked Questions

    Engaging an external expert often raises important questions for technical leadership. Here are answers to the most common queries CTOs and engineering managers have when considering a cloud DevOps consultant.

    What Is the Typical Engagement Length for a Consultant?

    Engagement length is directly tied to project scope. Most engagements fall into predictable timeframes:

    • 30 to 90 days: For highly focused projects with a clear scope, such as building a specific CI/CD pipeline, performing a cloud cost optimization audit, or migrating a single application to Terraform.
    • 3 to 6 months: For more substantial platform builds, like a complete migration to Kubernetes or the implementation of a comprehensive observability stack from the ground up.
    • Ongoing (Fractional): For organizations requiring continuous strategic guidance through a complex, multi-year digital transformation, a long-term, part-time advisory role is common.

    How Should We Onboard a Cloud DevOps Consultant?

    Onboard them as you would a new senior staff engineer: with speed and trust. The objective is to empower them to be productive immediately.

    The most common mistake is restricting a consultant's access due to misplaced caution, which only delays their ability to diagnose and deliver. On day one, grant them read-only access to your cloud accounts, source code repositories, and observability tools. This allows them to begin discovery and architectural analysis independently.

    A streamlined onboarding checklist includes:

    • System Access: Provision access to all relevant platforms (cloud provider, Git, CI/CD tools, project management).
    • Documentation Review: Provide direct links to architecture diagrams, existing runbooks, and recent post-mortems.
    • Key Introductions: Schedule brief meetings with key technical leads, product managers, and other stakeholders they will be collaborating with.

    What Differentiates a Great Consultant from a Good One?

    A good consultant executes the tasks assigned. A great cloud DevOps consultant operates as a strategic partner. They proactively identify underlying systemic problems you didn't know you had and connect every technical decision to a business objective.

    They don't just build a CI/CD pipeline; they analyze why the current release process is slow and articulate how improving it will accelerate time-to-market and reduce developer burnout. Great consultants are exceptional systems thinkers and communicators. Most importantly, they focus on knowledge transfer, aiming to upskill your team and build durable, automated systems that reduce long-term dependency. Their primary goal is to make themselves obsolete.


    At OpsMoon, we connect you with the top 0.7% of global DevOps talent to build the resilient, scalable systems your business needs. Start with a free work planning session to map out your technical roadmap and get matched with an expert who can deliver. Learn more about our DevOps services at OpsMoon.