Your logging bill usually starts as a footnote and ends up as an architecture decision.
A team launches with whatever ships fastest. Logs go to Elasticsearch because everyone knows ELK, or to Loki because it fits the Grafana stack already in place. Then the platform grows. Kubernetes adds churn. More services mean more log volume, more retention pressure, and more engineers asking harder questions of the data. At that point, loki vs elasticsearch stops being a tooling debate and becomes a decision about operating cost, debugging speed, and what kind of investigations your team needs to run.
I’ve seen teams make the wrong choice in both directions. Some overbuy Elasticsearch and spend too much money indexing log data they rarely search thoroughly. Others adopt Loki, then discover they needed flexible full-text investigation for security, audit, or support escalations. The right answer depends less on feature checklists and more on the shape of your incidents, your team’s habits, and how much operational complexity you’re willing to carry.
Choosing Your Logging Philosophy
A CTO usually feels this problem before the engineering team names it. Log volume rises, retention gets negotiated every quarter, and somebody asks why the observability stack costs so much when most queries are still “show me errors from this service in this namespace.”
That’s the fork in the road.

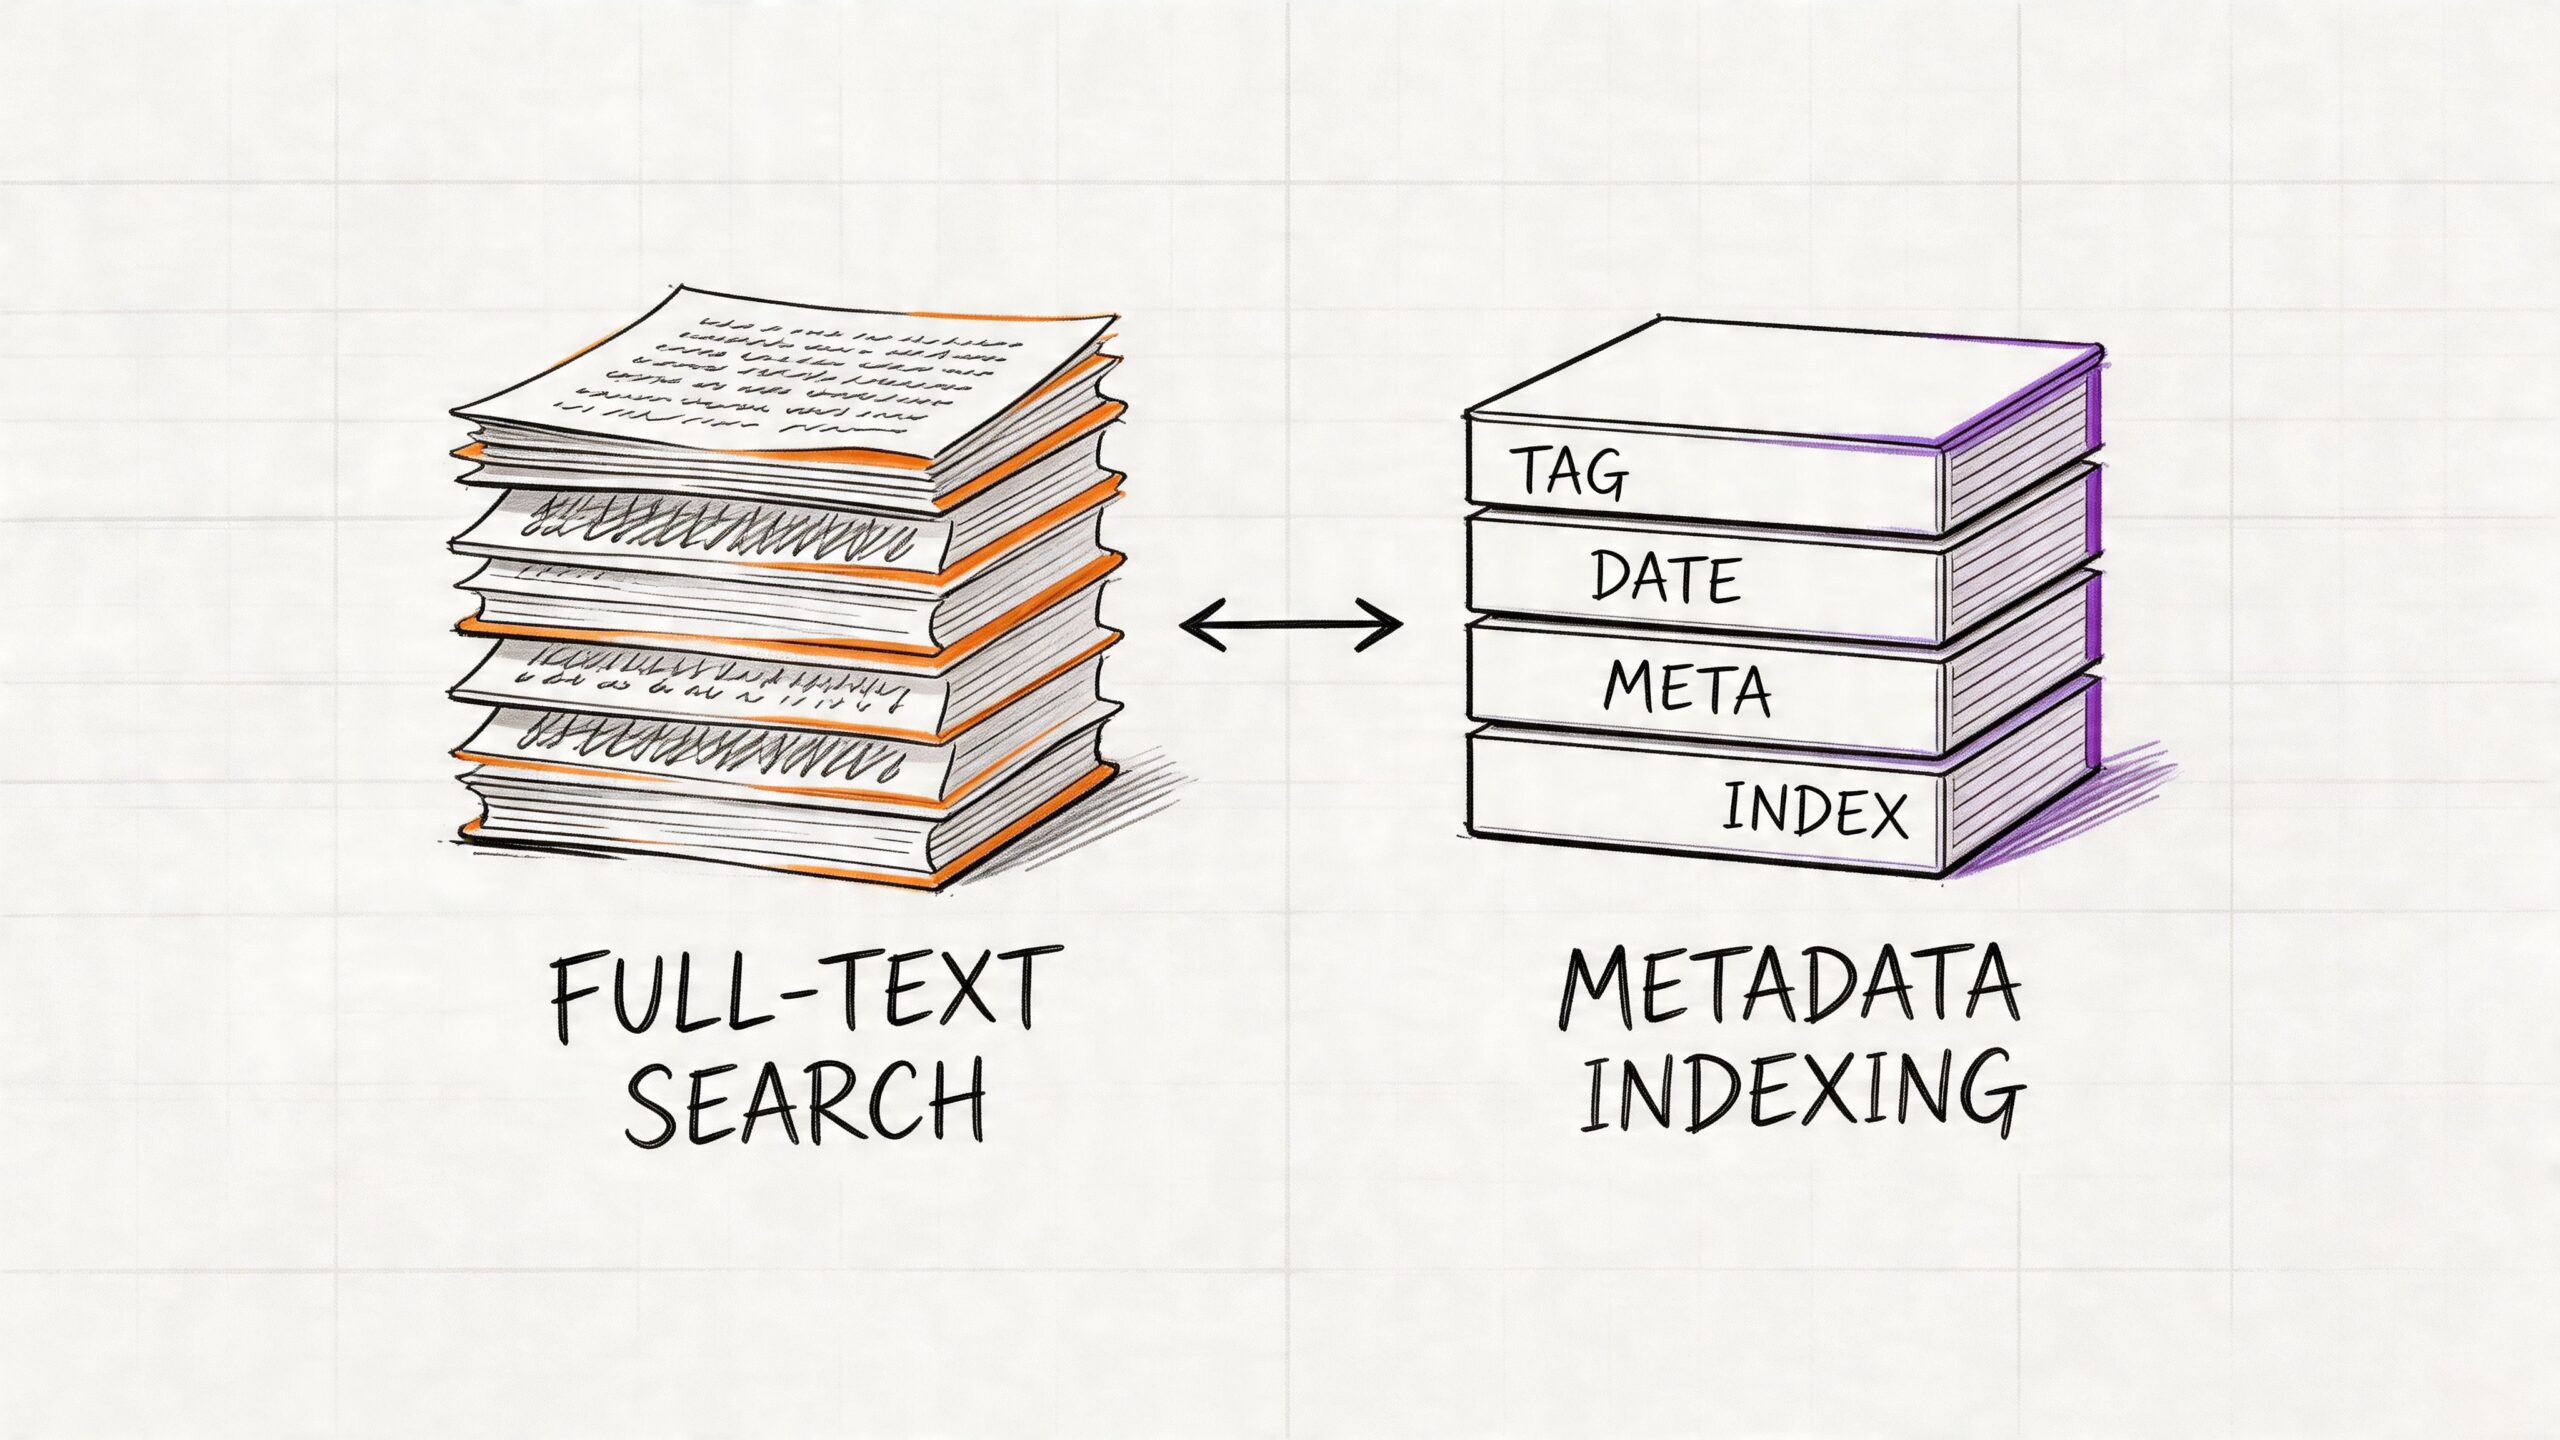
Loki is the lean option. It was built for cloud-native environments and follows a simple idea: index the metadata you already trust, then scan the matching log lines when you need details. Elasticsearch takes the opposite position. It indexes the content of every log line so you can search broadly, aggregate thoroughly, and ask questions you didn’t predict in advance.
That difference changes everything downstream:
| Decision area | Loki | Elasticsearch |
|---|---|---|
| Logging philosophy | Index metadata, scan content later | Index content up front |
| Best fit | Operational troubleshooting | Search-heavy investigation and analytics |
| Cost profile | Lower infrastructure pressure | Higher storage and compute pressure |
| Team experience | Simpler for Grafana and Kubernetes users | Stronger for teams used to ELK and Kibana |
| Trade-off | Cheap ingestion, weaker arbitrary search | Expensive ingestion, powerful arbitrary search |
If your team mostly debugs by service name, namespace, pod, cluster, environment, and time range, Loki is often enough. If engineers or analysts regularly need to search for unknown strings across raw logs, Elasticsearch earns its cost.
A lot of logging mistakes come from skipping the policy conversation. Before picking a backend, define what your logs are for. Operational debugging, compliance evidence, security forensics, product analytics, and support investigation don't stress a system in the same way. A solid set of log management best practices matters more than a flashy feature matrix.
Working rule: Choose the system that matches your dominant query pattern, not the most impressive demo.
Core Architecture Indexing Models
The biggest difference in loki vs elasticsearch is the indexing model. Everything else, cost, scale behavior, query style, and operational pain, follows from that one design choice.
How Elasticsearch thinks about logs
Elasticsearch treats logs as searchable documents. It tokenizes content and builds inverted indexes so it can answer free-text and field-based queries quickly. That’s why Kibana feels powerful during investigations. You can search by error fragments, user identifiers, stack trace tokens, request payload hints, and structured fields without planning every question in advance.
The price of that flexibility is paid during ingestion and storage. According to this comparison of log architectures and benchmarks, Elasticsearch’s storage costs can be up to 10x greater than Loki’s because it indexes all fields, and for 100GB/day of raw logs it can generate about 150GB of indexed overhead, rising to about 500GB/day with replication, or 15TB monthly.
That’s not just disk. It’s also CPU for indexing, memory for segment management and caches, JVM tuning, shard planning, and all the side effects that appear when ingestion spikes.
How Loki thinks about logs
Loki starts from a narrower assumption. Most operators already know the source of the problem at a metadata level. They know the cluster, namespace, app, job, pod, or environment. So Loki indexes only labels and stores log bodies in compressed chunks. The log line itself is not fully indexed.
Grafana Labs launched Loki in 2018, and its label-only design is the core reason it can be lighter than Elasticsearch. In the benchmark summary published in this analysis of Elasticsearch, Loki, and VictoriaLogs, Loki requires up to 10x less storage space and 10x less RAM than Elasticsearch for equivalent log volumes because it avoids building full-text indexes on log content.
That design feels natural in Kubernetes because labels already describe the thing you care about. You rarely begin an incident with “search every log in the company for an unknown phrase.” You usually begin with “production checkout pods started failing after deployment.”
Elasticsearch is like digitizing every page in a library so every word is instantly searchable. Loki is like maintaining an excellent catalog that tells you which shelf to inspect before you start reading.
Why architecture changes team behavior
Often, teams find themselves surprised. The backend doesn’t just store logs. It trains engineers how to debug.
With Elasticsearch, engineers get comfortable asking open-ended questions:
- Unknown-string hunting: Search for a token pulled from a support ticket.
- Ad hoc pivots: Start from one field, then branch into others.
- Investigative forensics: Correlate broad text patterns across many sources.
With Loki, engineers become more disciplined about labels:
- Scope first: Narrow by service, namespace, job, cluster, or pod.
- Search second: Grep or parse only within the selected streams.
- Structure matters: Better labels and cleaner JSON logs pay off quickly.
That’s why Loki works best when the platform team enforces sane labels and developers emit structured logs. If labels are messy, missing, or too high-cardinality, the user experience degrades fast. If logs are wildly inconsistent and engineers depend on exploratory search, Elasticsearch is far more forgiving.
The practical architectural takeaway
Ask one blunt question: Do you need content-first search, or source-first search?
If the answer is source-first, Loki usually aligns better with cloud-native operations. If the answer is content-first, Elasticsearch is doing exactly what it was designed to do, and trying to avoid its cost often just shifts the pain somewhere else.
Query Capabilities LogQL vs KQL
The fastest way to understand loki vs elasticsearch is to compare how engineers query them during an incident.
Loki uses LogQL. Elasticsearch is often queried through KQL in Kibana or through the Elasticsearch query DSL. In practice, the difference feels like this: LogQL rewards disciplined filtering by labels first, while Elasticsearch rewards broad search across indexed content.
Common debugging task one
Suppose you need logs from a Kubernetes workload.
In Loki, the query usually starts with labels:
{namespace="production", app="api", pod="api-7f6c9"}
If you want to narrow to errors containing a phrase:
{namespace="production", app="api"} |= "timeout"
In Elasticsearch or Kibana, a comparable query often looks field-oriented:
kubernetes.namespace : "production" and service : "api" and message : "timeout"
Both can handle this kind of scoped debugging well. The difference is what happens after you leave the expected path.
Common debugging task two
Now take a request ID from a support ticket. Maybe it’s present in the log body, maybe it isn’t consistently mapped, maybe it appears in only some services.
Elasticsearch handles this kind of investigation better because the full text is already indexed. You can search for the token directly, then pivot into neighboring fields, dashboards, and aggregations. It’s built for unpredictable questions.
Loki can still work if you first know how to narrow the stream. But if you don’t know which service, pod, or namespace emitted the request ID, the search becomes less elegant. You’re asking Loki to scan content after narrowing by metadata, and if your metadata isn’t helping, the query path gets expensive and awkward.
Common debugging task three
Now calculate an error rate over time.
In Loki, LogQL shines when logs and metrics-style reasoning meet. A query like this is natural:
sum(rate({service="api-server"} |= "error" [5m])) by (service)
That’s one reason teams already comfortable with Prometheus adapt quickly. The mental model feels similar. If your team needs a refresher on that style of query thinking, this guide to Prometheus query language is useful background because LogQL borrows a lot from the same operational mindset.
Elasticsearch can also aggregate and visualize error counts very well, especially when fields are mapped cleanly. But the ergonomics depend more on index design, field types, and how well the ingestion pipeline normalized the data.
Performance trade-offs in practice
The benchmark gap matters most when the query isn't label-centric. In the comparison cited earlier, Loki and Elasticsearch are close on label filters over a one-hour window, around 2s for Loki versus 1s for Elasticsearch, but Elasticsearch is much faster on full-text and regex searches. Full-text completes in 2s versus Loki’s 10s, and regex in 5s versus Loki’s 15s in the referenced benchmark summary already discussed above.
That doesn’t mean Loki is “slow.” It means Loki is optimized for a different query contract. If you use it as intended, with good labels and scoped searches, it feels efficient. If you treat it like a search engine across all text, it feels constrained.
Practical rule: If your incident workflow begins with “which service or namespace?” Loki fits. If it begins with “search everything for this weird string,” Elasticsearch fits.
Where each query model breaks down
Loki struggles when teams do any of the following:
- Promote volatile fields to labels: user IDs, session IDs, request IDs, and highly unique values can create painful cardinality problems.
- Expect unlimited ad hoc search: that isn’t the design center.
- Store sloppy logs: poor structure forces more content scanning.
Elasticsearch struggles in a different way:
- Over-index everything: teams often map too much and pay for it later.
- Ignore lifecycle policies: old hot indexes become a tax.
- Understaff operations: cluster tuning is real work.
So the query comparison isn’t just LogQL vs KQL. It’s disciplined metadata-driven operations vs broad search-first exploration.
Performance Scaling and Operational Cost
This is where most decisions get made. Not in a demo. In the monthly bill, the node pressure, and the amount of senior engineer time required to keep the platform healthy.
What the benchmark numbers actually mean
On ingestion, Loki has a clear advantage in the benchmark data. In the cited three-node benchmark from the earlier architecture source, Loki reached 500K lines/sec and 250MB/sec, while Elasticsearch reached 200K lines/sec and 100MB/sec. The same comparison reports lower CPU and memory usage for Loki during ingestion.
That maps cleanly to real-world operations. Loki does less work on write because it indexes labels rather than the full content of every log line. Elasticsearch pays the indexing cost up front.
Here’s the simple summary:
| Operational area | Loki | Elasticsearch |
|---|---|---|
| Ingestion path | Lightweight | Heavier due to full-text indexing |
| Scaling style | Add query and ingest components horizontally | Scale cluster carefully, manage shards and roles |
| Storage growth | Leaner | Grows quickly with indexing and replicas |
| Team overhead | Lower for many cloud-native teams | Higher, especially at scale |

Why Elasticsearch gets expensive fast
Elasticsearch is not wasteful by accident. It spends resources to give you powerful retrieval later. But teams need to understand where the bill comes from.
You pay for:
- Indexing overhead: Full-text and field indexing expand the data footprint substantially.
- Replication: Necessary for resilience, but it multiplies storage.
- Hot storage expectations: Fast search usually means faster disks and more memory pressure.
- Cluster tuning labor: Shards, mappings, lifecycle policies, ingest pipelines, heap sizing, and node roles all need attention.
The verified benchmark and storage example discussed earlier is enough to make the point. At 100GB/day of raw logs, Elasticsearch can end up around 500GB/day with replication, or about 15TB monthly, according to the linked comparison already cited above.
The biggest hidden Elasticsearch cost isn't just infrastructure. It's the engineering time spent preventing a good search platform from becoming a fragile one.
Why Loki tends to scale with less drama
Loki’s operational appeal is its component model. Distributors, ingesters, queriers, and related services can be scaled independently. In Kubernetes, that’s a good fit for teams already comfortable with horizontal scaling and object storage backends. When query load rises, you can add query capacity without rethinking the whole cluster shape.
That doesn’t mean Loki is maintenance-free. You still need retention policy discipline, storage planning, tenancy decisions, and careful label design. But the failure modes are usually easier to reason about than a search cluster with too many shards and uneven node pressure.
What works well and what doesn't
Loki works well when
- Your logs are operational first: app logs, container stdout, platform events, deployment debugging.
- You already use Grafana and Prometheus: correlation gets simpler.
- You have high volume but not constant deep search: cheap retention matters more than universal indexing.
- Your labels are stable: service, namespace, cluster, environment, job.
Loki works poorly when
- Every investigation is exploratory: support, fraud, or security teams often ask questions with weak metadata context.
- Developers abuse labels: high-cardinality labels can cause pain quickly.
- You need rich, search-first analytics: that’s not Loki’s center of gravity.
Elasticsearch works well when
- Search flexibility matters more than ingest efficiency.
- You need broad forensic analysis across heterogeneous logs.
- You can invest in index design and cluster operations.
- You have teams who actively use Kibana’s deeper capabilities.
Elasticsearch works poorly when
- Budgets are tight and retention is long.
- No one owns the cluster operationally.
- You mainly filter by service, namespace, and time range anyway.
A cost model that CTOs should use
Don’t compare only software capabilities. Compare all four cost layers:
Write cost
How expensive is ingestion in CPU, memory, and storage amplification?Read cost
What queries are common, and how expensive are they when your team is under pressure?Retention cost
How much historical data do you keep hot, searchable, and replicated?Human cost
Who is on the hook when shards drift, indexes bloat, or labels become unmanageable?
If your team is small, your platform is Kubernetes-heavy, and most debugging starts from known metadata, Loki usually wins by a wide margin on total operational burden. If logs are a search product for internal users, not just an SRE utility, Elasticsearch often justifies itself.
The Broader Ecosystem and Integrations
A logging backend never lives alone. What matters day to day is the stack around it, the workflow it creates, and how many extra systems your team has to hold in its head.

Grafana stack versus ELK stack
Loki fits naturally with Grafana. That matters more than many teams expect. When metrics, logs, and traces live in the same operator workflow, engineers move faster during incidents. Jumping from a Prometheus spike to the relevant Loki stream inside Grafana is a cleaner experience than stitching together separate tools.
The classic Elasticsearch stack is broader and heavier. Elasticsearch usually sits with Kibana and an ingestion layer such as Logstash or Beats. That gives you strong parsing, mature dashboards, and more room for advanced transformations. It also means more moving parts, more configuration surfaces, and more ownership questions.
A practical split looks like this:
| Ecosystem area | Loki stack | Elasticsearch stack |
|---|---|---|
| Main visualization | Grafana | Kibana |
| Typical ingestion path | Promtail or compatible agents | Logstash, Beats, or other shippers |
| Best operator experience | Unified observability workflows | Rich search and dashboard workflows |
| Operational feel | Lean and cloud-native | Feature-rich and platform-like |
Security and tenancy considerations
Loki’s model is straightforward and usually enough for teams separating tenants or environments at a practical level. Elasticsearch offers a more expansive security and access-control model, which matters in regulated environments or when many teams need carefully scoped access.
That’s one reason platform teams sometimes standardize on Loki while security teams keep Elasticsearch. The need isn’t identical. App teams want fast troubleshooting. Security and audit teams often need broader searchability, retention control, and more granular policy design.
Integration strategy matters more than brand loyalty
Some teams force everything into one stack because they want consistency. That’s understandable, but it’s often a mistake. Logging systems should fit the use case, not the procurement story.
If you’re evaluating how logs fit into a wider observability platform, this overview of an open source observability platform is a useful way to think beyond logging alone. You want the logging choice to support your telemetry workflow, not distort it.
For teams comparing wider analytics approaches, it’s also worth reviewing how a Log Analytics Workspace frames centralized search and analysis requirements. That perspective is helpful when you’re deciding whether your logging layer is mostly an operations tool or part of a larger analytical surface for multiple stakeholders.
A stack that looks coherent on a slide can still be awkward in production if the query habits, access model, and ownership boundaries don't line up.
Decision Checklist and Real-World Scenarios
A philosophical answer is rarely what's sought. What's needed is a recommendation defensible in a planning meeting.

Scenario one
A startup is running microservices on Kubernetes. The platform team is small. They already use Grafana and Prometheus. Most incidents involve deployments, pod churn, timeouts, and application errors. They need logs tied closely to service metadata and they care a lot about keeping infrastructure lean.
Choose Loki.
This is the cleanest Loki use case. The team benefits from label-based filtering, simple scale-out behavior, and lower operational load. Elasticsearch would give them more search power, but they probably won’t use enough of it to justify the spend and maintenance.
Scenario two
A mid-sized SaaS company has multiple engineering squads, customer support escalations, and compliance pressure. They need to search for user-specific identifiers, audit activity across systems, and investigate unpredictable production issues. They have enough scale that logs are useful to more than just SREs.
Choose Elasticsearch, or split the workload.
Full-text indexing begins to show its worth. Support, security, and platform teams often ask different questions of the same data. If those questions are unpredictable and span many systems, Elasticsearch is the safer primary platform.
Scenario three
A larger organization has both high-volume Kubernetes workloads and specialized forensic or compliance use cases. Their app teams want simple operational logging, but other teams need richer search and analysis on selected streams.
Use both.
That pattern works well when teams are disciplined about log routing. Send high-volume application and cluster logs to Loki. Route security-relevant, audit-heavy, or investigation-heavy sources to Elasticsearch. Don’t pretend one backend must do every job equally well.
A fast decision checklist
Use this checklist in order. If you answer “yes” early, it should influence the final choice heavily.
- Do engineers often search for unknown strings across all logs? If yes, Elasticsearch is the stronger fit.
- Do most incidents start from known metadata like service, namespace, cluster, or pod? If yes, Loki aligns well.
- Is your team already invested in Grafana-centric observability? Loki gets easier to adopt and operate.
- Do you have staff who can own index tuning, lifecycle policies, and cluster management? If no, be careful with Elasticsearch.
- Are audit, forensic, or support investigations a major consumer of logs? Elasticsearch usually earns its place.
- Is storage growth a constant budget problem? Loki is often the more forgiving option.
- Do developers produce consistent structured logs and sane labels? Loki benefits directly from that discipline.
- Do you need one tool for every possible stakeholder? Elasticsearch is broader, but broader also means heavier.
For a wider market scan before making a final call, a curated roundup of best log management solutions can be useful. It helps benchmark Loki and Elasticsearch against adjacent options, especially if your actual need blends observability, SIEM, and analytics.
Migration and coexistence
The smartest migrations are usually selective, not ideological.
A practical approach looks like this:
- Keep current Elasticsearch workloads that require full-text search.
- Move Kubernetes application logs and platform noise to Loki first.
- Standardize labels and structured logging before expanding Loki.
- Measure query behavior, not just storage savings.
- Leave security and audit pipelines in Elasticsearch if those users depend on it.
If your team wants a visual walkthrough of the trade-offs before redesigning the stack, this overview is worth a few minutes:
The wrong logging platform isn't the one with fewer features. It's the one that forces your team to debug in a way that doesn't match reality.
Loki vs Elasticsearch Frequently Asked Questions
Is Loki enough for production logging
Yes, if your production workflow is mostly operational troubleshooting and your labels are well designed. Loki is strong when engineers already know the system boundary they need to inspect. It’s weaker when they need broad exploratory search across unknown data.
Does Elasticsearch always mean overkill
No. Elasticsearch is expensive when teams use it as a default sink for everything and don’t exploit its search power. It’s justified when logs support forensic, compliance, support, or analytics-heavy workflows that depend on content-first search.
Can Loki and Elasticsearch run side by side
Yes, and many mature teams should consider that. It’s often the most honest architecture. Use Loki where low-cost, high-volume, metadata-driven logging fits. Use Elasticsearch where full-text investigation and richer analytics are necessary.
How should teams think about high-cardinality labels in Loki
Treat labels as stable descriptors of the source, not unique identifiers of each event. Good labels include service, namespace, cluster, environment, and similar operational dimensions. Bad labels include highly unique values such as request-specific or user-specific identifiers that explode the number of streams.
A simple rule works well: if a field changes constantly per event, it probably belongs in the log body, not as a label.
What about structured JSON logs
Both systems benefit from structured logs, but they use them differently. Elasticsearch can index structured fields thoroughly and make them queryable across many use cases. Loki benefits when structured logs make parsing easier after you’ve already narrowed the stream with labels.
Is migrating from Elasticsearch to Loki difficult
The technical migration is usually easier than the behavioral migration. The primary task is deciding which fields become labels, which logs should stay in Elasticsearch, and how engineers need to adapt their query habits. Teams that skip this design step often end up disappointed, not because Loki failed, but because they expected it to behave like a cheaper Elasticsearch.
Which one should a CTO pick if the team is split
Start from business-critical query patterns. If revenue, compliance, support, or security investigations depend on broad search, protect that capability first. If the main problem is observability cost and operational simplicity in Kubernetes, favor Loki. If both are true, split the workloads instead of forcing a false binary.
If you’re deciding between Loki, Elasticsearch, or a hybrid logging architecture, OpsMoon can help you design it around your actual incident patterns, retention requirements, and team capacity. That’s usually the difference between a logging stack that looks good in diagrams and one your engineers still trust six months later.