A cloud migration company is a specialized partner that plans, executes, and manages the transition of your applications, data, and infrastructure from on-premise data centers to a cloud environment. However, engaging a partner without a detailed, technically-vetted internal plan is a direct path to scope creep, budget overruns, and a suboptimal cloud architecture.
Your success hinges on defining a clear, technically-grounded strategy before vendor engagement.
Defining Your Cloud Migration Strategy Before Vetting Vendors
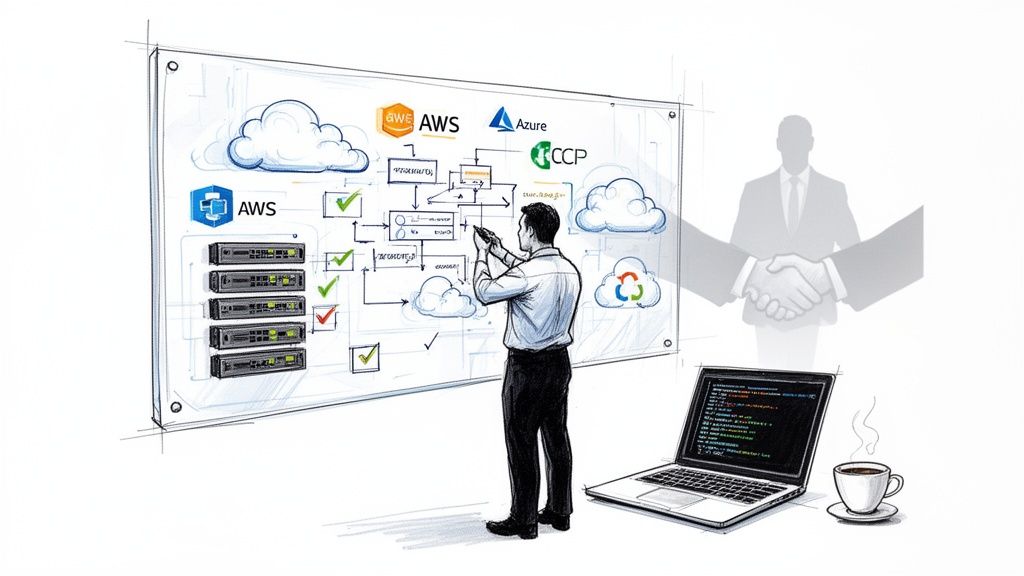
Initiating vendor conversations without a concrete internal strategy is analogous to asking an architect to design a building with no site survey or structural requirements. You will inevitably get a generic solution that fails to meet specific performance, security, and cost-efficiency targets. Before evaluating a single cloud migration company, your technical leadership must define the foundational "why" and "how" of the project with engineering precision.
This requires a meticulous audit of your current infrastructure, mapping out every application, database, API endpoint, and network dependency. It's about establishing quantitative baselines, not just qualitative goals.
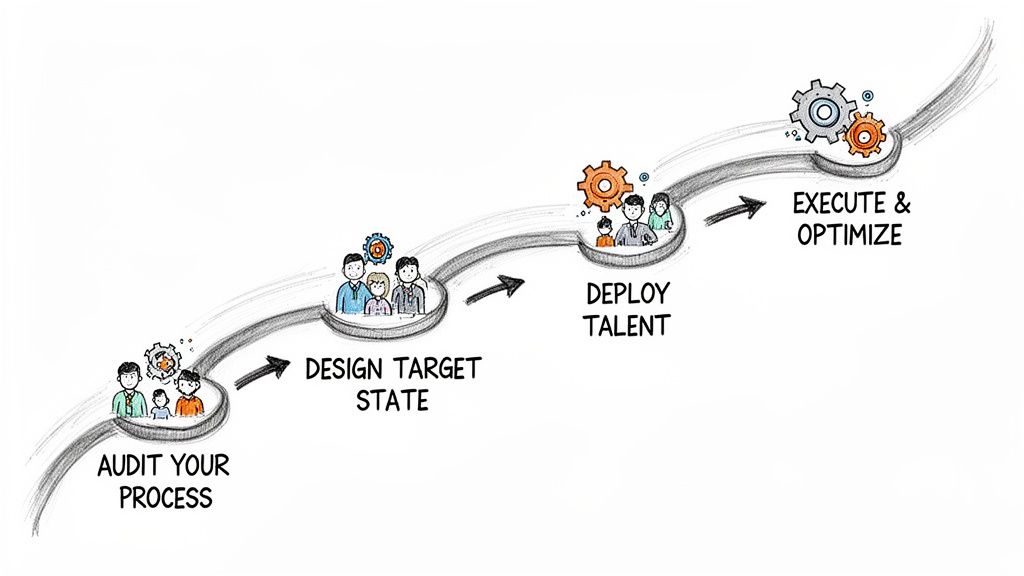
Auditing Your Application Portfolio
First, create a comprehensive inventory of your entire application stack, represented as a dependency graph. This isn't a simple list; it's a map of your system's operational reality.
- Identify Interdependencies: Use tools like network traffic analysis (e.g.,
tcpdump, Wireshark) or application performance monitoring (APM) agents to map all inbound and outbound connections for each service. Document API contracts, database call patterns, and message queue interactions. Misunderstanding these dependencies is a primary cause of failure during phased migrations. - Analyze Performance Baselines: Collect and document hard metrics. This includes P95/P99 latency, requests per second (RPS), CPU/memory utilization under peak load, and I/O operations per second (IOPS) for databases and storage systems. This data is non-negotiable for defining quantifiable success criteria post-migration.
- Evaluate Technical Debt: Conduct a rigorous architectural assessment. Is the application a tightly-coupled monolith with a single database schema, or is it composed of containerized microservices adhering to principles like the 12-Factor App? Quantify the debt; for example, estimate the engineering effort required to decouple a specific module.
This technical audit directly informs your migration strategy. A legacy monolith might be a candidate for a "lift-and-shift" (Rehost) to escape a data center lease, but a critical, high-growth microservice will require a full "refactoring" to leverage cloud-native services like managed Kubernetes (EKS, AKS, GKE) and serverless functions (Lambda, Azure Functions). There are numerous cloud migration solutions, each with specific technical trade-offs.
Translating Business Goals into Technical Outcomes
Once you understand the technical state of your portfolio, you must translate high-level business objectives into specific, measurable, achievable, relevant, and time-bound (SMART) technical outcomes. Vague goals are useless for engineering execution.
Here are actionable examples:
Instead of: "We need better performance."
Specify: "Reduce P95 latency for the
/api/v1/checkoutendpoint from 250ms to under 100ms by migrating the backing PostgreSQL database to a provisioned IOPS RDS instance and implementing a Redis caching layer."Instead of: "Lower our operational costs."
Specify: "Reduce monthly EC2 spend for the data processing workload by 20% within Q3 by re-architecting the application to run on Graviton-based instances and leveraging EC2 Spot Instances for fault-tolerant batch jobs."
This level of precision is mandatory. A successful migration hinges on having a clear cloud migration strategy blueprint from the outset. This strategic shift is why the US cloud migration market is projected to hit $4.8 billion in 2025, growing at a CAGR of 22.1% through 2035. Companies are pursuing concrete technical advantages, not just abstract benefits. You can find more insights on US cloud migration market trends on omrglobal.com.
By front-loading this strategic work, you completely reframe the conversation with potential partners. You are no longer asking for a solution; you are evaluating their technical capability to execute your well-defined architectural vision.
Choosing the Right Migration Path for Each Workload
A uniform migration strategy is a fast track to wasted capital and missed engineering opportunities. Successful projects segment their application portfolio and assign the optimal migration path to each workload based on its technical characteristics and business criticality. This approach maximizes ROI by aligning technical effort with business value.
The first step isn't selecting a cloud provider; it's defining your strategy per workload.

This decision tree correctly illustrates that tactical choices without a clear "why" lead to technically flawed and expensive projects.
Market data supports this granular approach. The global public cloud migration services market is projected to hit $148.12 billion by 2025. While basic application migration holds a 36.7% share, refactoring is growing at a 19.4% CAGR. This signifies a market shift from simple rehosting to strategic re-architecture to unlock true cloud capabilities. You can see more on these public cloud migration market trends for yourself.
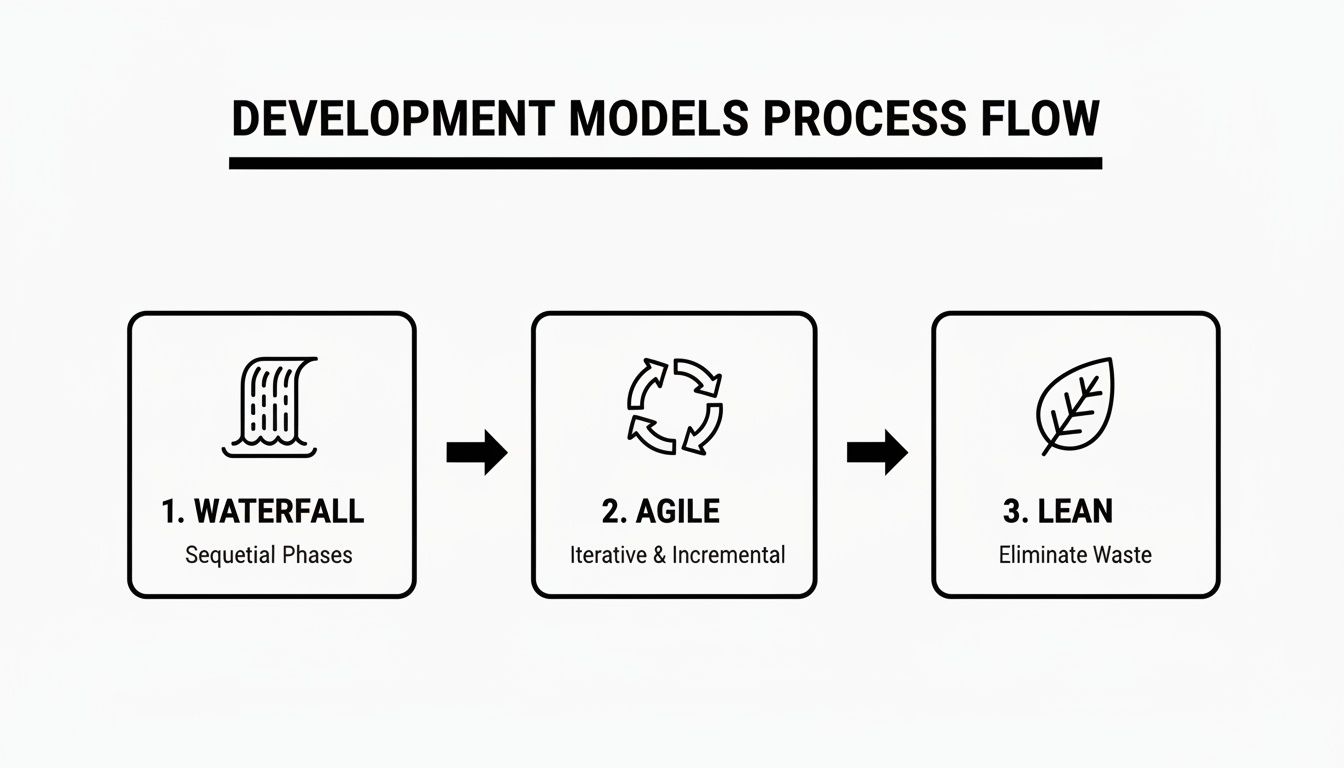
Let's dissect the three core technical strategies.
Comparing Cloud Migration Strategies
Choosing the optimal path requires weighing the technical trade-offs of each approach against the specific needs of an application. This table provides a side-by-side comparison to guide your decision-making process.
| Strategy | Description | Best For | Key Benefit | Primary Risk |
|---|---|---|---|---|
| Rehost (Lift-and-Shift) | Migrating an application as a virtual machine (VM) or container with no code changes. Essentially, infrastructure emulation in the cloud. | Legacy monolithic systems, COTS applications, or urgent data center evacuations where refactoring is not feasible. | High velocity, low upfront engineering effort. | Inefficient resource utilization (no auto-scaling), high long-term operational costs, and inherits existing technical debt. |
| Replatform (Lift-and-Reshape) | Making targeted architectural modifications, such as replacing a self-managed database with a managed cloud service (e.g., RDS, Cloud SQL). | Stable applications that can benefit from offloading operational tasks (backups, patching, HA) without a full rewrite. | Reduced operational overhead and improved reliability via managed services. | Can introduce subtle compatibility issues or performance bottlenecks if not thoroughly tested. |
| Refactor (Re-architect) | Re-architecting an application to be fully cloud-native, typically by decomposing a monolith into microservices running on containers or serverless platforms. | Core, high-value applications where scalability, resilience, and development velocity are critical business drivers. | Maximum scalability, resilience through fault isolation, and CI/CD acceleration. | High upfront investment in engineering, requires deep cloud-native expertise, and introduces architectural complexity. |
Each strategy has a distinct technical purpose. The key is applying them judiciously across your portfolio.
The "Lift-and-Shift" or Rehosting Path
Rehosting, or "lift-and-shift," involves migrating an application's components—VMs, data, configuration—to a cloud provider like AWS or Azure with minimal modification. The underlying code and architecture remain unchanged.
This strategy prioritizes migration velocity, making it ideal for:
- Legacy Systems: Monolithic applications with brittle codebases that are too risky to modify.
- Off-the-Shelf Software: Commercial applications where you lack access to the source code.
- Rapid Data Center Exits: When a hard deadline necessitates vacating a physical facility.
The trade-off for this speed is a lack of cloud optimization. Rehosted applications cannot leverage cloud-native features like auto-scaling or serverless compute, often resulting in overprovisioned resources and higher-than-expected cloud bills.
The "Replatform" or "Lift-and-Reshape" Path
Replatforming is a pragmatic middle ground involving targeted modernizations during the migration process. It's about making smart, high-impact changes without a full rewrite.
A classic example is migrating a self-managed PostgreSQL database running on a VM to a managed service like Amazon RDS or Azure Database for PostgreSQL.
By replacing a single self-managed component with a managed service, you offload critical operational burdens such as OS patching, database backups, replication for high availability, and point-in-time recovery. This single change can significantly reduce operational toil and improve the application's overall reliability.
Replatforming is an excellent fit for applications that are functionally stable but can benefit from the operational efficiencies of specific cloud services.
The "Refactor" or "Re-architect" Path
Refactoring is the most intensive—and potentially transformative—strategy. It involves fundamentally re-architecting an application to be cloud-native, often by decomposing a monolith into a collection of independent, containerized microservices. For a deeper dive, explore what constitutes a workload in cloud computing in our detailed guide.
This is the path to unlocking the full technical advantages of the cloud:
- Maximum Scalability: Services scale independently based on demand, optimizing resource consumption.
- Improved Resilience: Fault isolation prevents a failure in one microservice from cascading and causing a total system outage.
- Faster Development Cycles: Autonomous teams can develop, test, and deploy their services independently, accelerating release velocity.
Refactoring requires a significant upfront investment and is best reserved for core, business-critical applications where the long-term benefits of agility and scalability justify the engineering effort. This is where a technically proficient cloud migration company provides immense value—guiding architectural decisions and implementing a robust, future-proof system.
A Technical Due Diligence Checklist for Vetting Partners
Case studies and sales presentations are insufficient for evaluating a partner's technical competence. Your engineering leadership must conduct a rigorous technical due diligence process to differentiate true cloud-native experts from legacy consultants.
Your objective is to assess their hands-on ability to build a secure, resilient, and automated cloud environment that adheres to modern engineering principles.

Infrastructure as Code (IaC) Proficiency
In a modern cloud environment, infrastructure is defined, provisioned, and managed through code. This is a non-negotiable requirement. Any credible partner must demonstrate deep, production-level expertise with Infrastructure as Code (IaC) tools.
Do not accept a simple "yes" when asking if they use Terraform or Pulumi. Probe their methodology.
- Module Strategy: "Show us an example of a reusable Terraform module you've built. How do you handle versioning and variable exposure to enforce standardization across environments?"
- State Management: "Describe your strategy for managing Terraform state in a multi-engineer team. What remote backend do you prefer and why? How do you implement state locking to prevent race conditions?"
- Testing and Validation: "Walk us through your CI/CD pipeline for IaC. What static analysis (e.g.,
tflint,checkov), validation (terraform validate), and planning (terraform plan) steps do you enforce before applying changes?"
A partner who advocates for manual configuration via a web console for anything other than a break-glass emergency is a significant red flag. They must operate with a "code-first" mentality.
Kubernetes and Container Orchestration Expertise
If containerization is on your roadmap, your partner's Kubernetes expertise is critical. Container orchestration is a complex domain that extends far beyond kubectl apply. It involves deep knowledge of networking, security, storage, and observability within the Kubernetes ecosystem.
Their answers must demonstrate practical, in-the-weeds experience. For perspective on avoiding common migration pitfalls, this SharePoint Migration Consultant's Real-World Guide offers valuable real-world insights.
Vague claims about "managing containers" are insufficient. A true expert can articulate the trade-offs between different CNI plugins (e.g., Calico vs. Cilium), explain how to configure an Ingress controller for canary deployments, and detail the implementation of a service mesh like Istio or Linkerd for mTLS and traffic management.
Push for specific, technical examples:
- "How have you implemented Kubernetes NetworkPolicies to enforce least-privilege connectivity between pods?"
- "Describe your preferred method for managing secrets within a GitOps workflow using tools like Argo CD or Flux. How do you integrate with a secret store like HashiCorp Vault or AWS Secrets Manager?"
- "Walk us through how you would configure the Kubernetes Horizontal Pod Autoscaler (HPA) to scale based on a custom metric from Prometheus, such as message queue length."
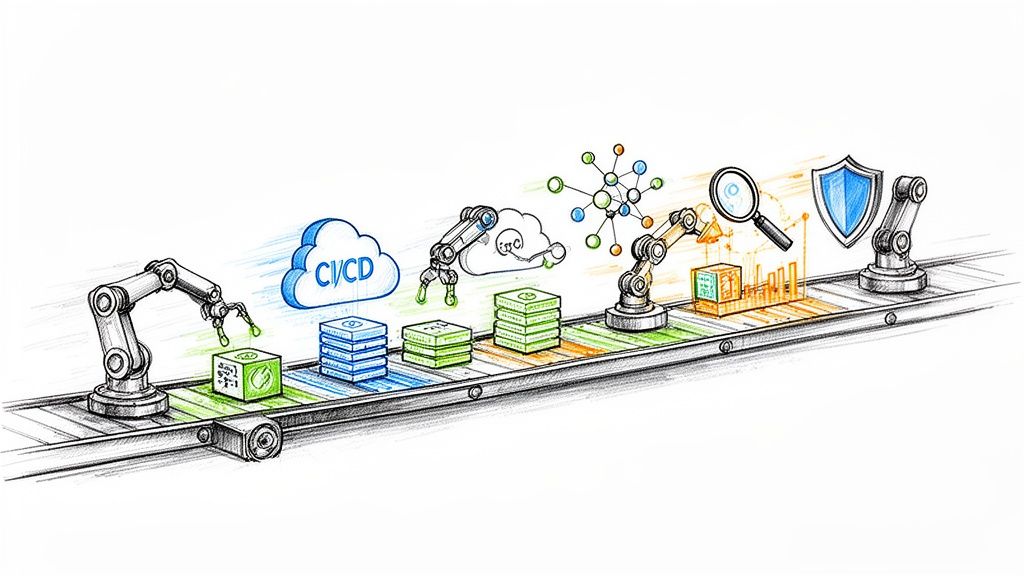
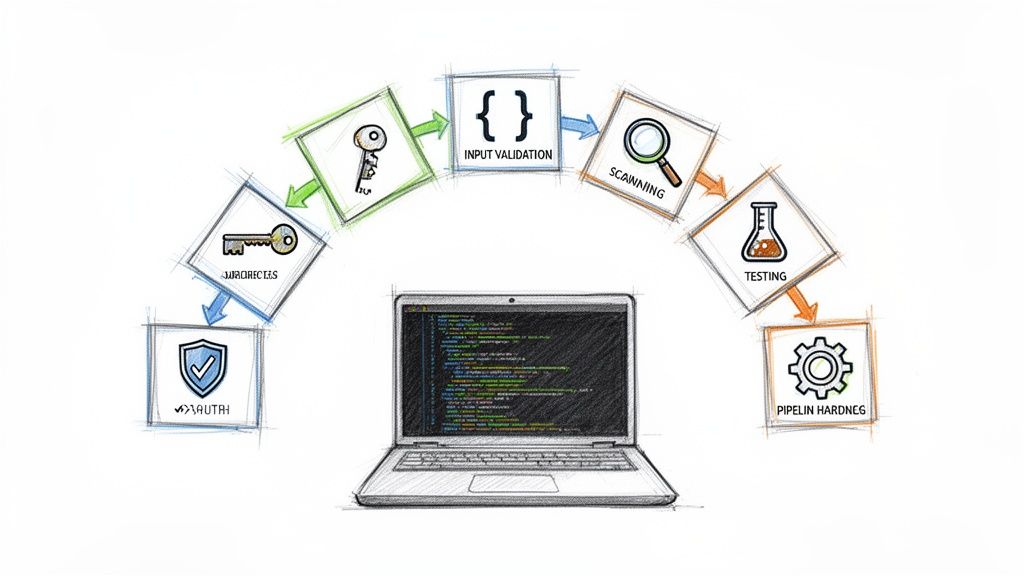
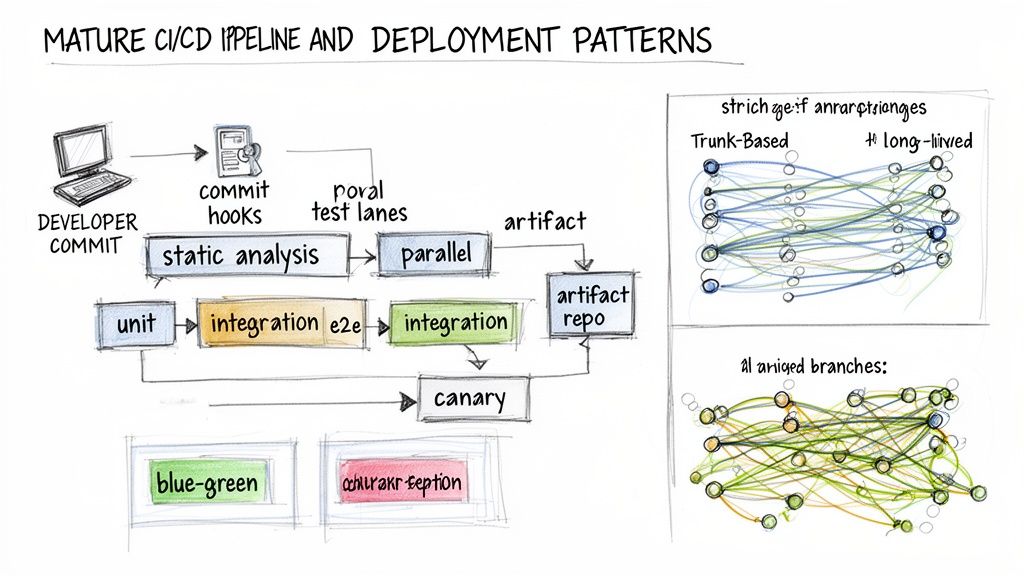
CI/CD and DevSecOps Maturity
A migration partner's responsibility extends beyond infrastructure provisioning; they must establish a secure and efficient pathway for your applications from code commit to production deployment. This requires a mature understanding of CI/CD and DevSecOps principles.
Look for a "shift-left" security mindset, where security controls are automated and integrated early in the development lifecycle. This aligns with modern vendor management best practices by ensuring security is a shared responsibility.
Probing questions for CI/CD:
- "How do you design multi-stage CI/CD pipelines to optimize for fast feedback loops for developers while enforcing quality gates? Provide an example using YAML from a tool like GitLab CI or GitHub Actions."
- "Describe a time you implemented a progressive delivery strategy, such as blue-green or canary deployments, for a critical service. What tools did you use, and how did you automate the promotion and rollback logic?"
Probing questions for DevSecOps:
- "What specific SAST (Static Application Security Testing) and DAST (Dynamic Application Security Testing) tools do you integrate into your pipelines, and at which stages?"
- "How do you implement container image vulnerability scanning and enforce policies that prevent images with critical vulnerabilities from being deployed to a registry or cluster?"
- "Show us an example of a least-privilege IAM role designed for a CI/CD pipeline that needs to interact with cloud APIs (e.g., deploying to EKS or S3)."
A top-tier partner will fluently discuss integrating security gates at every stage of the software delivery lifecycle. This is the hallmark of a team that can build a truly secure and compliant cloud environment.
Crafting An Effective RFP And Asking Probing Questions
A generic Request for Proposal (RFP) elicits boilerplate marketing responses that fail to reveal a vendor's true technical depth. To identify a partner capable of executing your specific technical vision, your RFP must be a technical gauntlet, not a feature checklist.
You are not just soliciting bids; you are compelling vendors to demonstrate their engineering methodology, problem-solving skills, and architectural rigor.
Structuring A Technically-Focused RFP
Begin with a concise technical overview of your current environment, including key technologies, performance baselines, and architectural diagrams. Provide the specific, measurable outcomes you defined in your strategy phase.
- Proposed Architecture and Migration Plan: For a representative mission-critical application, require a detailed target-state architecture diagram. Demand justification for the choice of each cloud service (e.g., "Why EKS over ECS? Why Aurora over RDS for PostgreSQL?"). The response must include a phased migration plan detailing data synchronization methods (e.g., CDC with AWS DMS), cutover procedures, and rollback plans.
- Security and Compliance Framework: Require specifics on network architecture, including VPC/VNet design, subnet tiering, security group/NSG rules, and NACLs. Ask for their standard methodology for implementing least-privilege IAM policies and their approach to logging and auditing for compliance.
- Automation and IaC Strategy: Specify that all proposed infrastructure must be defined as code. Ask which toolset (Terraform or Pulumi) they recommend and why. Request a sample code structure for a multi-environment deployment to evaluate their approach to modularity, reusability, and state management.
- Knowledge Transfer and Team Enablement: Prohibit generic training outlines. Require a concrete plan for knowledge transfer, including paired programming sessions, code reviews with your engineers, creation of living documentation (e.g., architecture decision records), and hands-on workshops.
This approach filters out sales-led organizations and elevates engineering-driven partners.
Probing Questions That Reveal True Expertise
The RFP responses narrow the field; the interview is where you confirm technical depth. Use scenario-based questions that simulate real-world challenges.
“Describe how you would design and implement a zero-trust security model for our containerized services running in EKS. Your answer should detail your choice of service mesh, your strategy for enforcing mutual TLS (mTLS) between pods, and how you would implement fine-grained traffic policies using Kubernetes NetworkPolicies or service mesh primitives.”
This single question forces a detailed technical discussion, exposing their real-world experience.
Here are more examples:
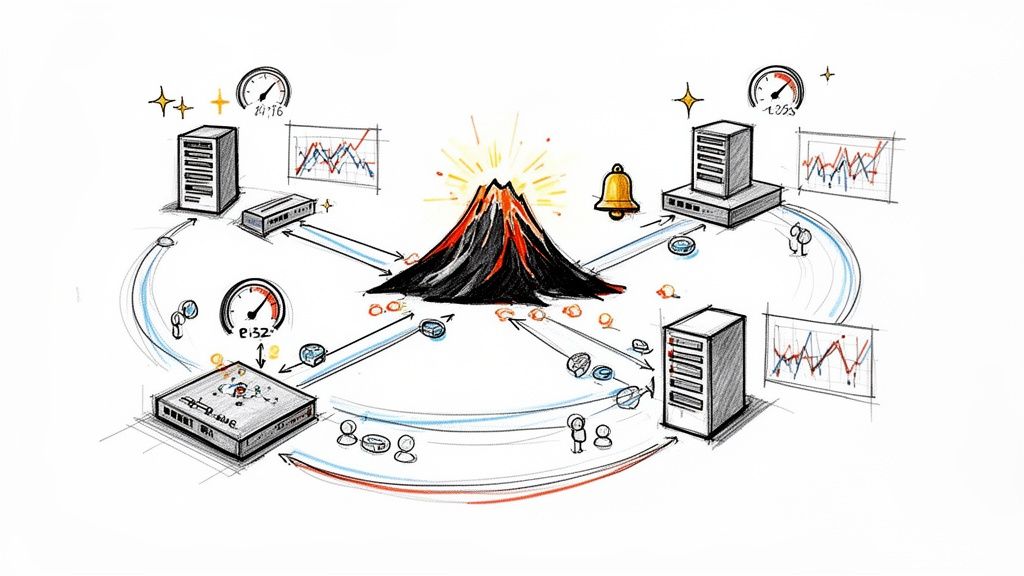
- Incident Response: “A critical service you migrated to EC2 autoscaling groups is exhibiting P99 latency spikes that correlate with scale-up events, but CPU utilization remains below 50%. Walk us through your diagnostic process, step-by-step, including the specific metrics and logs you would analyze.”
- Cost Optimization: “Post-migration, our data egress costs from a specific VPC have exceeded forecasts by 15%. What specific tools and methods would you use to identify the source of the traffic, and what architectural changes (e.g., VPC endpoints, caching strategies) would you propose to mitigate these costs?”
- CI/CD Philosophy: “We are replatforming a stateful legacy application. How would you design a CI/CD pipeline that automates database schema migrations, manages configuration drift between environments, and includes automated rollback procedures for failed deployments?”
These open-ended technical challenges reveal a candidate's problem-solving methodology and depth of knowledge far better than any canned presentation. With the global market for cloud migration services reaching $16.90 billion in 2024, a sharp, technical vetting process is essential. For more data, explore the cloud migration services market trends on Grand View Research.
Executing the First 90 Days of Your Migration Project

You've selected your cloud migration partner. The initial 90 days are the most critical phase of the engagement; they establish the technical foundation, operational cadence, and governance model for the entire project. This period is about translating strategy into executable engineering tasks and building momentum.
A successful start is not measured by the number of VMs migrated. It is measured by the establishment of a robust, automated foundation and clear, collaborative processes that de-risk subsequent, more complex migrations.
Here is a tactical playbook for this critical window.
Weeks 1-2: Deep Dive Workshops and Governance
The first two weeks must be dedicated to intensive, collaborative workshops between your engineering team and the partner's. The objective is to merge your team's deep institutional knowledge of the applications with the partner's cloud architecture expertise.
Establish a formal governance framework immediately. Use a RACI matrix (Responsible, Accountable, Consulted, Informed) to define roles for key decisions like architectural sign-offs, security policy approvals, and budget allocation. This eliminates ambiguity and prevents delays.
Key technical outputs from these workshops should include:
- A Joint Governance Model: Define the technical steering committee, its members, meeting frequency, and the precise escalation path for technical blockers.
- Communication Protocols: Establish a dedicated Slack/Teams channel for real-time collaboration and schedule mandatory, recurring meetings: daily technical stand-ups, weekly architecture reviews, and bi-weekly backlog grooming sessions.
- Initial Backlog Prioritization: Collaboratively groom the initial project backlog, prioritizing foundational tasks such as setting up the cloud organization/landing zone, configuring identity and access management (IAM) with least privilege, and defining the core network topology (VPCs, subnets, routing).
Weeks 3-8: Infrastructure Provisioning and Pilot Migrations
With governance established, the focus shifts to building the foundational cloud environment using the IaC practices you vetted. Your engineers must be actively involved in code reviews of the partner's Terraform or Pulumi modules to ensure they align with your standards for modularity, security, and maintainability.
Execute a pilot migration using a low-risk, yet representative, application. It should involve a database, have external network dependencies, and require a CI/CD pipeline. This pilot serves as a full-stack test of your joint team's processes.
The pilot migration is your early warning system. It will expose incorrect assumptions about dependencies, gaps in the CI/CD pipeline, and flaws in the data migration strategy within a low-stakes context. Document every finding in a blameless post-mortem; these lessons are critical for refining the migration playbook for business-critical workloads.
During this phase, finalize the data synchronization strategy. For the pilot, a logical dump and restore (e.g., pg_dump/pg_restore) might suffice. For production workloads, you must implement and test more sophisticated techniques like Change Data Capture (CDC) using tools like AWS Database Migration Service (DMS) to minimize application downtime during the final cutover.
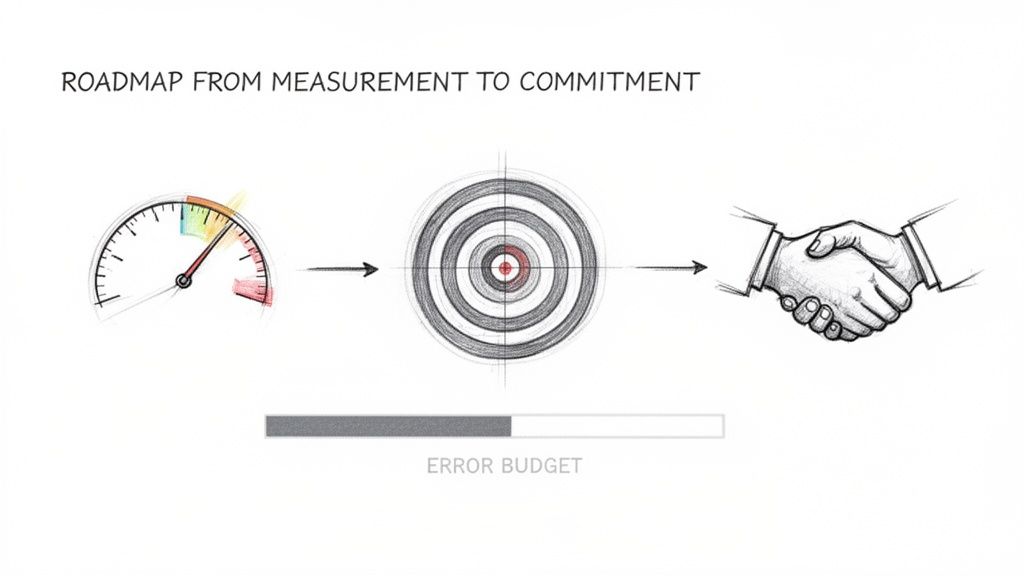
Weeks 9-12: Defining Success and Planning the Cutover
As the pilot concludes, shift focus to quantifying success and planning the first major workload cutover. This requires defining concrete, measurable technical metrics, not just high-level business goals.
Establish clear Service Level Objectives (SLOs) for each migrated application. These are the explicit targets that define acceptable performance and reliability from an engineering perspective.
Example SLOs for a Migrated E-commerce API:
- Availability:
99.9%uptime over a 30-day rolling window, measured by an external probing service. - Latency: The
95th percentile(P95) of API response times for write operations must be under200ms. - Error Rate: The ratio of
5xxserver errors to total requests must be less than0.1%.
These SLOs, instrumented and tracked via an observability platform (e.g., Prometheus, Grafana, Datadog), become the objective measure of the migration's success. Your partner must build this instrumentation as part of the migration process.
Finally, begin detailed cutover planning for the next wave of applications. This involves creating a step-by-step runbook with precise commands, defining clear rollback procedures, and scheduling a formal go/no-go decision meeting with all technical stakeholders.
Common Questions When Hiring a Cloud Migration Company
Even with a rigorous vetting process, critical questions arise during the final selection stage. Answering them with technical clarity is essential for building confidence and ensuring alignment. This is about validating operational realities before signing a contract.
What’s the Biggest Technical Mistake We Can Make?
The single greatest technical mistake is prioritizing low initial migration cost over deep cloud-native automation expertise. A "cheap" migration almost invariably results in a "lift-and-shift" of technical debt, creating a poorly architected cloud environment that is expensive to operate, difficult to scale, and insecure.
This approach trades short-term cost savings for long-term technical debt, security vulnerabilities, and exorbitant operational costs.
Instead, focus your investment on a partner with proven, hands-on expertise in Infrastructure as Code (IaC), mature DevSecOps practices, and a sophisticated approach to observability and cost management.
A superior cloud partner does not simply move VMs. They engineer a resilient, scalable, and cost-optimized cloud foundation that empowers your internal team to innovate. The true ROI lies in this long-term enablement, not in the initial migration cost.
Should We Go With a Big Consultancy or a Specialized Firm?
For most technology-driven organizations, a specialized DevOps and cloud migration firm offers a distinct advantage. The choice is between depth and breadth of expertise.
Large consultancies offer a wide range of services but often lack senior, hands-on engineering talent for complex, cutting-edge projects involving technologies like Kubernetes, service mesh, or advanced serverless architectures. You risk being assigned a junior team that is learning on your project.
A specialized firm's entire business is focused on this domain. This deep focus translates into superior technical outcomes:
- Faster Problem Resolution: They have likely solved your specific technical challenges multiple times for other clients.
- Superior Architectural Design: Their solutions are based on proven, real-world patterns, not just theoretical best practices.
- Higher-Fidelity Knowledge Transfer: They speak the same technical language as your engineers, facilitating a more effective and collaborative partnership.
For a technically complex migration, deep domain expertise is almost always more valuable than the broad, generalist approach of a large consultancy.
How Should We Structure the Contract?
Avoid a single, monolithic fixed-price contract for the entire migration. Such structures are too rigid for complex projects where unforeseen technical challenges are inevitable. A hybrid model provides the best balance of cost predictability and agility.
Consider this structure:
- Phase 1 (Fixed-Price): A fixed-price engagement for the initial discovery, architectural design, and detailed migration planning. This provides a predictable cost for the strategic blueprint.
- Phase 2 (Time-and-Materials with a Cap or Milestone-Based): For the implementation phase, structure payments based on tangible milestones or on a time-and-materials basis with a cap. This allows for agility in addressing technical hurdles while maintaining budget controls.
Ensure the Statement of Work (SOW) is technically precise. It must include explicit acceptance criteria for each milestone, a formal change control process for architectural modifications, and a detailed plan for knowledge transfer, including the delivery of all IaC code, documentation, and hands-on training for your team.
How Much Will Our Engineering Team Need to Be Involved?
Your team's involvement is critical and non-negotiable. A "hand-off" approach where you outsource the project entirely is a recipe for failure.
The migration partner provides specialized cloud expertise and implementation velocity. However, your internal team possesses the invaluable, often undocumented, institutional knowledge of your application's business logic, data models, and operational nuances.
The optimal model is a deeply integrated partnership. Dedicate key engineers to the project to participate directly in:
- Discovery Sessions: They are essential for validating architectural assumptions and identifying hidden dependencies.
- Architectural Reviews and Code Reviews: They must ensure the new cloud architecture aligns with your long-term technical strategy and that the IaC meets your engineering standards.
- User Acceptance Testing (UAT) and Performance Testing: They are the ultimate arbiters of whether the migrated application meets functional and non-functional requirements.
This collaborative model is the only way to ensure a seamless handoff, empowering your team to operate, maintain, and innovate within the new cloud environment from day one.
Ready to build a cloud environment that accelerates your business, not just hosts it? At OpsMoon, we connect you with the top 0.7% of DevOps engineers to build secure, scalable, and automated cloud infrastructure. Start with a free work planning session to map your path to cloud-native success.