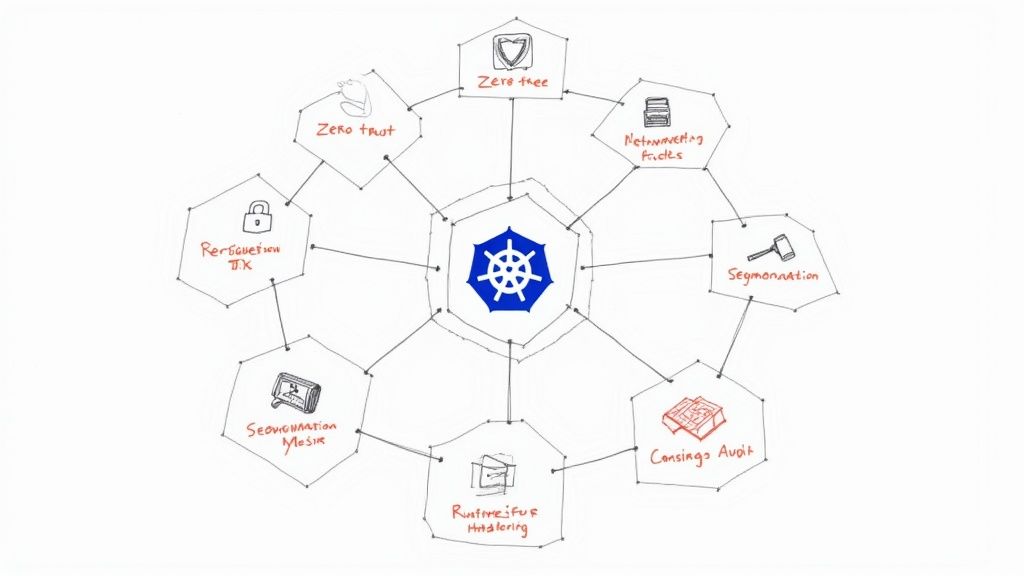
Kubernetes has become the de facto standard for container orchestration, but its flexibility and complexity introduce significant security challenges. Deploying applications is only the first step; ensuring they run securely within a hardened environment is a continuous and critical responsibility. Moving beyond generic advice, this guide provides a technical, actionable roadmap to securing your containerized workloads. We will explore eight critical Kubernetes security best practices, complete with implementation details, code snippets, and real-world examples designed to be put into practice immediately.
This article is built for engineers and technical leaders who need to translate security theory into robust operational reality. We will cover essential strategies that form the foundation of a resilient security posture. You will learn how to:
- Enforce least privilege with granular Role-Based Access Control (RBAC).
- Implement a zero-trust network model using Network Policies.
- Harden the software supply chain with image scanning and Software Bills of Materials (SBOMs).
- Secure cluster components and enable runtime threat detection.
Mastering these concepts is crucial for building resilient, secure, and compliant cloud-native systems. This listicle bypasses the high-level chatter to provide specific, actionable guidance. Let’s move from theory to practical implementation and transform your cluster’s security posture.
1. Implement Role-Based Access Control (RBAC)
Role-Based Access Control (RBAC) is a non-negotiable cornerstone of Kubernetes security, providing a standardized way to regulate access to the Kubernetes API. By default, Kubernetes might allow overly permissive access, creating significant security risks. RBAC addresses this by enabling you to grant granular permissions to users, groups, and service accounts, ensuring that each identity operates under the principle of least privilege. This means any entity, whether a developer or a deployment script, only has the exact permissions required to perform its intended function, and nothing more.

This mechanism is fundamental for isolating workloads, preventing unauthorized resource modification, and protecting sensitive data within the cluster. Implementing a robust RBAC strategy is one of the most effective Kubernetes security best practices you can adopt to prevent both accidental misconfigurations and malicious attacks.
How RBAC Works in Kubernetes
RBAC relies on four key API objects:
- Role: Defines a set of permissions (like
get,list,create,deleteon resources such as Pods or Services) within a specific namespace. - ClusterRole: Similar to a Role, but its permissions apply across the entire cluster, covering all namespaces and non-namespaced resources like Nodes.
- RoleBinding: Grants the permissions defined in a Role to a user, group, or service account within that Role’s namespace.
- ClusterRoleBinding: Binds a ClusterRole to an identity, granting cluster-wide permissions.
For instance, a Role for a CI/CD pipeline service account might only allow create and update on Deployments and Services in the app-prod namespace, but nothing else.
Actionable Tips for RBAC Implementation
To effectively implement RBAC, follow these structured steps:
- Favor Namespace-Scoped Roles: Whenever possible, use
RolesandRoleBindingsinstead of their cluster-wide counterparts. This limits the “blast radius” of a compromised account, confining potential damage to a single namespace. ReserveClusterRolesfor administrators and components that genuinely require cluster-wide access, like monitoring agents. - Start with Built-in Roles and Customize: Kubernetes provides default user-facing roles like
admin,edit, andview. Use these as a starting point and create custom roles for specific application or user needs. For example, to create a read-only role for a developer in thedevnamespace, create aRoleYAML file and apply it withkubectl apply -f readonly-role.yaml. - Audit and Prune Permissions Regularly: Permissions tend to accumulate over time, a phenomenon known as “privilege creep.” Regularly audit all
RoleBindingsandClusterRoleBindingsto identify and remove excessive or unused permissions. Usekubectl auth can-i <verb> <resource> --as <user>to test permissions. For deeper analysis, tools likekubectl-who-canor open-source solutions like Krane can help you analyze and visualize who has access to what. - Integrate with an External Identity Provider (IdP): For enhanced security and manageability, integrate Kubernetes with your corporate identity system (e.g., Azure AD, Okta, Google Workspace) via OIDC. This centralizes user management, enforces MFA, and ensures that when an employee leaves the company, their cluster access is automatically revoked.
2. Enable Pod Security Standards and Admission Controllers
Pod Security Standards (PSS) are predefined security policies that restrict how Pods can be configured, preventing common exploits at the workload level. When coupled with an admission controller, these standards become a powerful enforcement mechanism, acting as a gatekeeper that validates every Pod specification against your security rules before it’s allowed to run in the cluster. This proactive approach is a critical layer in a defense-in-depth strategy, ensuring that insecure workloads are blocked by default.
Implementing these controls is one of the most effective Kubernetes security best practices for hardening your runtime environment. By enforcing constraints like disallowing privileged containers (securityContext.privileged: false) or root users (securityContext.runAsNonRoot: true), you drastically reduce the attack surface and contain the potential impact of a compromised application.
How Pod Security and Admission Control Work
Kubernetes uses admission controllers to intercept and process requests to the API server after authentication and authorization. The Pod Security Admission (PSA) controller is a built-in feature (generally available since v1.25) that enforces the Pod Security Standards. These standards are defined at three levels:
- Privileged: Unrestricted, for trusted system-level workloads.
- Baseline: Minimally restrictive, preventing known privilege escalations while maintaining broad application compatibility.
- Restricted: Heavily restrictive, following current pod hardening best practices at the expense of some compatibility.
For more complex or custom policies, organizations often use dynamic admission controllers like OPA Gatekeeper or Kyverno. These tools allow you to write custom policies using Rego or YAML, respectively, to enforce rules such as requiring resource limits on all pods or blocking images from untrusted registries.
Actionable Tips for Implementation
To effectively enable pod security controls, adopt a phased, systematic approach:
- Start in Audit Mode: Begin by applying your desired policy level to a namespace in
auditmode. This logs violations without blocking deployments, allowing you to identify non-compliant workloads. Apply it with a label:kubectl label --overwrite ns my-app pod-security.kubernetes.io/audit=baseline. - Implement Gradually: Roll out enforcement (
enforcemode) namespace by namespace, starting with non-production environments. This minimizes disruption and gives teams time to update their application manifests to be compliant with the new security posture. - Leverage OPA Gatekeeper for Custom Policies: While PSA is excellent for enforcing standard security contexts, use OPA Gatekeeper for more advanced, custom requirements. For instance, create a
ConstraintTemplateto ensure all ingress objects have a valid hostname. - Document All Exceptions: Inevitably, some workloads may require permissions that violate your standard policy. Document every exception, including the justification and the compensating controls in place. This creates an auditable record and maintains a strong security baseline.
- Regularly Review and Update Policies: Security is not a one-time setup. As new vulnerabilities are discovered and best practices evolve, regularly review and tighten your PSS and custom Gatekeeper policies to adapt to the changing threat landscape.
3. Secure Container Images and Registry Management
A container is only as secure as the image it is built from. Securing container images is a critical layer in the Kubernetes security model, as vulnerabilities within an image can expose your entire application to attack. This practice involves embedding security throughout the image lifecycle, from selecting a base image and building the application, to storing it in a registry and deploying it to a cluster. An insecure image can introduce malware, outdated libraries with known CVEs, or misconfigurations directly into your production environment.
Adopting a robust image security strategy is one of the most impactful Kubernetes security best practices because it shifts security left, catching and remediating vulnerabilities before they ever reach the cluster. This proactive approach hardens your software supply chain and drastically reduces the attack surface of your running applications.
How Image and Registry Security Works
This security discipline integrates several key processes and tools to ensure image integrity and trustworthiness:
- Vulnerability Scanning: Images are scanned for known vulnerabilities in operating system packages and application dependencies. Tools like Trivy or Clair integrate directly into CI/CD pipelines to automate this process.
- Image Signing: Cryptographic signatures are used to verify the origin and integrity of an image. This ensures that the image deployed is the exact one built by a trusted source and has not been tampered with.
- Secure Registries: Private container registries like Red Hat Quay or Harbor are used to store and manage images, providing access control, auditing, and replication features.
- Admission Control: Kubernetes admission controllers can be configured to enforce policies, such as blocking the deployment of images with critical vulnerabilities or those that are not from a trusted, signed source.
For example, a CI pipeline can run trivy image my-app:latest --exit-code 1 --severity CRITICAL to fail the build if any critical vulnerabilities are found.
Actionable Tips for Image and Registry Security
To implement a strong image security posture, follow these structured steps:
- Use Minimal, Distroless Base Images: Start with the smallest possible base image, such as Google’s “distroless” images or minimal images like Alpine Linux. These images contain only your application and its runtime dependencies, eliminating shells, package managers, and other utilities that could be exploited.
- Integrate Scanning into Your CI/CD Pipeline: Automate vulnerability scanning on every build. Configure your pipeline to fail if vulnerabilities exceeding a certain severity threshold (e.g.,
HIGHorCRITICAL) are discovered. This provides immediate feedback to developers and prevents vulnerable code from progressing. - Implement Image Signing with Sigstore: Adopt modern image signing tools like Sigstore’s Cosign to create a verifiable software supply chain. Use
cosign sign my-image@sha256:...'to sign your image and push the signature to the registry. This provides a strong guarantee of authenticity and integrity. - Enforce Policies with an Admission Controller: Use a policy engine like Kyverno or OPA Gatekeeper as an admission controller. Create policies to block deployments of images from untrusted registries (e.g., allow only
my-registry.com/*), those without valid signatures, or images that have known critical vulnerabilities. - Maintain an Approved Base Image Catalog: Establish and maintain a curated list of approved, hardened base images for developers. This streamlines development while ensuring that all applications are built on a secure and consistent foundation that your security team has vetted.
4. Network Segmentation with Network Policies
By default, all pods in a Kubernetes cluster can communicate with each other, creating a flat, permissive network that can be exploited by attackers. Network Policies address this critical vulnerability by providing a native, firewall-like capability to control traffic flow at the IP address or port level. This enables micro-segmentation, allowing you to enforce a zero-trust network model where all traffic is denied by default, and only explicitly allowed connections can be established.
Implementing fine-grained Network Policies is a crucial Kubernetes security best practice for isolating workloads, preventing lateral movement of attackers, and ensuring services only communicate with their intended peers. This significantly reduces the attack surface and helps achieve compliance with standards like PCI DSS.
How Network Policies Work in Kubernetes
Network Policies are Kubernetes resources that select groups of pods using labels and define rules specifying what traffic is allowed to and from those pods. Their effectiveness depends on a Container Network Interface (CNI) plugin that supports them, such as Calico, Cilium, or Weave Net. A policy can specify rules for:
- Ingress: Inbound traffic to a selected group of pods.
- Egress: Outbound traffic from a selected group of pods.
Rules are defined based on pod selectors (labels), namespace selectors, or IP blocks (CIDR ranges). For example, a NetworkPolicy can specify that pods with the label app=backend can only accept ingress traffic from pods with the label app=frontend on TCP port 8080.
Actionable Tips for Network Policy Implementation
To effectively implement Network Policies, follow these structured steps:
- Start with a Default-Deny Policy: Begin by applying a “deny-all” policy to a namespace. This blocks all ingress and egress traffic, forcing you to explicitly whitelist every required connection.
apiVersion: networking.k8s.io/v1 kind: NetworkPolicy metadata: name: default-deny-all spec: podSelector: {} policyTypes: - Ingress - Egress - Adopt a Consistent Labeling Strategy: Since policies rely heavily on labels to identify pods, a clear and consistent labeling strategy is essential. Define standard labels for applications (
app: backend), environments (env: prod), and security tiers (tier: frontend) to create precise and maintainable rules. - Visualize and Monitor Network Flows: Before locking down traffic, use a tool like Cilium’s Hubble or other network observability solutions to visualize existing traffic patterns. This helps you understand legitimate communication paths and avoid breaking applications when you apply restrictive policies.
- Gradually Introduce and Test Policies: Roll out new policies in a non-production or staging environment first. Start with permissive rules and incrementally tighten them while testing application functionality. This iterative approach minimizes the risk of production outages. Document all policy decisions and any necessary exceptions for future audits.
5. Secrets Management and Encryption
Effective secrets management is a critical discipline within Kubernetes security, focused on protecting sensitive data like API keys, database credentials, and TLS certificates. By default, Kubernetes stores secrets as base64-encoded strings in etcd, which offers no real protection as it’s easily reversible. Proper secrets management involves securely storing, tightly controlling access to, and regularly rotating this sensitive information to prevent unauthorized access and data breaches.
Adopting a robust strategy for secrets is a foundational Kubernetes security best practice. It ensures that credentials are not hardcoded in application code, configuration files, or container images, which are common but dangerous anti-patterns that create massive security vulnerabilities.
How Secrets Management Works in Kubernetes
A secure secrets management workflow involves several layers of defense. The first step is enabling encryption at rest for etcd, which protects the raw secret data stored in the Kubernetes database. Beyond this, best practices advocate for using external, dedicated secret management systems that provide advanced features like dynamic secret generation, fine-grained access policies, and automated rotation.
These external systems integrate with Kubernetes, often via operators or sidecar containers, to inject secrets directly into pods at runtime. Pods can authenticate to the vault using their Service Account Token, retrieve the secret, and mount it as a volume or environment variable. This ensures secrets are only available in memory at runtime and never written to disk.
Actionable Tips for Secrets Management
To build a secure and scalable secrets management pipeline, follow these technical steps:
- Enable Encryption at Rest for
etcd: This is the baseline defense. Configure the Kubernetes API server to encryptetcddata by creating anEncryptionConfigurationobject and setting the--encryption-provider-configflag on the API server. - Use External Secret Management Systems: For production environments, native Kubernetes Secrets are insufficient. Integrate a dedicated secrets vault like HashiCorp Vault, AWS Secrets Manager, or Google Secret Manager. These tools provide centralized control, detailed audit logs, and dynamic secret capabilities. Learn more about how Opsmoon integrates Vault for robust secrets management.
- Never Store Secrets in Git or Images: Treat your Git repository and container images as public artifacts. Never commit plaintext secrets,
.envfiles, or credentials into version control or bake them into container layers. This is one of the most common and severe security mistakes. - Implement Automated Secret Rotation: Manually rotating secrets is error-prone and often neglected. Use your external secrets manager to configure and enforce automated rotation policies for all credentials. This limits the window of opportunity for an attacker using a compromised key.
- Leverage GitOps-Friendly Tools: If you follow a GitOps methodology, use tools like Bitnami’s Sealed Secrets. This allows you to encrypt a secret into a
SealedSecretcustom resource, which is safe to store in a public Git repository. The in-cluster controller is the only entity that can decrypt it, combining GitOps convenience with strong security.
6. Runtime Security Monitoring and Threat Detection
While preventative controls like RBAC and network policies are essential, they cannot stop every threat. Runtime security involves continuously observing workloads during execution to detect and respond to malicious activity in real-time. This is a critical layer in a defense-in-depth strategy, moving from static configuration checks to dynamic, behavioral analysis of your running applications.
This practice is one of the most important Kubernetes security best practices because it acts as your cluster’s immune system. It identifies anomalies like unexpected process executions (exec into a container), unauthorized network connections, or file modifications within a container (/etc/shadow being read), which are often indicators of a security breach.
How Runtime Security Works in Kubernetes
Runtime security tools typically use a kernel-level agent or an eBPF probe to gain deep visibility into system calls, network traffic, and process activity. They compare this observed behavior against predefined security policies and behavioral baselines.
- Behavioral Analysis: Tools learn the normal behavior of an application and flag deviations. For example, if a web server container suddenly spawns a reverse shell, the tool triggers an alert.
- Policy Enforcement: You can define rules to block specific actions, such as preventing a container from writing to a sensitive directory or making outbound connections to a known malicious IP.
- Threat Detection: Rulesets are updated with the latest threat intelligence to detect known exploits, malware signatures, and cryptomining activity.
Falco, a CNCF-graduated tool, is a prime example. A Falco rule can detect when a shell is run inside a container and generate a high-priority alert.
Actionable Tips for Runtime Security Implementation
To effectively implement runtime security, follow these structured steps:
- Start with Default Rulesets: Deploy a tool like Falco or Sysdig with its comprehensive, pre-built rule libraries. This establishes a solid security baseline and provides immediate visibility into common threats like privilege escalation attempts or sensitive file access.
- Tune Rules to Reduce False Positives: In the initial phase, run the tool in a non-blocking, audit-only mode. Analyze the alerts to understand your applications’ normal behavior and fine-tune the rules to eliminate noise. For example, you might need to allow a specific process for your application that is flagged by a generic rule.
- Correlate Kubernetes and Application Events: A holistic security view requires context. Integrate runtime security alerts with your broader observability and SIEM platforms to correlate container activity with Kubernetes API audit logs, application logs, and infrastructure metrics for faster and more accurate incident investigation.
- Implement Automated Response for Critical Events: For high-confidence, high-severity alerts (e.g., terminal shell in a container), automate response actions using a tool like Falcosidekick. This could involve terminating the compromised pod, isolating it with a network policy, or sending a detailed alert to your on-call incident response team via PagerDuty or Slack.
7. Secure Cluster Configuration and Hardening
Cluster hardening is a comprehensive security process focused on securing the underlying infrastructure of your Kubernetes environment. It involves applying rigorous security configurations to every core component, including the API server, etcd datastore, kubelet on each node, and control plane services. By default, many components may have settings optimized for ease of use rather than maximum security, creating potential attack vectors. Hardening systematically closes these gaps by aligning the cluster’s configuration with established security standards.
This proactive defense-in-depth strategy is crucial for establishing a secure foundation. It ensures that even if one layer of defense is breached, the hardened components of the cluster itself are resilient against further exploitation. Adhering to these Kubernetes security best practices minimizes the cluster’s attack surface and protects it from both internal misconfigurations and external threats.
How Cluster Hardening Works
Hardening follows a principle-based approach, guided by industry-recognized benchmarks. The most prominent of these is the Center for Internet Security (CIS) Kubernetes Benchmark, a detailed checklist of security-critical configuration settings. It provides prescriptive guidance for securing the control plane, etcd, and worker nodes, covering hundreds of specific checks.
Implementing hardening involves auditing your cluster against these benchmarks and remediating any non-compliant configurations. For example, the CIS Benchmark recommends disabling anonymous authentication to the API server (--anonymous-auth=false) and restricting kubelet permissions to prevent unauthorized access (--authorization-mode=Webhook and --authentication-token-webhook=true).
Actionable Tips for Hardening Your Cluster
To effectively harden your Kubernetes cluster, follow these structured steps:
- Follow the CIS Kubernetes Benchmark: This should be your primary guide. It provides specific command-line arguments and configuration file settings for each Kubernetes component. Use it as a definitive checklist for securing your entire cluster configuration.
- Use Automated Scanning Tools: Manually auditing hundreds of settings is impractical. Use automated tools like
kube-benchto scan your cluster against the CIS Benchmark. Run it as a Kubernetes Job to get a detailed report of passed, failed, and warning checks, making remediation much more efficient. - Disable Unnecessary Features and APIs: Reduce your attack surface by disabling any Kubernetes features, beta APIs, or admission controllers you don’t need. Every enabled feature is a potential entry point for an attacker. Review and remove unused components from your environment regularly. For example, disable the legacy
ABACauthorizer if you are usingRBAC. - Implement Regular Security Scanning and Updates: Hardening is not a one-time task. Continuously scan your container images, nodes, and cluster configurations for new vulnerabilities. Apply security patches and update Kubernetes versions promptly to protect against newly discovered threats. For those seeking expert guidance on maintaining a robust and secure environment, you can explore professional assistance with secure cluster configuration and hardening.
8. Supply Chain Security and Software Bill of Materials (SBOM)
A container image is only as secure as the components within it. Supply chain security in Kubernetes addresses the entire lifecycle of your application artifacts, from the developer’s first line of code to the final image running in a pod. This holistic approach ensures the integrity, provenance, and security of every dependency and build step, preventing malicious code from being injected into your production environment. A core component of this strategy is the Software Bill of Materials (SBOM), an inventory of every component in your software.
Adopting a secure supply chain is a critical Kubernetes security best practice because modern applications are assembled, not just written. They rely on a vast ecosystem of open-source libraries and base images. Without verifying the origin and integrity of these components, you expose your cluster to significant risks, including vulnerabilities, malware, and compliance issues.
How Supply Chain Security Works
A secure software supply chain is built on three pillars: verifiable identity, artifact integrity, and provenance.
- Verifiable Identity (Signing): Every artifact, from a container image to a configuration file, is digitally signed. This proves who created it and ensures it hasn’t been tampered with. Projects like Sigstore provide free, easy-to-use tools for signing and verifying software artifacts.
- Artifact Integrity (SBOM): An SBOM, often in formats like SPDX or CycloneDX, provides a detailed list of all software components, their versions, and licenses. This allows for automated vulnerability scanning and license compliance checks.
- Provenance (Attestations): This involves creating a verifiable record of how an artifact was built. The SLSA (Supply-chain Levels for Software Artifacts) framework provides a standard for generating and verifying this build provenance, confirming that the artifact was built by a trusted, automated CI/CD pipeline.
For instance, Google leverages the SLSA framework internally to secure its own software delivery, while VMware Tanzu offers tools to automatically generate SBOMs for container images built on its platform.
Actionable Tips for Implementation
To fortify your software supply chain for Kubernetes, follow these steps:
- Implement Artifact Signing with Sigstore: Integrate Cosign (part of the Sigstore project) into your CI/CD pipeline to automatically sign every container image you build. This cryptographic signature provides a non-repudiable guarantee of the image’s origin.
- Automate SBOM Generation: Use tools like Syft or Trivy in your build process to automatically generate an SBOM for every image. Run
syft packages my-image -o spdx-json > sbom.spdx.jsonand store this SBOM alongside the image in your container registry for easy access. - Enforce Signature Verification with Admission Controllers: Deploy an admission controller like Kyverno or OPA Gatekeeper in your cluster. Configure policies that prevent unsigned or unverified images from being deployed, effectively blocking any container from an untrusted source.
- Maintain a Centralized Dependency Inventory: Use your generated SBOMs to create a centralized, searchable inventory of all software dependencies across all your applications. This is invaluable for quickly identifying the impact of newly discovered vulnerabilities, like Log4j.
- Track Build Provenance: Implement SLSA principles by generating in-toto attestations during your build. This creates a secure, auditable trail proving that your artifacts were produced by your trusted build system and not tampered with post-build.
Kubernetes Security Best Practices Comparison
| Item | Implementation Complexity | Resource Requirements | Expected Outcomes | Ideal Use Cases | Key Advantages |
|---|---|---|---|---|---|
| Implement Role-Based Access Control (RBAC) | Moderate to High | Requires knowledgeable admins and ongoing maintenance | Granular access control, least privilege enforcement | Multi-tenant clusters, compliance-focused environments | Prevents unauthorized access; audit trails; limits breach impact |
| Enable Pod Security Standards and Admission Controllers | Moderate | Configuring policies and admission controllers | Enforced secure pod configurations and posture | Preventing insecure pod deployments, standardizing cluster security | Blocks insecure pods; clear security guidelines; reduces attack surface |
| Secure Container Images and Registry Management | High | Tools for scanning, signing, registry management | Verified, vulnerability-free container images | CI/CD pipelines, environments with strict supply chain security | Ensures image integrity; prevents vulnerable deployments; compliance |
| Network Segmentation with Network Policies | Moderate to High | CNI plugin support; ongoing policy management | Micro-segmentation, controlled pod communication | Zero-trust networking, sensitive multi-tenant workloads | Implements zero-trust; limits blast radius; detailed traffic control |
| Secrets Management and Encryption | Moderate to High | Integration with external secret stores, KMS | Secure secret storage, controlled access, secret rotation | Managing sensitive data, regulatory compliance | Centralizes secret management; automatic rotation; auditability |
| Runtime Security Monitoring and Threat Detection | High | Monitoring tools, alert management | Early threat detection, compliance monitoring | Security operations, incident response | Real-time alerts; forensic capabilities; automated compliance |
| Secure Cluster Configuration and Hardening | High | Deep Kubernetes expertise; security tools | Hardened cluster infrastructure, reduced attack surface | Production clusters needing strong baseline security | Foundation-level security; compliance; reduces infrastructure risks |
| Supply Chain Security and Software Bill of Materials (SBOM) | High | Tooling for SBOM, signing, provenance tracking | Software supply chain visibility, artifact integrity | Secure DevOps, compliance with emerging regulations | Visibility into components; rapid vulnerability response; artifact trust |
From Best Practices to Operational Excellence in Kubernetes Security
Navigating the complexities of Kubernetes security can feel like a formidable task, but it is an achievable and essential goal for any organization leveraging container orchestration. Throughout this guide, we’ve explored a multi-layered defense strategy, moving far beyond generic advice to provide actionable, technical blueprints for hardening your clusters. These are not just items on a checklist; they are foundational pillars that, when combined, create a resilient and secure cloud-native ecosystem.
The journey begins with establishing a strong identity and access perimeter. Implementing granular Role-Based Access Control (RBAC) ensures that every user, group, and service account operates under the principle of least privilege. This foundational control is then powerfully augmented by Pod Security Standards (PSS) and admission controllers, which act as programmatic gatekeepers, enforcing your security policies before any workload is even scheduled.
Unifying Security Across the Lifecycle
A truly robust security posture extends beyond cluster configuration into the entire software development lifecycle. The kubernetes security best practices we’ve detailed emphasize this holistic approach.
- Securing the Artifacts: Your defense starts with what you deploy. By meticulously securing your container images through vulnerability scanning, signing, and managing a private, hardened registry, you prevent known exploits from ever entering your environment.
- Securing the Network: Once deployed, workloads must be isolated. Kubernetes Network Policies provide the critical tooling for micro-segmentation, creating a zero-trust network environment where pods can only communicate with explicitly authorized peers. This dramatically limits the blast radius of a potential compromise.
- Securing the Data: Protecting sensitive information is non-negotiable. Moving beyond basic
Secretsobjects to integrated, external secrets management solutions ensures that credentials, tokens, and keys are encrypted at rest and in transit, with auditable access patterns.
From Reactive Defense to Proactive Resilience
The most mature security strategies are not just about prevention; they are about detection and response. This is where runtime security monitoring becomes indispensable. Tools that analyze system calls, network traffic, and file system activity in real-time provide the visibility needed to detect anomalous behavior and respond to threats as they emerge.
This proactive mindset also applies to your supply chain. In an era where dependencies are a primary attack vector, generating and analyzing a Software Bill of Materials (SBOM) is no longer optional. It is a critical practice for understanding your software’s composition and quickly identifying exposure when new vulnerabilities are discovered. Finally, all these controls rest upon a securely configured cluster foundation, hardened according to CIS Benchmarks and industry standards to minimize the underlying attack surface.
Mastering these eight domains transforms your security approach from a series of disjointed tasks into a cohesive, continuously improving program. It’s about shifting from a reactive, compliance-driven mindset to one of proactive, operational excellence. By systematically implementing, auditing, and refining these kubernetes security best practices, you are not just securing a cluster; you are building a foundation of trust for every application and service you run. This technical diligence is what separates fragile systems from truly resilient, enterprise-grade platforms capable of withstanding modern threats.
Ready to transform these best practices into your operational reality? The expert DevOps and Kubernetes engineers at OpsMoon specialize in implementing and automating robust security frameworks. Connect with the top 0.7% of global talent and start building a more secure, resilient, and scalable cloud-native platform today at OpsMoon.