When you're comparing AWS vs Azure vs GCP, the fundamental difference really boils down to their core DNA. AWS has the most extensive service portfolio because they were first to market, offering mature, battle-tested solutions for nearly any use case. Azure shines in hybrid cloud and enterprise integration, leveraging its deep roots in corporate IT. And GCP is the undisputed leader in data analytics, Kubernetes, and machine learning, built on the same infrastructure that powers Google Search and YouTube.
The choice you make hinges on your technical priorities. Do you need the absolute widest array of instance types and managed services? Are you integrating with an existing on-premises Windows Server and Active Directory environment? Or are you building a data-intensive, container-native platform from scratch? Each path points to a different provider.
The State of the Cloud in the AI Era
Before we get into the nitty-gritty technical details, it's worth taking a step back to look at the big picture. The AI arms race is shaking things up, forcing each of the big three to double down on what makes them unique. Knowing who's leading, who's catching up, and why that even matters is the first real step in making a smart decision for your team.
As of the first quarter of 2025, Amazon Web Services (AWS) still holds the top spot in the global cloud infrastructure game, commanding a 32% market share and pulling in a staggering $29.3 billion in quarterly revenue.
But don't let that fool you—Microsoft Azure and Google Cloud are closing the gap, and fast. Together, these three giants capture about 63% of all enterprise spending on cloud services. It's their world; we're just building in it. For a deeper dive, check out this cloud market share report on CRN.com.
This fierce competition means each provider has to carve out its own niche to win. AWS got a massive head start, allowing it to build a mature and incredibly broad ecosystem that’s hard to beat on sheer volume.
To give you a quick lay of the land, I've put together a high-level snapshot. Think of this as your cheat sheet for understanding where each provider stands before we jump into the detailed comparisons.
High-Level Cloud Provider Snapshot
| Provider | Market Position | Primary Strengths | Best For |
|---|---|---|---|
| AWS | Leader (32%) | The most comprehensive and mature portfolio of services, massive global footprint. | Organizations that need the widest array of proven tools, granular control, and the most reliable infrastructure available. |
| Azure | Challenger | Deep integration with Microsoft enterprise software, powerful hybrid cloud capabilities (Azure Arc). | Enterprises heavily invested in the Microsoft stack (Windows Server, AD) who need seamless on-premises integration. |
| GCP | Niche Leader | Unmatched excellence in Kubernetes (GKE), data analytics (BigQuery), AI/ML, and open-source tooling. | Data-first companies and startups focused on modern containerization, advanced analytics, and global networking. |
This table frames the core identity of each platform. Now, with this context in mind, let's break down how they stack up in the areas that truly matter for your day-to-day operations.
Comparing Core Compute and Storage Services
At the end of the day, any cloud setup boils down to two things: compute and storage. This is where you see the real technical differences pop up when you stack AWS, Azure, and GCP side-by-side. Getting these foundational blocks right is everything—it impacts performance, scalability, and, of course, your monthly bill. For any architect or engineer, this is ground zero.
The main players in the compute space are AWS EC2, Azure Virtual Machines, and Google Compute Engine. They all give you virtual servers, sure, but how they handle instance types, networking, scaling, and pricing tells you a lot about their core philosophies.
Azure's approach to compute really clicks with organizations already deep in the Microsoft world. The seamless integration with existing tools like Active Directory for authentication is a huge plus for them.
A Technical Look at Compute Services
When it comes to sheer variety, AWS EC2 is the undisputed king. It offers over 400 instance types, including specialized hardware like Graviton (ARM-based) processors for cost-performance optimization and FPGAs for custom hardware acceleration. Its Auto Scaling Groups are incredibly mature, allowing you to build complex scaling policies based on custom CloudWatch metrics, SQS queue depth, or predictive scaling. That's a game-changer for apps with unpredictable traffic. If you want to get your hands dirty optimizing these services, our guide to AWS services and solutions has some great, actionable tips.
Azure VMs play a different game. Their strength lies in hybrid cloud setups, powered by Azure Arc, and that tight integration with the wider Microsoft stack. Their Virtual Machine Scale Sets are solid for auto-scaling, but the real draw for many is the first-class support for both Linux and Windows servers, including Azure Hybrid Benefit which lets you use on-premises Windows Server licenses. It makes lifting and shifting legacy enterprise workloads much less painful.
Google Compute Engine carves out its own niche with custom machine types. You can dial in the exact vCPU and memory you need (e.g., 6 vCPUs and 24 GB RAM), which is a massive advantage. This level of control can slash costs by avoiding the all-too-common problem of over-provisioning with fixed instance sizes from AWS or Azure. GCE's live migration for VMs during host maintenance is also a major operational win, reducing downtime.
Breaking Down Object Storage Tiers
Object storage is another major battleground, with AWS S3, Azure Blob Storage, and Google Cloud Storage going head-to-head. They might look similar on the surface, but the devil is in the details—specifically, in their storage tiers, data lifecycle rules, and API consistency models, which have huge cost and performance implications.
-
AWS S3: This is the most established player, and it shows. S3 offers the most comprehensive set of storage classes, from S3 Standard for hot data (sub-millisecond first-byte latency) to S3 Glacier Deep Archive for long-term cold storage. Its lifecycle policies are incredibly powerful for automatically moving data between tiers, and its S3 Intelligent-Tiering class automates cost savings by analyzing access patterns.
-
Azure Blob Storage: Azure keeps things a bit simpler with its Hot, Cool, and Archive tiers. A standout feature here is the premium tier, which leverages high-performance SSDs for object storage. It’s built for workloads like interactive video editing or high-frequency data logging that absolutely cannot tolerate latency and need high transaction rates.
-
Google Cloud Storage: Google’s approach is all about simplicity, offering Standard, Nearline, Coldline, and Archive tiers. The big win here is that a single API works across all storage classes. This means you can change a bucket's storage class without rewriting your application code, which is a huge relief for developers and ops teams managing data across different access patterns.
Analyzing Database and Networking Architectures
When you get deeper into the technical stack, the choice between AWS, Azure, and GCP really starts to boil down to their database and networking services. These are the components that dictate your application's performance, scalability, and resilience. Looking at the architectural philosophies behind each platform reveals some critical differences that will absolutely impact how you design and deploy your systems.
For relational databases, you’re looking at AWS RDS, Azure SQL Database, and Google Cloud SQL as the main managed offerings. They all handle the basics like automated patching, backups, and failover, but that’s where the similarities end. Their serverless options, performance characteristics, and how they plug into their respective ecosystems are worlds apart.
The same story applies to NoSQL. AWS DynamoDB, Azure Cosmos DB, and Google's Firestore/Bigtable each bring something unique to the table in terms of consistency models, APIs, and how they promise to scale.
Contrasting Database Services and Performance
Looking at relational databases, AWS RDS is the undisputed champion of variety. It supports just about every engine you can think of—PostgreSQL, MySQL, Oracle, SQL Server, and MariaDB. RDS also offers Aurora, a MySQL and PostgreSQL-compatible database with superior performance and scalability.
Azure SQL Database, on the other hand, is a highly optimized, platform-as-a-service offering built for the Microsoft world. Its integration with tools like Power BI and Active Directory is seamless, and its serverless tier is excellent for unpredictable workloads. If you're navigating complex, hybrid cloud setups, OpsMoon offers expert guidance on Azure services to make that integration smooth.
Google Cloud SQL has a reputation for simplicity and rock-solid performance, especially with its PostgreSQL and MySQL options. Google also offers AlloyDB (PostgreSQL-compatible) for high-performance transactional workloads and Spanner, a globally-distributed relational database that provides strong consistency at planet scale. The differences get even more pronounced when you step into the NoSQL arena.
- AWS DynamoDB: It’s all about predictable low latency. DynamoDB delivers single-digit millisecond latency at any scale, but it demands that you model your data carefully around your access patterns (single table design). Get it wrong, and you're looking at some costly table scans.
- Azure Cosmos DB: This is the multi-tool of databases. As a multi-model database, it supports APIs for SQL (Core), MongoDB, Cassandra, Gremlin, and Table. That gives you incredible flexibility, but be prepared for a more complex pricing structure based on Request Units (RUs).
- Google Firestore/Bigtable: Firestore is a document database fantastic for mobile and web app backends that need real-time synchronization. Bigtable is a completely different beast—a wide-column NoSQL store built for massive analytical and operational workloads (e.g., time-series data) where scale is everything.
The real takeaway here is that your choice has to be driven by your application's data model and performance requirements—latency, consistency, and query patterns should be your guide.
A critical differentiator in networking architecture is GCP’s global VPC model. Unlike AWS and Azure, which use regional VPCs/VNets by default, a GCP VPC is a global resource. This simplifies cross-region communication and management, allowing you to create a single private network with subnets in different regions, all communicating over Google's private backbone without complex peering configurations.
Unpacking Networking and Global Footprints
That global VPC design from Google is a massive architectural advantage for globally distributed applications. It just cuts down on so much operational overhead.
With AWS and Azure, you’re provisioning separate VPCs or VNets in each region and then manually stitching them together. You’ll use tools like VPC Peering or Transit Gateway in AWS, or VNet Peering and Virtual WAN in Azure. These regional models are great for strong isolation and meeting strict data sovereignty rules, but they definitely add layers of complexity to network management when scaling globally.
Content Delivery Networks (CDNs) also show off each provider's strengths. AWS CloudFront is mature and packed with features, like Lambda@Edge for running code at the edge. Azure CDN offers a choice between Microsoft's own network or Verizon's, giving you some flexibility. Google's Cloud CDN taps into its premium global network, the same one that serves YouTube and Google Search, which is known for exceptional performance and low latency.
Ultimately, in this aws vs azure vs gcp comparison, the best choice really hinges on your specific performance goals and whether your architecture is regional or global.
Evaluating the AI and Machine Learning Ecosystem
AI and machine learning aren't just features anymore; they're the main event. This is where you can really see the strategic playbook of each cloud provider. Forget simple API shootouts—we're talking about a full-stack evaluation. When you're running an aws vs azure vs gcp comparison here, you have to look at everything from high-level, plug-and-play APIs to the deep, custom model development platforms.
If your team just needs to get AI features into an app fast, pre-trained models are a godsend. AWS gives you services like Rekognition for image analysis, Azure has its well-regarded Cognitive Services, and GCP offers its Vision AI. These tools let developers who aren't ML PhDs add some pretty sophisticated capabilities with simple REST API calls.
But for organizations building their own proprietary models from the ground up, the real fight is over the comprehensive ML platforms. AWS brings Amazon SageMaker to the table, Microsoft has Azure Machine Learning, and Google’s offering is Vertex AI. Each one is designed to be a one-stop shop for the entire MLOps lifecycle, from data labeling and feature engineering to training, deployment, and monitoring.
Platform Differentiators and Strategic Advantages
AWS SageMaker’s biggest strength is its sprawling toolset and tight integration across the entire AWS universe. It includes everything from SageMaker Studio for a full IDE experience to specialized features like SageMaker JumpStart for pre-built models. For any organization already deep in the AWS ecosystem, it's a natural and powerful choice.
Azure's trump card is its exclusive partnership with OpenAI. This gives enterprises turnkey access to models like GPT-4 via the Azure OpenAI Service, offering a massive head start for anyone building generative AI applications within a secure, enterprise-grade environment. When looking at the AI and Machine Learning ecosystems, it's clear that services like Microsoft Azure's Cognitive Services deliver powerful, pre-built AI. For a closer look at Cognitive Services integration, other resources can provide some great implementation examples.
Google's strength in AI is baked into its DNA, built on decades of pioneering research. GCP's Vertex AI is deeply connected to its homegrown models like Gemini and its specialized hardware, particularly the Tensor Processing Units (TPUs). For training massive-scale models, TPUs can offer a significant cost-performance advantage over GPUs that's hard to ignore.
This all-in bet on AI is backed by staggering investment. In 2025, AWS, Microsoft, and Google Cloud are planning a combined capital expenditure of over $240 billion. The bulk of that is going straight into building new data centers and beefing up their AI services. What's wild is that these services are only projected to bring in about $25 billion in revenue. That tells you this isn't about short-term profit; it's a long-term strategic war for who will dominate the future of the cloud.
So, how do you choose? It really boils down to your own AI roadmap.
- If you need a mature, do-it-all platform with maximum flexibility, SageMaker is a rock-solid contender.
- For getting to market quickly with advanced generative AI, Azure's OpenAI hookup is unparalleled.
- And if you're chasing raw training performance and want access to bleeding-edge models and hardware, GCP has a clear technical edge.
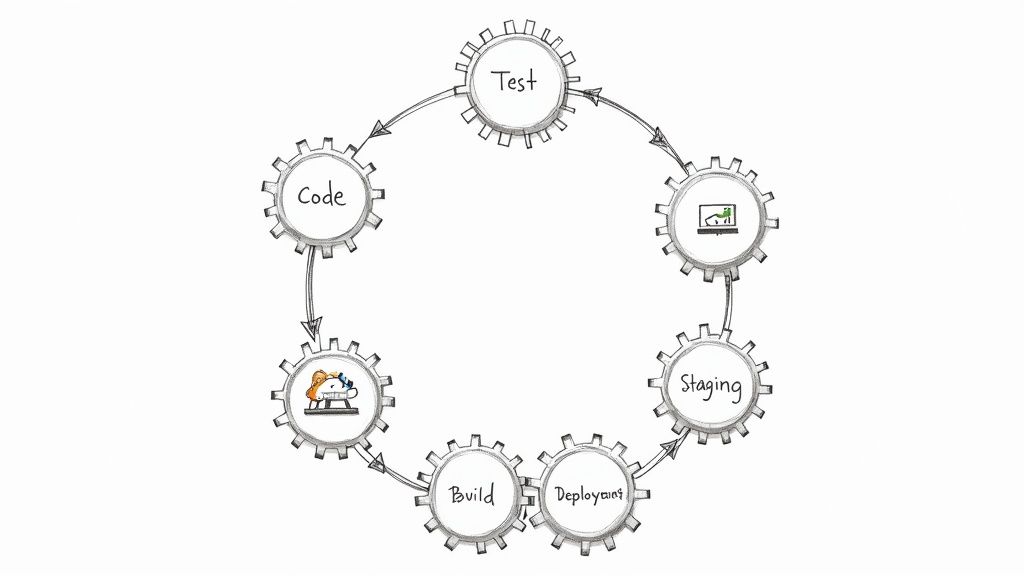
The DevOps and Kubernetes Implementation Showdown
How you deliver modern applications comes down to the quality of your DevOps toolchain and your approach to container orchestration. In an AWS vs Azure vs GCP comparison, this is where the cloud provider’s core philosophy directly shapes your team's CI/CD velocity and the operational stability of your systems.
Azure DevOps is a standout for its highly integrated, all-in-one approach. It packs everything—source control (Repos), CI/CD (Pipelines), and agile planning (Boards)—into a single, unified platform. This makes it a fantastic choice for teams, especially those already in the Microsoft world, who want a cohesive experience without bolting together multiple third-party tools.
On the other hand, AWS gives you the CodeSuite family (CodeCommit, CodeBuild, CodeDeploy, CodePipeline). Think of these as modular "building blocks." This gives you a ton of flexibility to swap components (e.g., use GitHub instead of CodeCommit), but it also means you'll spend more time writing YAML and IAM policies to connect the pieces into a complete pipeline. Google Cloud Build carves its own path by focusing on speed and simplicity, especially for container-native workflows, and it plugs in perfectly with other GCP services like Cloud Source Repositories and Artifact Registry.
A Technical Look at Managed Kubernetes
When you get into container orchestration, the battle between Amazon EKS, Azure Kubernetes Service (AKS), and Google Kubernetes Engine (GKE) is where things get really interesting. GKE is often seen as the gold standard, and for good reason—it’s where Kubernetes was born. It provides the most automated and opinionated cluster management out there, with game-changing features like Autopilot mode that handles the entire cluster infrastructure for you.
- Google Kubernetes Engine (GKE): GKE absolutely shines with its top-tier automation, handling things like node upgrades and repairs automatically. Its Autopilot mode takes this a step further by managing nodes, scaling, and security configurations, which is perfect for teams who just want to focus on their workloads.
- Azure Kubernetes Service (AKS): AKS strikes a great balance, offering strong features and fantastic developer tooling integrations, particularly with Visual Studio Code and GitHub Actions. Its security posture, backed by Azure Policy and Azure AD integration for RBAC, is a major plus for enterprises.
- Amazon Elastic Kubernetes Service (EKS): EKS delivers the most "vanilla" upstream Kubernetes experience. This gives your team maximum control and flexibility, but it also means you carry more of the operational burden for configuring add-ons (like networking and observability) and managing node groups.
Of course, no matter which cloud you choose, building efficient DevOps practices is key. Understanding the best strategies for optimizing your software project workflow is fundamental to making any of these tools work well for you.
To give you a clearer picture, here's a technical breakdown of how the managed Kubernetes services stack up.
Managed Kubernetes Service Feature Comparison
This table dives into the nitty-gritty differences between the "big three" managed Kubernetes offerings. Pay close attention to the level of automation and control each one provides, as that’s often the deciding factor.
| Feature | Amazon EKS (AWS) | Azure Kubernetes Service (AKS) | Google Kubernetes Engine (GKE) |
|---|---|---|---|
| Control Plane Management | Fully managed, but requires more user configuration for add-ons (e.g., CNI plugins, ingress controllers). | Fully managed by Azure with a strong focus on security and policy integration. Free control plane. | Fully managed, with an optional Autopilot mode that also manages worker nodes and their configuration. |
| Node Management | Self-managed or managed node groups. High degree of user control over AMIs and instance types. | Managed node pools with auto-scaling and automatic OS patching (unattended-upgrades). | Fully automated node management in Standard mode (auto-repair, auto-upgrades), fully abstracted in Autopilot. |
| Upstream Alignment | Closest to upstream Kubernetes, offering maximum portability and control. Certified Kubernetes Conformant. | Largely aligned with upstream but includes Azure-specific integrations (e.g., Azure AD). | Opinionated, with advanced features (e.g., Workload Identity) and optimizations beyond upstream Kubernetes. |
| Ease of Use | Steeper learning curve; requires more hands-on operational management using tools like eksctl. |
Balanced; simplified cluster creation and strong developer tooling integrations. | Easiest to get started, especially with Autopilot abstracting away infrastructure concerns. |
| Ecosystem Integration | Deeply integrated with AWS services like IAM (via IRSA), VPC, and ELB. | Tightly integrated with Azure AD, Azure Monitor, and Azure Policy. | Seamless integration with GCP's monitoring (Cloud Operations), logging, and IAM (Workload Identity). |
As you can see, the "best" choice really depends on what your team is trying to achieve.
When it comes to serverless containers, the choice between AWS Fargate, Azure Container Instances (ACI), and Google Cloud Run is just as important. Fargate is deeply woven into the AWS ecosystem (ECS and EKS), ACI is ideal for simple, single-container jobs, and Cloud Run is a beast at request-based scaling (including scale-to-zero), making it super cost-effective for event-driven or HTTP microservices.
So, what's the bottom line? GKE's advanced automation makes it a top pick for teams going all-in on Kubernetes. AKS is a powerful contender if you're prioritizing developer experience and enterprise security integrations. And EKS is the right fit for organizations that need fine-grained control and want an environment that stays close to the upstream Kubernetes project.
Choosing the Right Cloud for Your Technical Use Case
Alright, let's get down to brass tacks. You've seen the feature lists, the pricing models, and the performance charts. Now it's time to map your actual engineering challenges to the right platform. This is where the rubber meets the road in the AWS vs Azure vs GCP debate—moving beyond specs and into real-world scenarios.
If you're a large enterprise staring down a mountain of legacy systems, Azure often feels like the path of least resistance. Its native integration with the Microsoft world—think Active Directory and Windows Server—can turn a potentially brutal lift-and-shift migration into a much smoother process. On the flip side, startups that need a massive, mature toolbox from day one usually gravitate toward AWS. It's the incumbent for a reason; there’s a proven, ready-made service for just about any problem you can throw at it.
Data-Intensive and Hybrid Strategies
But what if your world revolves around data? For workloads heavy on analytics and machine learning, GCP has a serious technical edge. Its leadership in Kubernetes with GKE, its phenomenal serverless data warehouse BigQuery, and its AI/ML services make it a true powerhouse for any data-first application. If you're building in that space, exploring our deep dive into https://opsmoon.com/services/gcp is a great starting point for your architecture team.
This decision tree gives you a simplified visual for how to think through the process based on your workload, compliance needs, and budget.
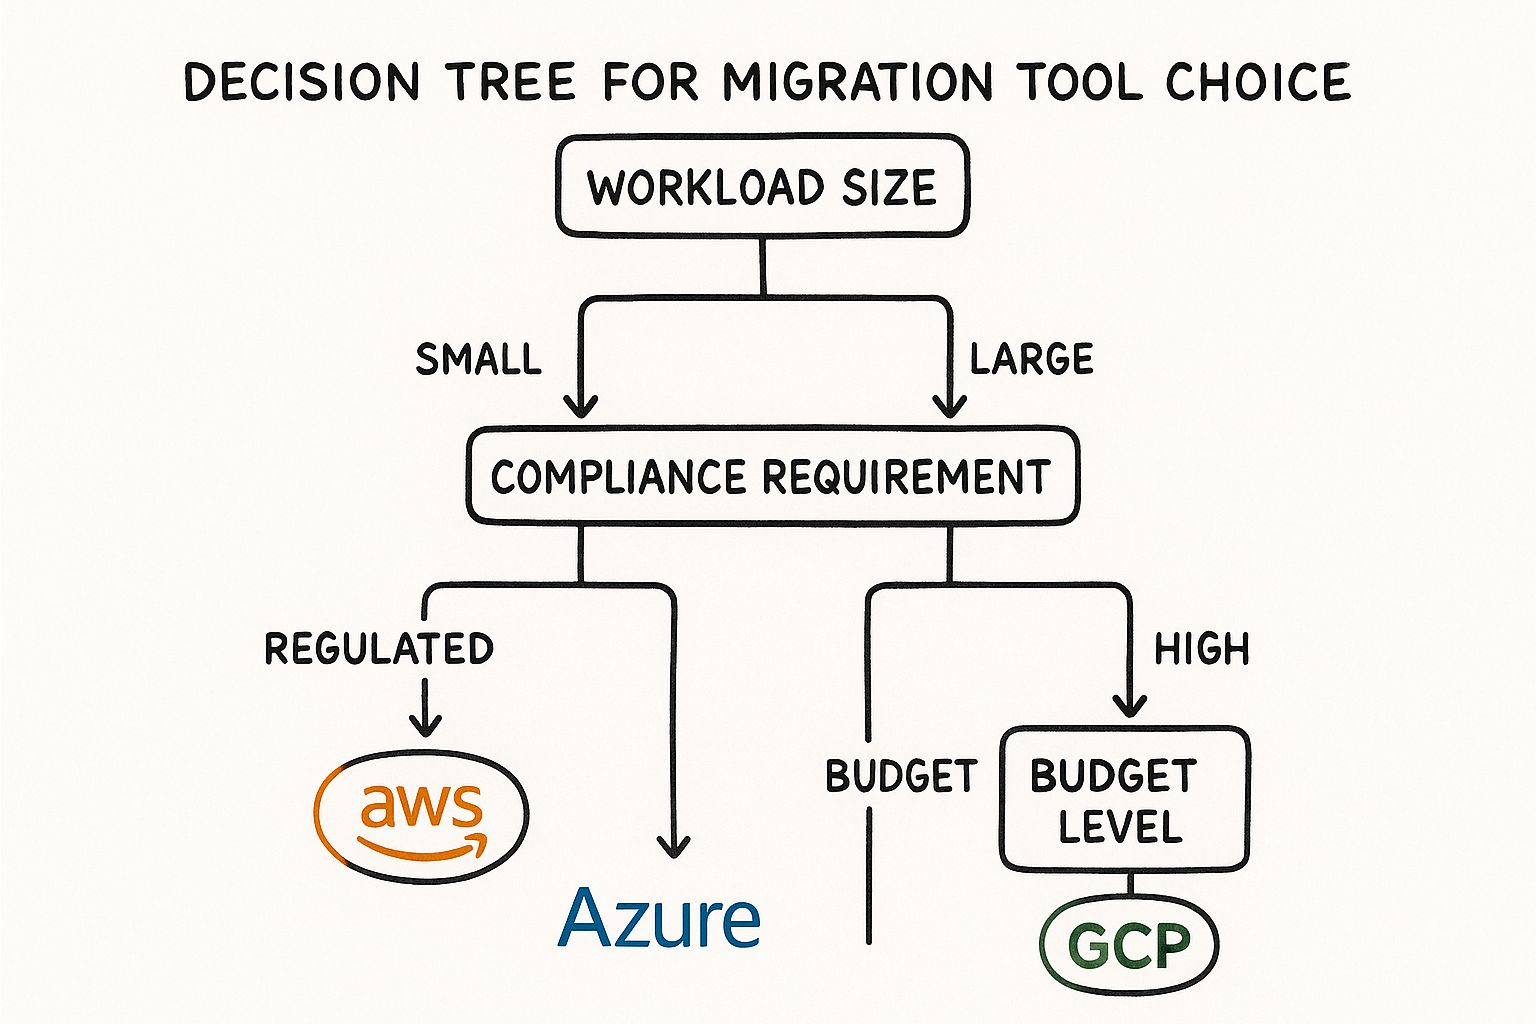
As you can see, budget and compliance can easily push you toward one provider, even if the workloads look similar on the surface. While you're weighing the options, it’s always a good idea to step back and appreciate the broader cloud computing benefits and how they impact your team’s efficiency.
Don't forget, it's not always an all-or-nothing game. Hybrid and multi-cloud strategies are becoming the norm, with tools like Google's Anthos and Azure Arc designed to give you a single pane of glass across different environments. Anthos offers a consistent Kubernetes platform that can run anywhere, while Arc extends Azure's management and governance tools (like Azure Policy) into your on-premise servers and even other clouds.
The AI explosion has also shaken things up quite a bit. Since OpenAI dropped GPT-4, Azure's market share has jumped, cementing its place as the go-to for AI-driven enterprises, though Google Cloud has also made some impressive gains.
Got Questions? We've Got Answers
When you're comparing AWS, Azure, and GCP, the final choice often boils down to a few very specific, nitty-gritty questions. I've pulled together the most common ones I hear from engineers and architects to help you nail down that final decision.
Which Cloud is Actually the Cheapest for a Startup?
For startups, GCP often has the edge on pricing. The big reason is its per-second billing for all VMs and a pretty generous free tier that includes an e2-micro instance.
Google's Sustained Use Discounts also kick in automatically after a VM runs for more than 25% of a month. This is a huge deal for startups because you get lower costs for long-running workloads without having to commit upfront via Reserved Instances (AWS) or Savings Plans (Azure)—perfect when cash flow is unpredictable.
How Do the Serverless Options Really Stack Up?
When we're talking serverless functions, it's all about cold start latency and ecosystem integration. AWS Lambda is the most mature platform with the broadest feature set and integrations, but you can still feel those cold starts, especially for languages like Java within a VPC. Azure Functions has excellent integration with the Microsoft developer ecosystem, including Visual Studio.
But honestly, Google Cloud Functions (2nd gen) often feels a bit snappier and is built on top of Cloud Run and Eventarc, giving it more power under the hood.
If you're running containerized microservices and want serverless simplicity with minimal cold start pain, Google Cloud Run is the clear winner. It's built on Knative, can scale down to zero, and is incredibly cost-effective for request-based workloads. AWS Fargate is a close competitor but doesn't scale to zero, making it more expensive for idle services.
Who's Got the Best Tools for Multi-Cloud and Hybrid Setups?
Azure is the undisputed leader here with Azure Arc. Arc lets you use the Azure control plane to manage resources running anywhere—on-prem, at the edge, even on AWS and GCP. It gives you a single pane of glass for applying Azure Policy for governance and using Azure Monitor for observability.
Google Anthos is in the same ballpark, but it's very Kubernetes-focused, designed to manage K8s clusters across environments. Arc, on the other hand, can manage a much wider variety of resources, including VMs, SQL databases, and Kubernetes clusters, which is a huge plus for most hybrid enterprises.
For Enterprise Governance and Compliance, Who's the Safest Bet?
This one's easy: Azure has a clear advantage for enterprise governance. Thanks to its deep roots with Active Directory and powerhouse tools like Azure Policy and Management Groups, you get incredibly detailed, hierarchical control over security and compliance.
Microsoft has been in the enterprise game for decades. It shows. Their services feel like they were built from day one with tough regulatory requirements in mind, making them the go-to for banking, healthcare, and other highly regulated industries that require extensive audit trails and policy enforcement.
Ready to turn your cloud strategy into reality with the right team? OpsMoon connects you with the top 0.7% of global DevOps engineers to build and manage your infrastructure. Book a free work planning session and let's map out your next steps.