The Kubernetes Gateway API is the official, modern specification for managing traffic in Kubernetes, designed to supersede the legacy Ingress API. It introduces a completely new, role-based, and expressive model for routing that directly addresses the complex requirements of modern microservice environments.
Why We Needed to Move on From Ingress
For years, if you wanted to expose your Kubernetes services to external traffic, you had one main option: the Ingress resource. It was the default choice, and for a while, it was sufficient. But as applications evolved into distributed microservice architectures, the limitations of its design became major operational liabilities.
For platform engineers and developers alike, Ingress went from being a simple tool to a significant bottleneck. The Kubernetes community recognized these shortcomings, leading to the creation of the Kubernetes Gateway API. This wasn't just an incremental update; it was a fundamental redesign, engineered from the ground up to provide a robust, extensible, and portable traffic management framework.
The Ingress Headache: Technical Limitations We All Felt
The fundamental problem with the Ingress API was its overly simplistic and ambiguous specification. It provided basic host and path-based routing for HTTP traffic, but its standard capabilities stopped there. Any feature beyond that—like traffic splitting, header manipulation, or mTLS—required vendor-specific annotations.
This led to several critical, real-world pain points:
Annotation Hell and Vendor Lock-in: Needed to implement a canary release? Traffic splitting? Header rewrites? Every Ingress controller, from NGINX to Traefik to HAProxy, implemented these features using a unique, proprietary set of annotations. Your
Ingressmanifests became non-portable, tightly coupling your routing logic to a specific controller and making it extremely difficult to switch implementations or maintain consistency across different clusters.The Permission Bottleneck: The monolithic nature of the
Ingressobject meant it was typically managed by a central infrastructure team. If a developer needed a simple routing change for a new service, they had to open a ticket and wait for an operator to apply the change. This created a huge operational bottleneck, slowing down development velocity. There was no safe, built-in mechanism for delegating route management to application teams.Not Built for Modern Routing: The Ingress specification itself lacked any standard, portable way to define common traffic patterns like A/B testing, traffic mirroring, or weighted load balancing. While these could be hacked together with annotations, the solutions were always clunky, inconsistent, and vendor-specific.
Ingress was designed for a simpler era of monolithic applications managed by a single cluster administrator. It was never intended for the complex, multi-team, multi-protocol reality of today's cloud-native engineering.
A Modern Successor for a Complex World
The Kubernetes Gateway API was created to solve these exact problems. Think of Ingress as a basic four-way traffic light—it works for a simple intersection. The Gateway API, in contrast, is a full-blown air traffic control system, designed to manage countless routes, complex protocols, and multiple teams operating concurrently in the same shared infrastructure.
This shift from a simplistic tool to a comprehensive framework explains its rapid adoption. The project achieved General Availability (GA) for core features in October 2023, released version 1.1 in May 2024, and is on track to become the de-facto standard for all new clusters by 2026. This isn't just a minor update; it's the industry's official acknowledgment that the original Ingress API from 2015 is no longer sufficient. For a deeper dive into what's next, you can check out the definitive guide to Kubernetes Gateway API adoption.
At its core, the Gateway API introduces a role-oriented architecture. It cleanly separates the responsibilities of provisioning infrastructure from managing application routing, empowering different teams to own their respective domains. This shift from a monolithic, all-or-nothing model to a collaborative, composable one is precisely why it represents the future of networking in Kubernetes.
Ingress vs Gateway API Technical Comparison
To put it plainly, the Gateway API is a major architectural leap forward. This table provides a side-by-side technical comparison highlighting the key differences between the old and new specifications.
| Feature | Ingress API | Kubernetes Gateway API |
|---|---|---|
| Architecture | Monolithic (single Ingress object) |
Role-oriented and composable (GatewayClass, Gateway, *Route) |
| Permission Model | Centralized, typically owned by cluster administrators | Granular and delegatable, allowing developers to safely manage their own application routes |
| Protocol Support | Primarily HTTP/HTTPS | Native support for HTTP, HTTPS, TCP, UDP, and gRPC (extensible for more) |
| Advanced Routing | Relies on non-standard, vendor-specific annotations | Standard, portable fields for traffic splitting, header modification, mirroring, and more |
| Portability | Low; configurations are locked into a specific Ingress controller | High; core features are part of the standard API, ensuring configurations are portable |
| Cross-Namespace Routing | Not a standard feature; often implemented with non-standard workarounds | A core feature; HTTPRoute can safely attach to a Gateway in a different namespace |
| Extensibility | Limited to controller-specific annotations | Designed for extensibility with well-defined extension points like policyAttachment and filters |
As you can see, the Gateway API isn't just an "Ingress v2." It's a completely different and more robust approach designed for the way we build and run applications today.
Diving Into the Gateway API's Architecture and CRDs
To truly understand the Kubernetes Gateway API, you must look beyond basic routing and appreciate the elegance of its architecture. It's built on a role-based model that cleanly separates infrastructure concerns from application concerns. This design was a deliberate choice to resolve the organizational friction and permission bottlenecks inherent in the legacy Ingress model.
This separation of duties is implemented through a set of key Custom Resource Definitions (CRDs). Each CRD maps to a specific role—infrastructure provider, cluster operator, or application developer—allowing teams to manage their domain independently and securely. It's a significant improvement for both operational security and development velocity.
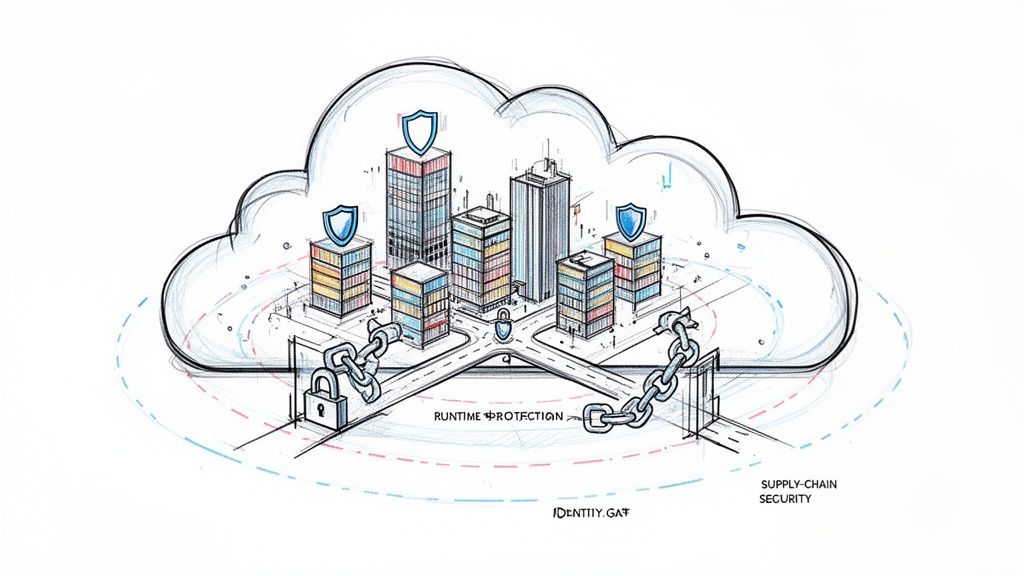
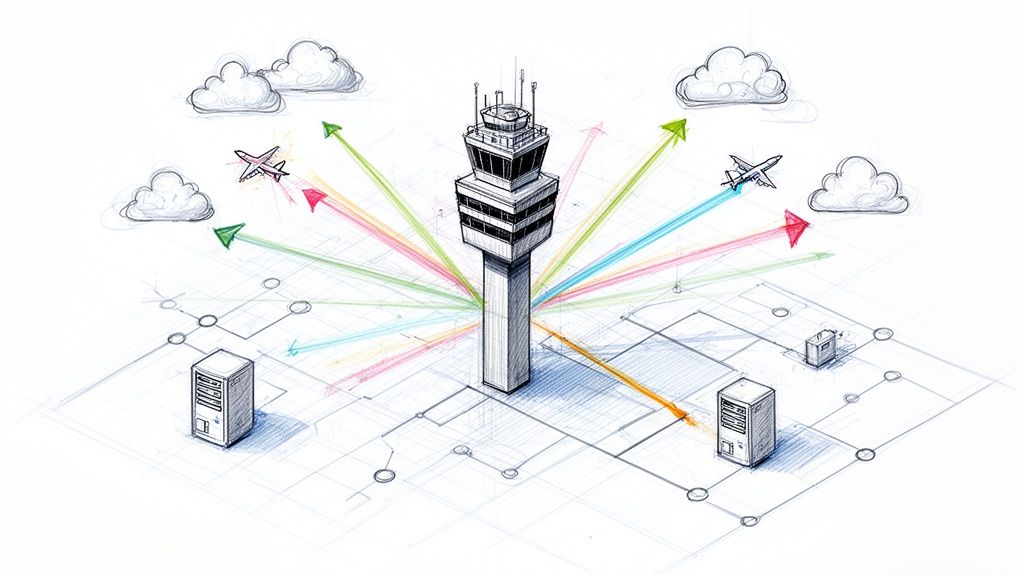
This image really drives home the shift from the old, all-in-one Ingress model to the new, layered world of the Gateway API.

You can see how we've moved from a simple "traffic light" (Ingress) to a sophisticated "air traffic control tower" (Gateway API) that gives us far more precise control over our traffic.
The Three Core Roles
The best way to understand the architecture is to think about its three main resource types. It’s a control hierarchy, where each level has a distinct job handled by a different person.
I like to use the analogy of setting up a physical network appliance in a data center:
GatewayClassis the Blueprint: This is like the schematic for a load balancer. It defines a type of gateway available in the cluster, specifying its capabilities and the controller that brings it to life. This is the job of an infrastructure provider, like a cloud vendor or a service mesh company.Gatewayis the Deployed Appliance: This is the actual, provisioned instance of aGatewayClass. Think of it as the physical box you've plugged in at the edge of your network, listening for traffic on certain ports. Cluster operators are the ones who deploy and manage these.*Routeis the Configuration Rule: These resources are the specific routing rules you apply to the appliance. They define how traffic gets from theGatewayto your backend services. Application developers create resources likeHTTPRouteorTCPRouteto point traffic to their apps.
This model is secure by design. A developer can create an HTTPRoute all day long, but it won't do anything until a cluster operator explicitly "attaches" it to a Gateway. This simple step prevents teams from accidentally exposing services or messing with someone else's traffic flow.
The core idea behind the Kubernetes Gateway API is separation of concerns. It lets infrastructure providers, cluster operators, and application developers each manage their own domain without stepping on each other's toes.
A Closer Look at the Primary CRDs
Let's break down what each of these CRDs actually does in practice.
GatewayClass
Everything starts with the GatewayClass. It’s a cluster-scoped resource that acts as a template. It informs Kubernetes which controller is responsible for implementing the configuration for any Gateways that reference it. You can have multiple GatewayClass resources in a cluster, each pointing to a different ingress technology—maybe one for Istio, another for Contour, and a third for your cloud provider's native load balancer.
Gateway
A Gateway resource is a request to provision a real, live load-balancing entrypoint. A cluster operator creates a Gateway and links it to a GatewayClass. They then define one or more listeners—the specific ports, protocols, and hostnames the proxy will listen on. This Gateway resource represents a logical instance of a data plane proxy.
HTTPRoute and Other Route Types
This is where application developers work. An HTTPRoute attaches to a Gateway and specifies the rules for directing HTTP/S traffic. These rules can match on hostnames, paths, headers, or query parameters and then forward the traffic to one or more Kubernetes Services.
The Gateway API is protocol-aware, offering different *Route types for different use cases:
HTTPRoute: For standard L7 routing of HTTP and HTTPS traffic.TCPRoute: For handling raw L4 TCP streams, bypassing HTTP-level processing.UDPRoute: The L4 equivalent for UDP datagrams.GRPCRoute: Provides specific L7 routing controls for gRPC traffic, such as method-based routing.TLSRoute: Enables routing of encrypted traffic at L4 using Server Name Indication (SNI) data, without terminating the TLS connection on the gateway itself.
This clean, role-based structure, built on these composable CRDs, is what makes the Kubernetes Gateway API so powerful. It’s exactly the kind of adaptable tool we need for today's complex cloud-native systems.
Putting Advanced Traffic Routing Into Practice
Enough with the theory. Let's get our hands dirty and see how these Gateway API concepts translate into actual, working configurations. We’ll walk through some annotated YAML for the most common routing patterns you'll use every day, starting with the basics and moving up to the really powerful stuff that makes modern DevOps possible.
These examples show you exactly how to set up an HTTPRoute and hook it into a Gateway, giving you the practical building blocks for your own production setup.
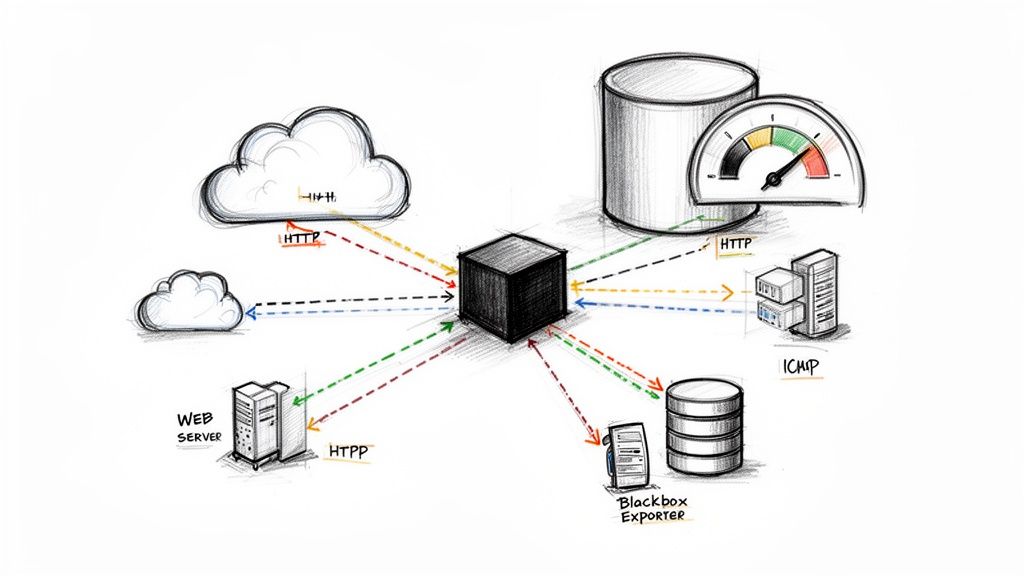
The diagram below gives you a bird's-eye view of how the Gateway API can intelligently manage traffic for A/B tests or canary deployments.

You can see a Gateway taking incoming requests and splitting them between two versions of a service. At the same time, it’s mirroring some of that traffic over to a test environment—all defined with a few simple, declarative rules.
Host and Path-Based Routing
The absolute bread and butter of any ingress system is directing traffic based on the request's hostname and URL path. The Gateway API handles this with a clean, portable approach.
Let's say you're running a few services. You need requests for api.example.com/store to hit your store-api service, while requests for api.example.com/users should go to the user-accounts service. Simple enough.
Here’s the HTTPRoute manifest to implement this logic:
apiVersion: gateway.networking.k8s.io/v1
kind: HTTPRoute
metadata:
  name: multi-service-routing
  namespace: applications
spec:
  parentRefs:
  - name: shared-gateway # The Gateway this route attaches to
    namespace: networking # Gateway can be in another namespace
  hostnames:
  - "api.example.com"
  rules:
  - matches:
    - path:
        type: PathPrefix
        value: /store
    backendRefs:
    - name: store-api-service
      port: 8080
  - matches:
    - path:
        type: PathPrefix
        value: /users
    backendRefs:
    - name: user-accounts-service
      port: 8080
Notice the parentRefs section. It explicitly attaches this route to a Gateway named shared-gateway residing in the networking namespace. This ability to reference resources across namespaces is a game-changer. It allows an infrastructure team to own and manage the gateways while development teams can safely manage their own application routes in their own namespaces.
Traffic Splitting for Canary Deployments
This is where the Gateway API's native capabilities begin to shine. It has standard support for weighted traffic splitting, the core mechanism behind canary releases. This enables you to cautiously roll out a new service version to a small fraction of users before committing to a full deployment.
Imagine you're ready to deploy v2 of your store-api. To mitigate risk, you decide to send just 5% of live traffic to the new version, while the other 95% continues to flow to the stable v1.
apiVersion: gateway.networking.k8s.io/v1
kind: HTTPRoute
metadata:
  name: store-api-canary
  namespace: applications
spec:
  parentRefs:
  - name: shared-gateway
    namespace: networking
  hostnames:
  - "api.example.com"
  rules:
  - matches:
    - path:
        type: PathPrefix
        value: /store
    backendRefs:
    - name: store-api-v1-service
      port: 8080
      weight: 95 # 95% of traffic goes to the stable version
    - name: store-api-v2-service
      port: 8080
      weight: 5   # 5% of traffic goes to the new canary version
The logic is defined declaratively in the weight field within backendRefs. The Gateway API controller automatically configures the data plane to distribute traffic according to these weights. This declarative nature is perfect for GitOps and CI/CD automation; you can create a simple script to programmatically increase the v2 weight as monitoring dashboards confirm its stability.
Header-Based Routing for Feature Flagging
Sometimes, host and path matching is insufficient. You need more granular control. Header-based routing is ideal for this, allowing you to enable features for internal testers, specific user segments, or A/B testing cohorts.
Let's say you want any request containing the HTTP header X-Canary-User: true to be routed directly to your new v2 service, regardless of the global traffic split.
Using header matches lets you build fine-grained rules so your developers and QA teams can test new code in production without affecting regular users. For any team practicing agile development, this isn't just a nice-to-have; it's essential.
Here's the YAML to set this up:
apiVersion: gateway.networking.k8s.io/v1
kind: HTTPRoute
metadata:
  name: store-api-feature-flag
  namespace: applications
spec:
  parentRefs:
  - name: shared-gateway
    namespace: networking
  hostnames:
  - "api.example.com"
  rules:
  - matches: # This rule has higher precedence
    - path:
        type: PathPrefix
        value: /store
      headers:
      - type: Exact
        name: X-Canary-User
        value: "true"
    backendRefs:
    - name: store-api-v2-service # Users with the header go to v2
      port: 8080
  - matches: # This is the fallback rule for everyone else
    - path:
        type: PathPrefix
        value: /store
    backendRefs:
    - name: store-api-v1-service # All other users go to v1
      port: 8080
The Gateway API specifies that rules within an HTTPRoute are evaluated in order. Because the header-based rule is defined first, it takes priority. If a request arrives with the X-Canary-User: true header, it is immediately routed to store-api-v2-service. If the header is absent, the controller proceeds to the next rule, which routes the traffic to the default v1 service.
Traffic Mirroring for Risk-Free Testing
Traffic mirroring, also known as shadowing, is a powerful technique for production testing. It allows you to send a copy of live production traffic to a non-production service without affecting the user's request-response cycle. The client receives a normal response from the primary service, while in the background, your new service is validated against real-world traffic.
This is an incredibly effective way to verify the performance, correctness, and stability of a new version before it handles a single live request that matters.
You can configure this using a standard RequestMirror filter:
apiVersion: gateway.networking.k8s.io/v1
kind: HTTPRoute
metadata:
  name: store-api-mirroring
  namespace: applications
spec:
  parentRefs:
  - name: shared-gateway
    namespace: networking
  hostnames:
  - "api.example.com"
  rules:
  - matches:
    - path:
        type: PathPrefix
        value: /store
    filters:
    - type: RequestMirror
      requestMirror:
        backendRef:
          name: store-api-v3-staging-service # Mirrored traffic goes here
          port: 8080
    backendRefs:
    - name: store-api-v1-service # Primary traffic goes here
      port: 8080
With this configuration, every request to /store is handled by store-api-v1-service, which sends a response back to the client. Simultaneously, the gateway forwards a copy of that same request to store-api-v3-staging-service. This is a "fire-and-forget" operation; the gateway does not wait for a response from the mirrored service. This allows you to stress-test the v3 service with real traffic, analyze its logs and metrics, and confirm it's ready for production.
Choosing the Right Gateway API Implementation
First things first: The Kubernetes Gateway API isn't a tool you just install. It's a specification, a common language for managing traffic. This is a critical point because the controller you pick to implement that spec—the engine behind your GatewayClass—will define what's possible, and what's painful, for your entire network.
The choice comes down to your specific goals. Are you chasing raw L4 throughput, sophisticated L7 policy control, or a unified way to manage traffic flowing into and across your service mesh? The implementation you choose dictates your capabilities, so picking the right one is one of the most important architectural decisions you'll make.
Evaluating Key Implementations
A handful of strong contenders have emerged in the Gateway API space, each built on different technologies like Envoy or eBPF and bringing its own unique philosophy to the table. Let's break down some of the most common ones you'll run into.
Istio Gateway: If you're already running Istio or have it on your roadmap, using its native Gateway API support is a no-brainer. This lets you manage both north-south (ingress) and east-west (service-to-service) traffic with the same powerful control plane and CRDs. It creates one seamless experience, which is a huge win for operational sanity. You can learn more about this in our deep dive on Kubernetes service mesh.
Envoy Gateway: This is the "vanilla" implementation, sponsored directly by the Envoy proxy community. Envoy Gateway aims to be a lightweight, vendor-neutral, and true-to-the-spec controller. It's a fantastic choice if you want the power of Envoy focused purely on ingress, without the extra overhead of a full service mesh.
Cilium: Taking a totally different path, Cilium uses the power of eBPF to handle networking, security, and observability right inside the Linux kernel. Its Gateway API implementation reaps the benefits, delivering incredible performance (especially for L4 traffic) and deep network visibility. If you're running high-throughput, latency-sensitive workloads, Cilium is a top-tier candidate.
Kong Gateway: A veteran in the API gateway world, Kong brings its mature, enterprise-grade feature set to the Gateway API. It's packed with plugins for advanced authentication, rate limiting, and request transformations. For organizations whose needs go far beyond simple routing, Kong offers a battle-tested solution.
Traefik: Known for its simplicity and slick, dynamic configuration, Traefik is another popular choice with a solid Gateway API implementation. It has a reputation for being incredibly easy to get started with, making it a great fit for teams who need a powerful-yet-straightforward ingress solution up and running fast.
The Kubernetes Gateway API is driving a "multi-gateway" reality where 31% of organizations now run multiple API gateways to manage edge, internal, and specialized traffic. This trend reflects the growth of Kubernetes itself, with the market projected to surge from USD 2.57 billion in 2025 to USD 8.41 billion by 2031. Implementations like Envoy-native gateways offer full open-source compliance, while eBPF-powered Cilium provides high L4 performance for the 5.6 million developers who need deep observability. Discover more insights on this rapidly changing landscape from Kong.
A Framework For Your Decision
There's no single "best" implementation—only the one that’s best for you. The key is to match your primary needs to the core strengths of each tool. The table below offers a straightforward way to compare the leading options.
Technical Comparison of Gateway API Implementations
| Implementation | Core Technology | Key Strengths | Ideal Use Case |
|---|---|---|---|
| Istio | Envoy | Unified service mesh and ingress management | Teams needing consistent policy for both north-south and east-west traffic. |
| Envoy Gateway | Envoy | Lightweight, spec-compliant, vendor-neutral | Users who want a pure Envoy experience focused solely on the Gateway API. |
| Cilium | eBPF | High-performance L4 networking, deep kernel visibility | High-throughput environments where L4 speed and advanced observability are critical. |
| Kong | NGINX / Envoy | Mature API management features, extensive plugin ecosystem | Organizations with complex API policies, security, and transformation needs. |
| Traefik | Go | Simplicity, ease of use, dynamic configuration | Teams prioritizing a straightforward setup and rapid deployment for ingress. |
By identifying your main driver—whether that's integrating with a service mesh, achieving maximum network performance, or managing complex API policies—you can make a confident choice. This ensures the gateway you adopt will not only solve today's problems but also support your architecture as it grows.
Securing and Observing Your API Gateways
Your Gateway is the front door to your entire cluster. That makes locking it down and keeping a close eye on it non-negotiable.
The great thing about the Kubernetes Gateway API is that security and observability aren't just tacked on as an afterthought. They're baked right into the resource model. This lets you enforce solid security policies and get deep visibility right at the edge, exactly where traffic first hits your environment.
For platform teams and SREs, this is a massive step up. It finally gives us a declarative, zero-trust approach to security by default.

Enforcing Security at the Gateway
The Gateway API provides standard, portable mechanisms for securing the ingress layer. We can finally ditch the mess of vendor-specific annotations and define security policies directly in our Gateway and HTTPRoute resources.
TLS Termination and mTLS
The most fundamental security task is encrypting traffic with TLS. The Gateway API makes this declarative and straightforward by defining TLS configuration directly on the Gateway listener.
apiVersion: gateway.networking.k8s.io/v1
kind: Gateway
metadata:
  name: production-gateway
spec:
  gatewayClassName: my-gateway-class
  listeners:
  - name: https-default
    protocol: HTTPS
    port: 443
    tls:
      mode: Terminate
      certificateRefs:
      - kind: Secret
        name: my-tls-secret
This configuration instructs the gateway controller to terminate TLS for traffic on port 443 using the certificate and private key stored in the Kubernetes Secret named my-tls-secret.
For a stronger, zero-trust security posture, you can enforce mutual TLS (mTLS), where the client must also present a valid certificate to establish a connection. This is critical for securing internal APIs and service-to-service communication.
Let's be real, the need for built-in security is urgent. Over 60% of enterprises are already running Kubernetes, and new clusters get hit with automated probes within just 18 minutes of going live. On top of that, 67% of companies admit they delay application releases because of security headaches. The Gateway API's consistent policy model across AWS, Azure, and GCP is a game-changer for cutting through that complexity.
Attaching Security Policies
What about more advanced policies like JWT validation, rate limiting, or custom authentication? For this, the Gateway API provides a powerful extension mechanism called policyAttachment.
This allows platform teams to attach custom policy resources to a Gateway, an HTTPRoute, or even an entire namespace. It keeps the core API specification clean and focused while enabling implementations to offer rich, specific features. This extensible design is key to handling complex, real-world security requirements.
Of course, these gateway-level controls are just one piece of the puzzle. It's always a good idea to ground your strategy in broader API Security Best Practices to make sure all your bases are covered.
Achieving Deep Observability
If you can't see what's happening, you can't fix it when it breaks. The Gateway API ecosystem was designed from the ground up for deep observability, letting you export all the critical telemetry from your data plane.
Your chosen implementation—whether it's Istio, Cilium, or Contour—will expose the detailed metrics, logs, and traces you need.
Here’s a technical checklist for gateway observability:
- Metrics (The RED Method): Collect Rate (requests per second), Errors (count of 4xx/5xx responses), and Duration (request latency distributions like p50, p90, p99). These are essential for building dashboards and alerts.
- Logs: Configure structured access logs (e.g., JSON) for every request, capturing fields like source IP, HTTP method, path, user agent, response code, and upstream service. This data is invaluable for debugging and security analysis.
- Traces: Implement distributed tracing by ensuring your gateway generates and propagates trace headers (e.g., W3C Trace Context). This is the only way to visualize a request's end-to-end journey through a microservices architecture and pinpoint performance bottlenecks.
Typically, you'll integrate these signals into a standard observability stack: Prometheus for metrics, Grafana for dashboards, Fluentd or Loki for logging, and Jaeger or Zipkin for tracing.
By configuring your gateway controller to export data in standard formats like OpenTelemetry, you'll get the visibility you need to keep your services reliable and performing well. For a deeper dive on this, take a look at our guide on API Gateway Best Practices.
Speeding Up Your Gateway API Adoption with OpsMoon
Figuring out the technical side of the Kubernetes Gateway API is one thing. Actually implementing it in production to make a real difference for your business? That's a whole different ballgame. This is exactly where we come in—turning those complex architectural diagrams into a straightforward, actionable plan.
Whether you're a CTO designing a brand new ingress strategy from the ground up or an engineering manager staring down a migration from a tangled legacy Ingress setup, the path forward can feel overwhelming. We kick things off with a free work planning session. In that meeting, we'll sit down with you, map out where you are today, figure out exactly what "success" looks like, and build a concrete roadmap to get your Gateway API deployment done right.
Expert Guidance from Day One
Trying to navigate the sea of Gateway API implementations, security policies, and observability tools requires some very specific, hard-won experience. One wrong turn—choosing the wrong controller or messing up the routing logic—can lead straight to performance headaches, security holes, and a mountain of operational costs later on. We help you sidestep those traps from the get-go.
At OpsMoon, our goal is to take the risk out of your move to the Gateway API. We make sure your setup isn't just technically correct, but also secure, fast, and budget-friendly, so you can actually ship software faster.
Our elite DevOps services are built to give you the exact support you need, right when you need it. We’ll help you make the smart architectural calls for your specific situation, ensuring your ingress strategy is a perfect match for your business objectives. For teams that want to level up their internal Kubernetes skills, our expert Kubernetes consulting services offer that targeted guidance.
Get Access to World-Class Kubernetes Talent
Let's be honest: finding engineers with deep, hands-on experience in modern Kubernetes networking is tough. It's a major bottleneck for a lot of companies. This is the exact problem we built our platform to solve.
OpsMoon’s Experts Matcher technology connects you directly with the top 0.7% of Kubernetes specialists from around the globe. These aren't just generalists; they're proven pros who are ready to jump in and help with:
- Advisory Services: Strategic advice to help you design the right Gateway API architecture from the start.
- Hands-On Implementation: We can take it from A to Z, from deploying the controller to setting up your most complex routing rules.
- Ongoing Management: Continuous support to manage, scale, and fine-tune your gateways once they're live in production.
When you work with OpsMoon, you're not just buying a service. You're getting a strategic partner who is 100% focused on making your Kubernetes Gateway API adoption a success.
Kubernetes Gateway API FAQ
Still have some questions rattling around? Let's clear up a few of the most common technical questions I hear about the Gateway API.
Is the Gateway API a Replacement for Service Mesh?
No, they are distinct but complementary technologies. They address different traffic patterns:
- The Gateway API is primarily designed for north-south traffic—traffic entering or leaving the Kubernetes cluster.
- A service mesh like Istio or Linkerd focuses on east-west traffic—communication between services inside the cluster.
A common and powerful pattern is to use both. An implementation like Istio's Gateway can manage ingress traffic at the edge, and then hand that traffic off to the service mesh to enforce mTLS, apply fine-grained authorization policies, and collect detailed telemetry for internal service-to-service communication.
Can I Use Both Ingress and Gateway API in the Same Cluster?
Absolutely. You can run an Ingress controller and a Gateway API controller side-by-side in the same cluster without conflict. This is the recommended approach for migrations. It allows you to incrementally move routes from your legacy Ingress setup to the new Gateway API implementation at your own pace, without a "big bang" cutover.
However, the long-term strategy for most organizations should be to standardize on the Gateway API for all new services and eventually deprecate the Ingress resources. The Gateway API provides a far more powerful, portable, and maintainable model for traffic management.
What Does "Portable" Mean for the Gateway API?
Portability is a core design goal and one of its most significant advantages. It means that the standard routing rules you define in resources like HTTPRoute will function identically across different Gateway API implementations.
For example, an HTTPRoute manifest defining a 90/10 weighted traffic split will produce the same behavior whether it is implemented by Istio Gateway, Cilium, or Kong.
This is a massive leap forward from Ingress, where any advanced feature was locked behind vendor-specific annotations. With the Gateway API, your routing logic is no longer coupled to a specific controller. This gives you the freedom to choose the best implementation for the job—and change it later—without having to rewrite your routing configurations.
Getting from theory to a solid, executable plan for the Gateway API is where the real work begins. At OpsMoon, we specialize in that. Our Experts Matcher connects you with the top 0.7% of Kubernetes talent worldwide to make sure your ingress strategy is secure, high-performing, and cost-effective from the get-go.
Ready to de-risk the transition? Let's start with a free work planning session at https://opsmoon.com.