In modern DevOps, feature flags have evolved from simple on/off switches to a strategic tool for mitigating risk, enabling progressive delivery, and driving data-informed development. However, without a disciplined approach, they can quickly introduce technical debt, operational complexity, and production instability. Moving beyond basic toggles requires a mature, systematic methodology.
This guide provides a technical deep-dive into the essential feature flagging best practices that separate high-performing engineering teams from the rest. We will break down seven critical, actionable strategies designed to help you build a robust, scalable, and secure feature flagging framework. You will learn not just what to do, but how to do it with specific architectural considerations and practical examples.
Prepare to explore comprehensive lifecycle management, fail-safe design patterns, clean code separation, and robust security controls. By implementing these advanced techniques, you can transform your CI/CD pipeline, de-risk your release process, and ship features with unprecedented confidence and control. Let's move beyond the simple toggle and elevate your feature flagging strategy.
1. Start Simple and Evolve Gradually
Adopting feature flagging doesn't require an immediate leap into complex, multi-variant experimentation. One of the most effective feature flagging best practices is to begin with a foundational approach and scale your strategy as your team's confidence and requirements grow. This method de-risks the initial implementation by focusing on the core value: decoupling deployment from release.

Start by implementing simple boolean (on/off) toggles for new, non-critical features. This allows your development team to merge code into the main branch continuously while keeping the feature hidden from users until it's ready. This simple "kill switch" mechanism is a powerful first step, enabling safe deployments and immediate rollbacks without redeploying code. For example, a new UI component can be wrapped in a conditional that defaults to false, ensuring it remains inert in production until explicitly activated.
Actionable Implementation Steps
To put this into practice, follow a clear, phased approach with specific code examples:
- Phase 1: Boolean Toggles (Release Toggles): Begin by wrapping a new feature in a simple conditional block. The
featureIsEnabledfunction should check against a configuration file (e.g.,features.json) or a basic feature flag service. The goal is to master the on/off switch.// Example: A simple boolean flag check if (featureIsEnabled('new-dashboard-2025-q3')) { renderNewDashboard(); } else { renderOldDashboard(); } - Phase 2: User-Based Targeting (Permissioning Toggles): Once comfortable with basic toggles, introduce targeting based on user attributes. Start with an allow-list of internal user IDs for dogfooding, passing user context to your evaluation function.
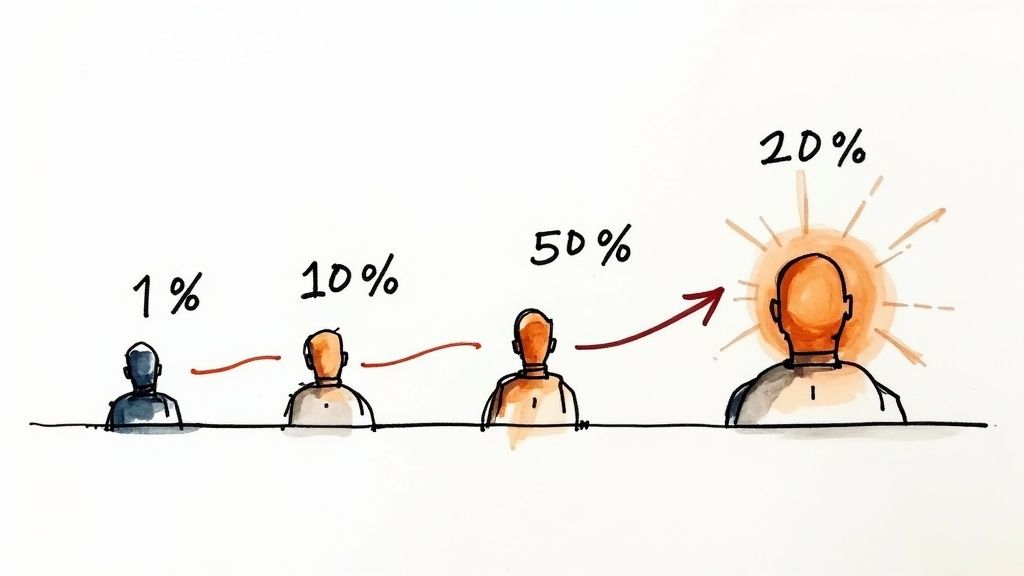
// Example: Passing user context for targeted evaluation const userContext = { id: user.id, email: user.email, beta_tester: user.isBetaTester }; if (featureIsEnabled('new-dashboard-2025-q3', userContext)) { renderNewDashboard(); } else { renderOldDashboard(); } - Phase 3: Percentage-Based Rollouts (Experiment Toggles): Evolve to canary releases by introducing percentage-based rollouts. Configure your flagging system to enable the feature for a small subset of your user base (e.g., 1%, 5%) by hashing a stable user identifier (like a UUID) and checking if it falls within a certain range. This ensures a consistent user experience across sessions.
This gradual evolution minimizes cognitive overhead. It allows your team to build robust processes, such as flag naming conventions and lifecycle management, before tackling the complexity of A/B testing or dynamic, attribute-based configurations.
2. Implement Comprehensive Flag Lifecycle Management
Without a disciplined management process, feature flags can accumulate into a tangled mess of technical debt, creating confusion and increasing the risk of system instability. One of the most critical feature flagging best practices is to establish a systematic lifecycle for every flag, from creation to its eventual removal. This ensures flags serve a specific, time-bound purpose and are retired once they become obsolete, a concept championed by thought leaders like Martin Fowler.
This lifecycle management approach prevents "flag sprawl," where outdated flags clutter the codebase and create unpredictable interactions. For instance, a temporary release toggle left in the code long after a feature is fully rolled out becomes a dead code path that can complicate future refactoring and introduce bugs. A robust lifecycle ensures your feature flagging system remains a clean, effective tool for controlled releases rather than a source of long-term maintenance overhead.
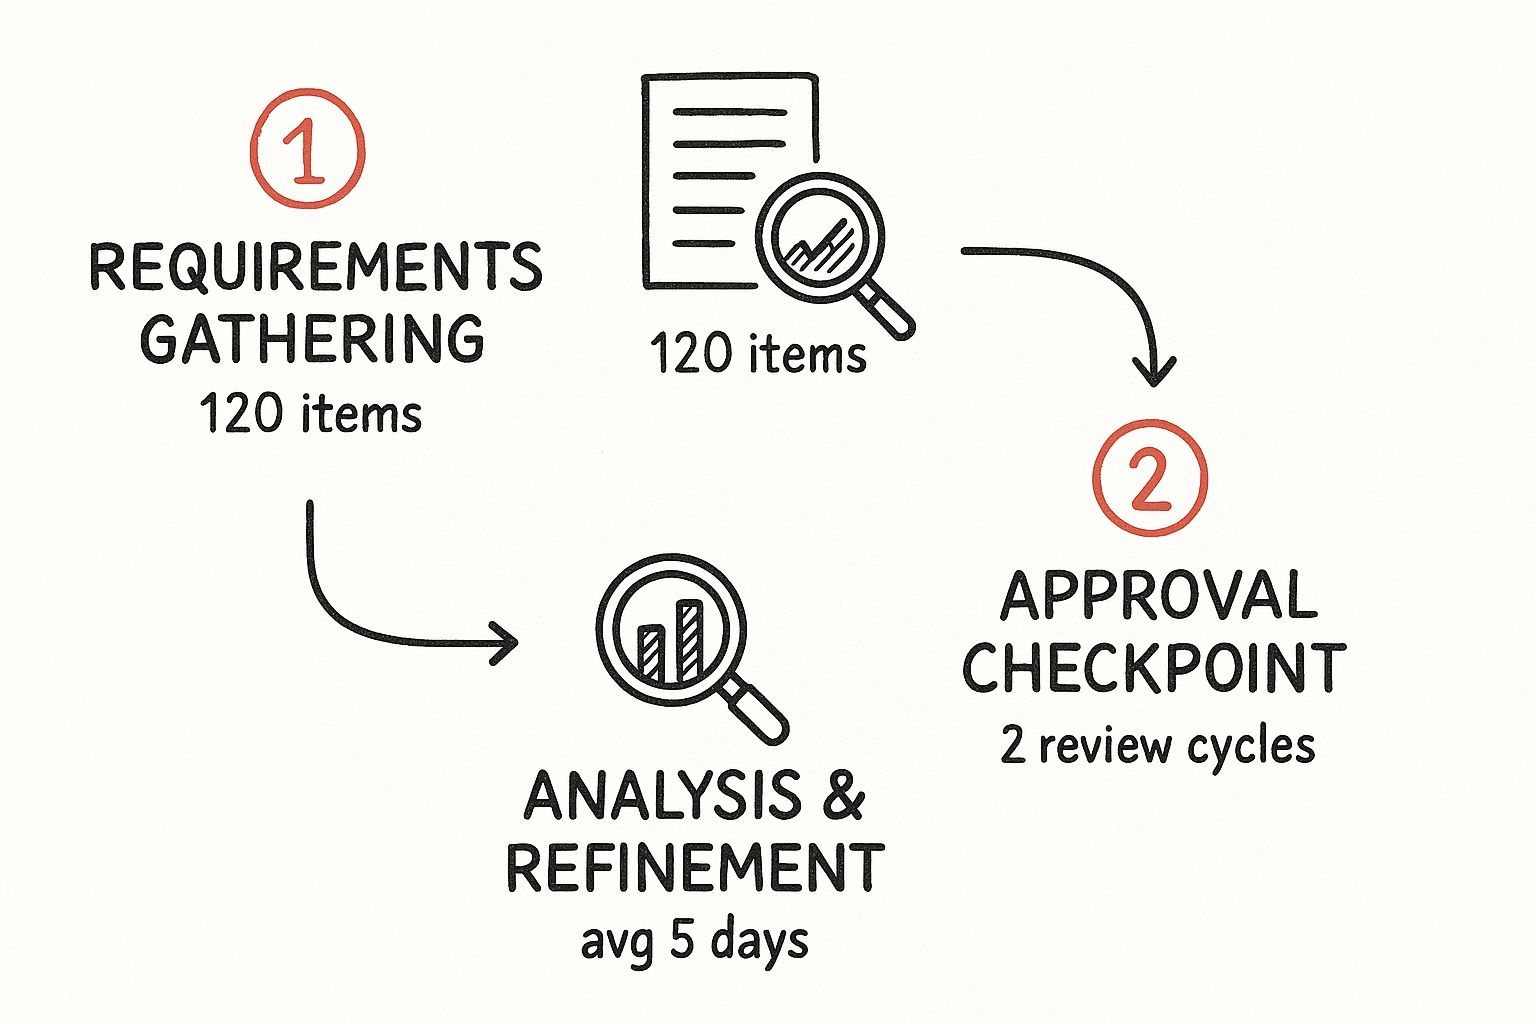
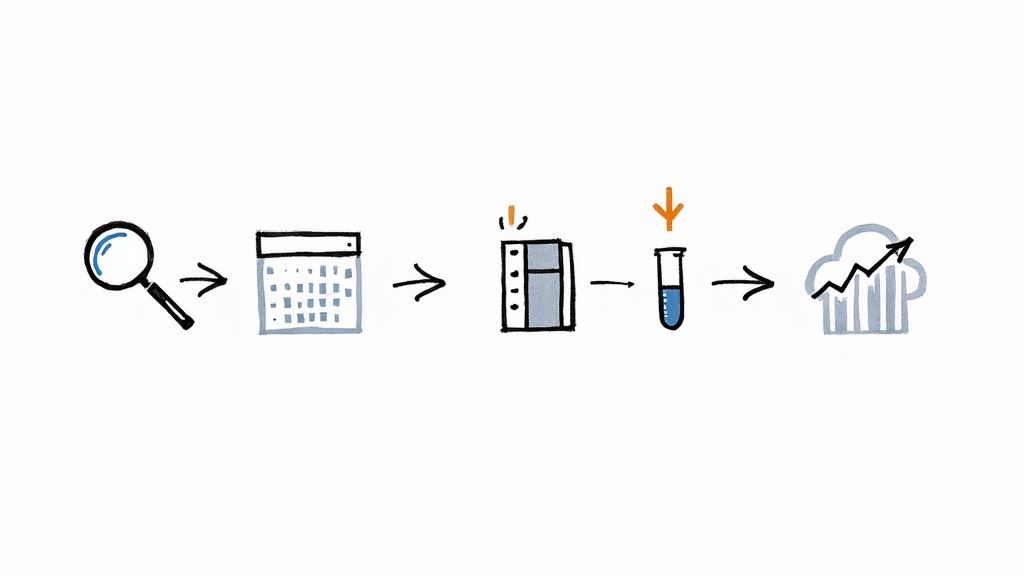
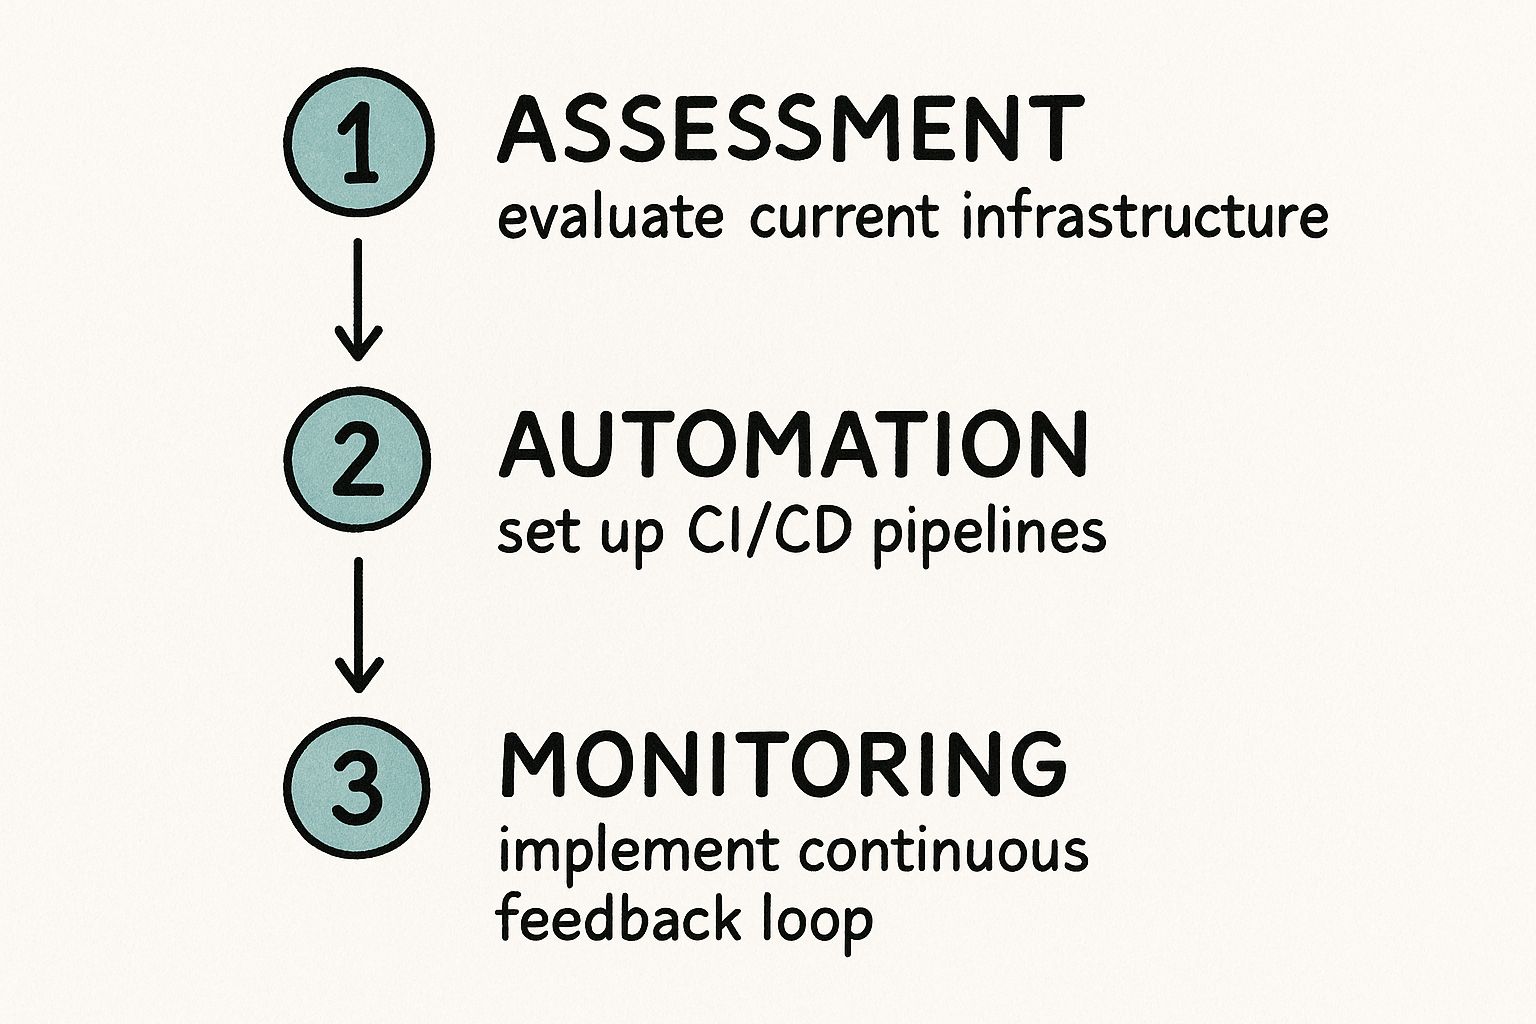
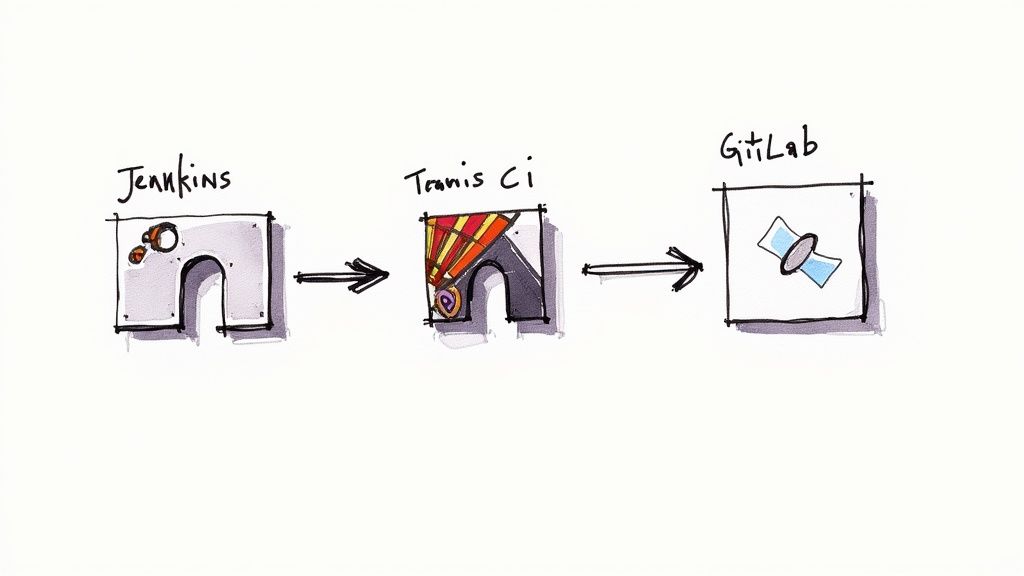
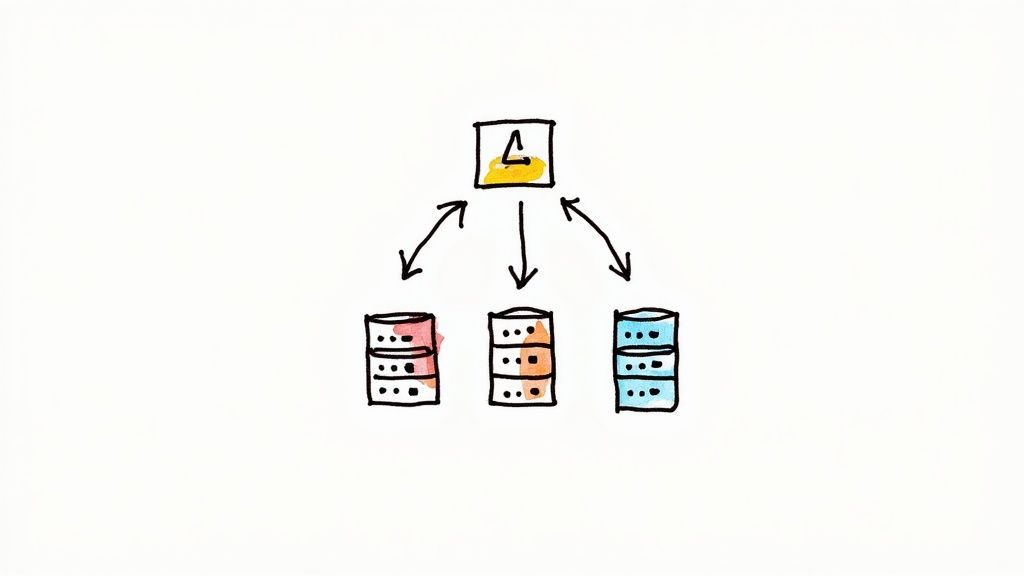
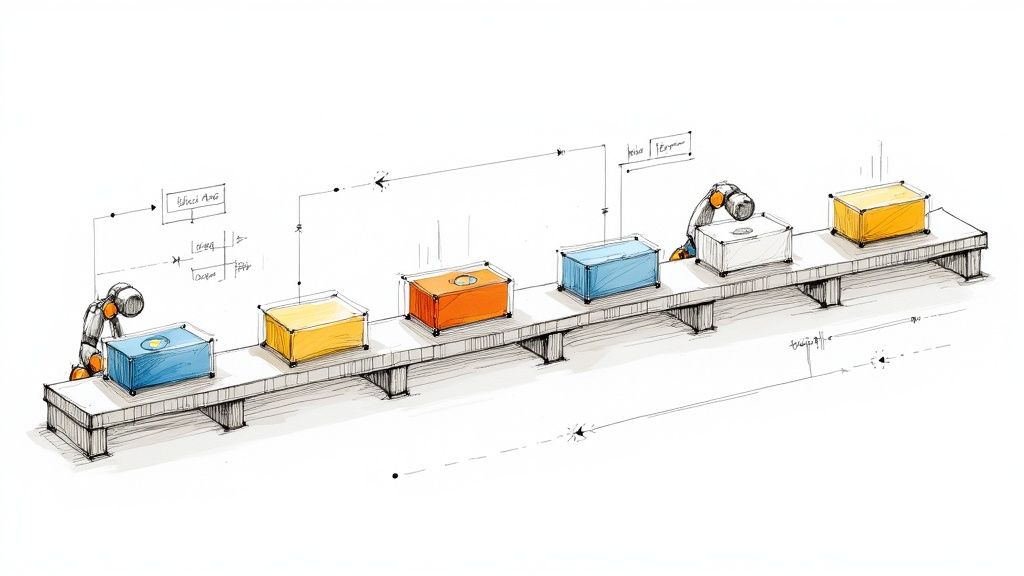
This process flow visualizes the foundational steps for a robust flag lifecycle.
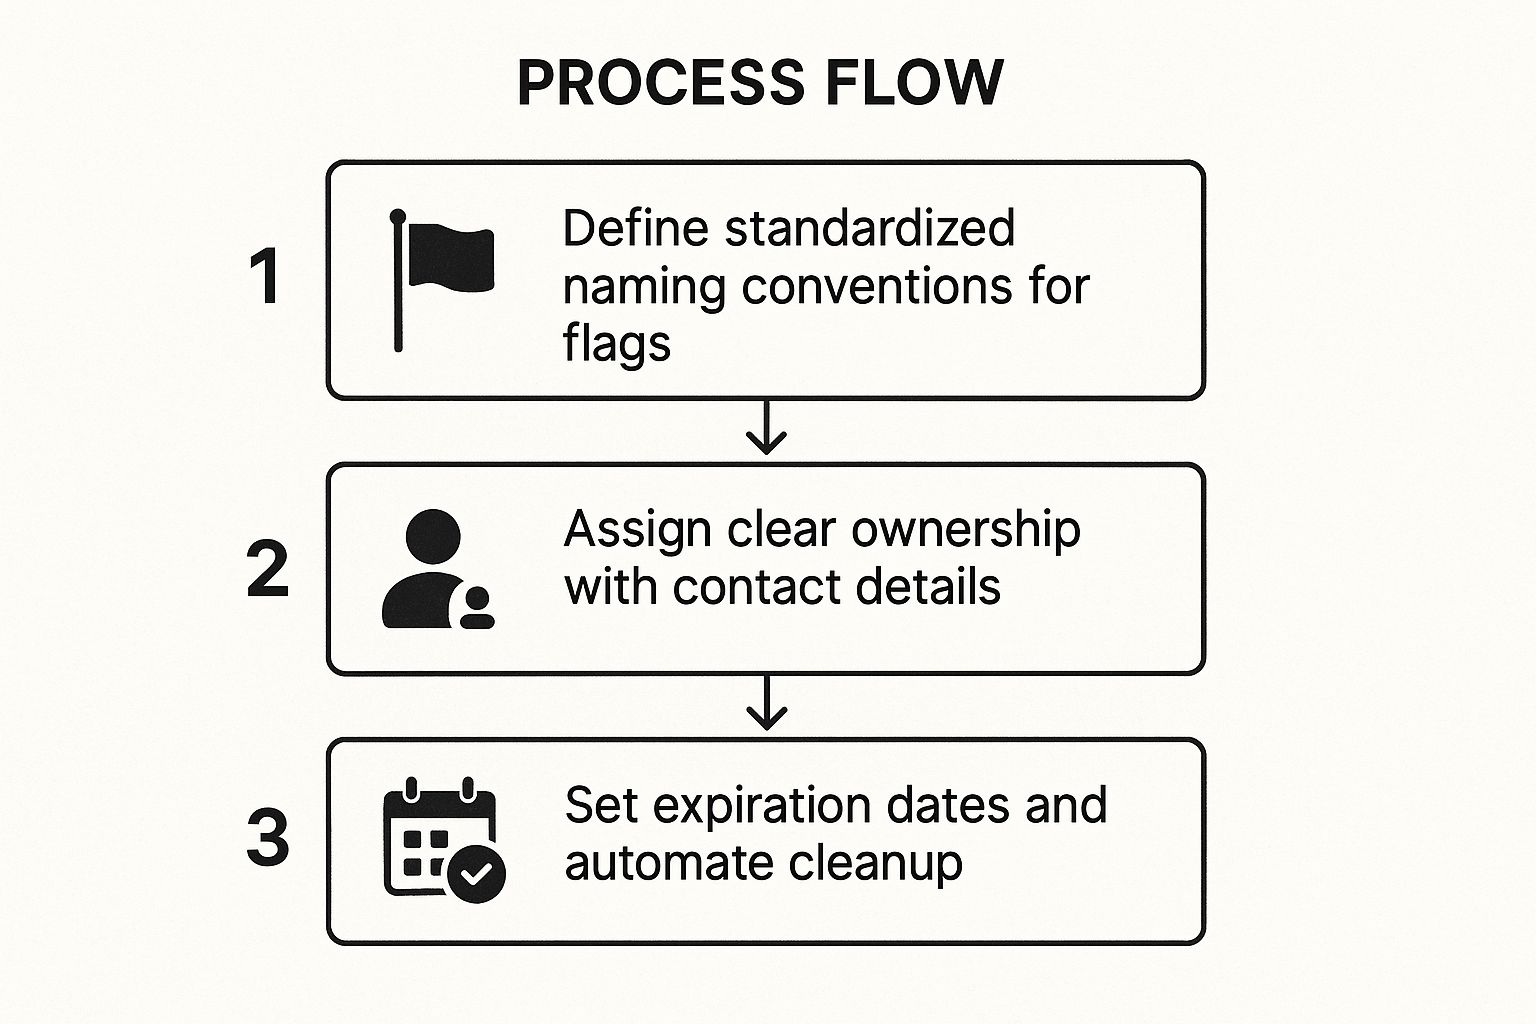
Following this standardized, three-step workflow ensures every flag is created with a clear purpose and an explicit plan for its removal.
Actionable Implementation Steps
To implement a comprehensive flag lifecycle, integrate these technical and procedural steps into your development workflow:
- Step 1: Standardize Naming and Metadata: Create a strict, machine-readable naming convention. A good format is
[type]-[scope]-[feature-name]-[creation-date], such asrelease-checkout-new-payment-gateway-2024-08-15. Every flag must also have associated metadata: a description, an assigned owner/team, a linked ticket (Jira/Linear), and a flag type (e.g.,release,experiment,ops). - Step 2: Assign Clear Ownership and Expiration: Each flag must have a designated owner responsible for its management and removal. Crucially, set a mandatory expiration date upon creation. Short-lived release toggles might have a TTL (Time To Live) of two weeks, while longer-term A/B tests could last a month. No flag should be permanent.
- Step 3: Automate Auditing and Cleanup: Implement automated tooling. Create a CI/CD pipeline step that runs a linter to check for code referencing expired flags, failing the build if any are found. Use scripts (e.g., a cron job) that query your flagging service's API for expired or stale flags and automatically create tech debt tickets for their removal. For more in-depth strategies, you can learn more about feature toggle management and its operational benefits.
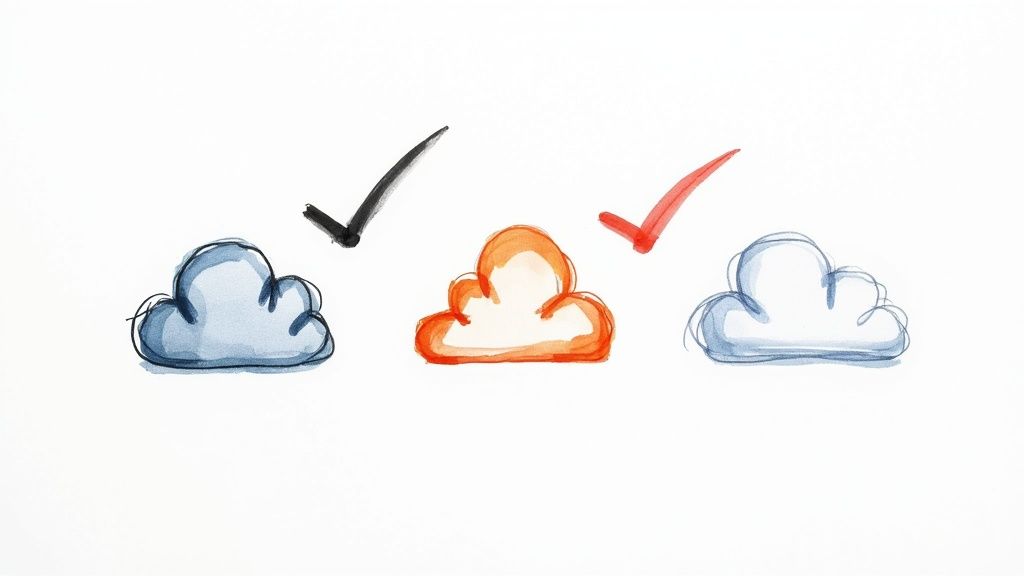
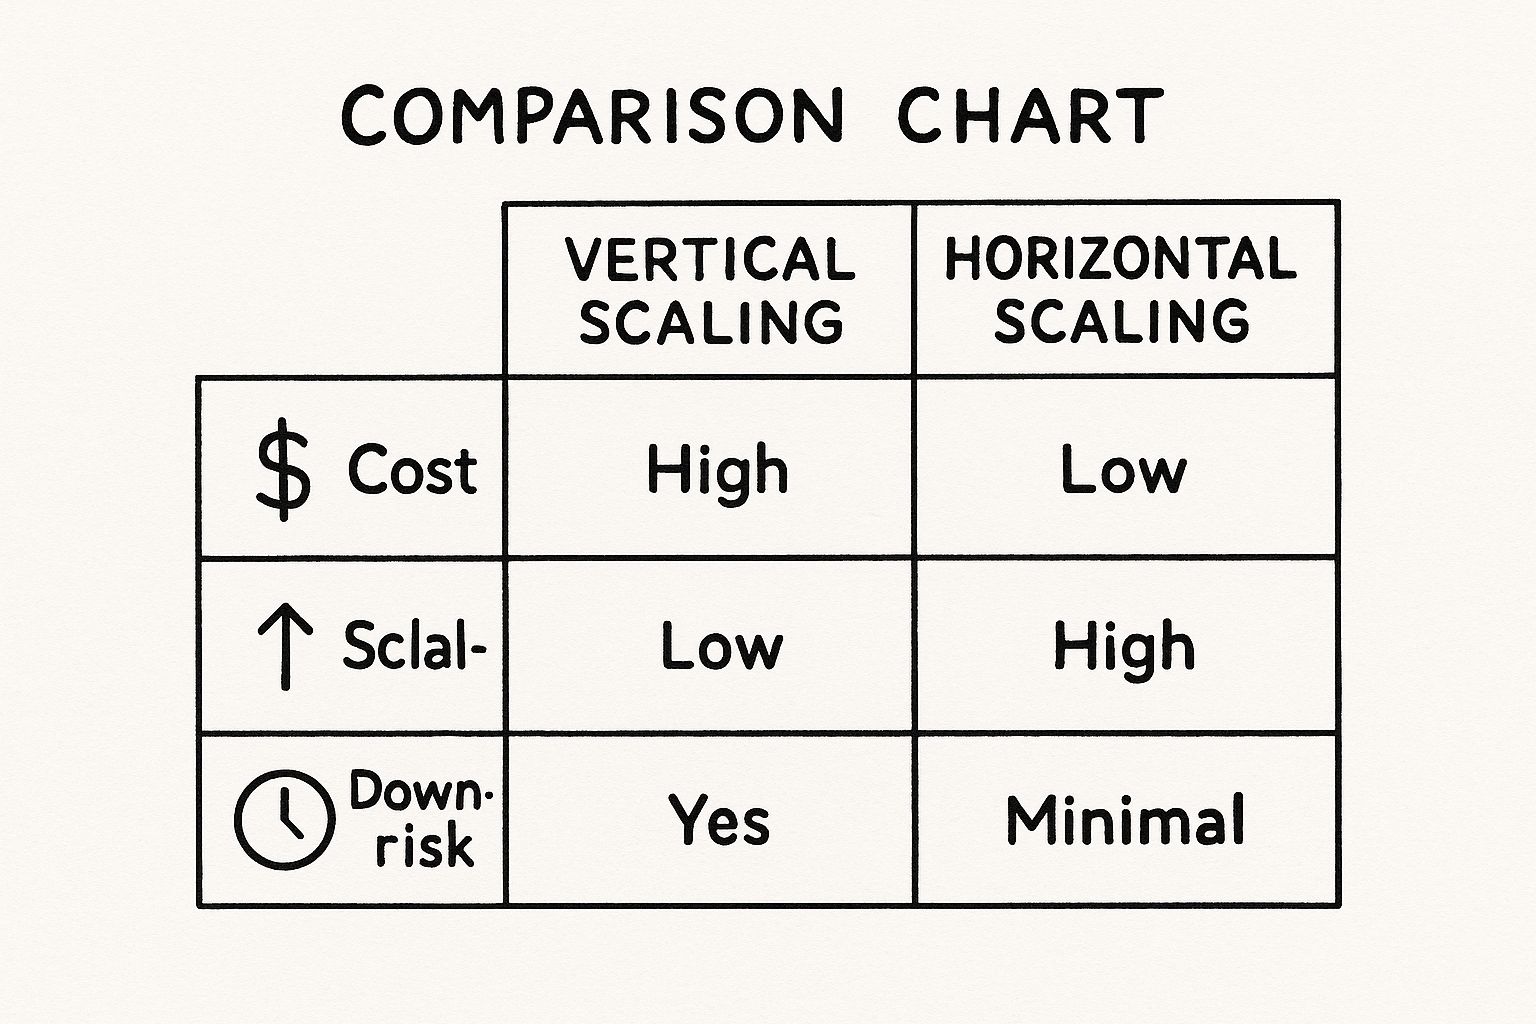
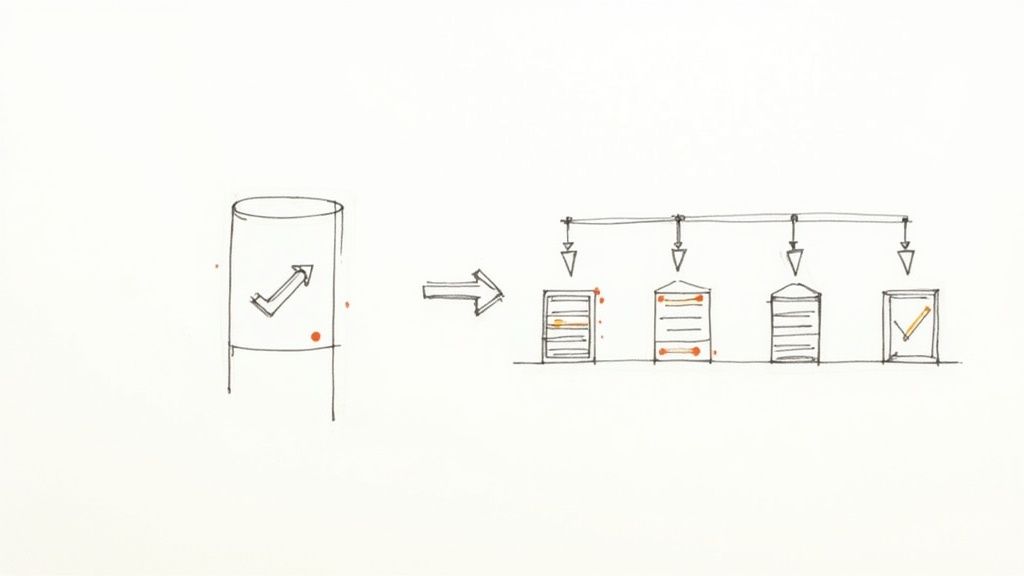
3. Use Progressive Rollouts and Canary Releases
Mitigating risk is a cornerstone of modern software delivery, and progressive rollouts are a powerful technique for achieving this. This strategy involves gradually exposing a new feature to an increasing percentage of your user base, allowing you to monitor its impact in a controlled environment. This is one of the most critical feature flagging best practices as it transforms releases from a high-stakes event into a predictable, data-driven process.
This method, also known as a canary release, lets you validate performance, stability, and user reception with a small blast radius. If issues arise, they affect only a fraction of your users, enabling a quick rollback by simply toggling the flag off. This approach is superior to blue-green deployments for user-facing features because it allows you to observe real-world behavior with production traffic, rather than just validating infrastructure. For instance, you can target specific user segments like "non-paying users in Europe" before exposing a critical change to high-value customers.
Actionable Implementation Steps
To implement progressive rollouts effectively, structure your release into distinct, monitored phases:
- Phase 1: Internal & Low-Traffic Rollout (Targeting specific segments): Begin by enabling the feature for internal teams (dogfooding) and a very small, low-risk user segment (e.g.,
user.region === 'NZ'). During this phase, focus on monitoring technical metrics: error rates (Sentry, Bugsnag), CPU/memory utilization (Prometheus, Datadog), and API latency (New Relic, AppDynamics). - Phase 2: Early Adopter Expansion (Percentage-based rollout): Once the feature proves stable, increase the exposure to a random percentage of the user base, such as 10% or 25%. At this stage, monitor key business and product metrics. Create dashboards that segment conversion funnels, user engagement, and support ticket volume by the feature flag variant (
variant_Avs.variant_B). - Phase 3: Broad Rollout & Full Release (Automated ramp-up): After validating performance and user feedback, proceed with a broader rollout. Automate the ramp-up from 50% to 100% over a defined period. Crucially, integrate this with your monitoring system. Implement an automated "kill switch" that reverts the flag to 0% if key performance indicators (KPIs) like error rate or latency breach predefined thresholds for more than five minutes.
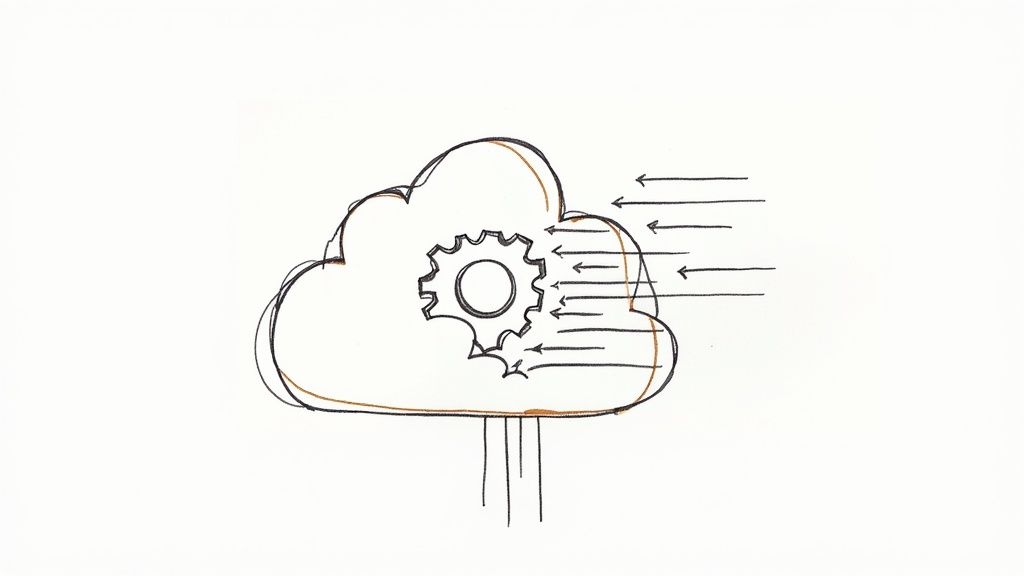
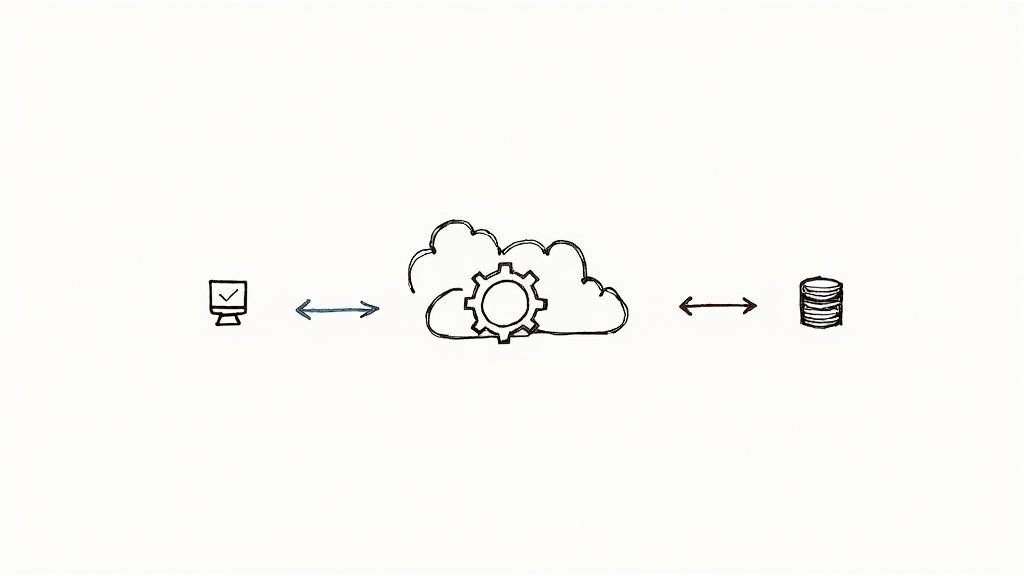
4. Establish Robust Monitoring and Alerting
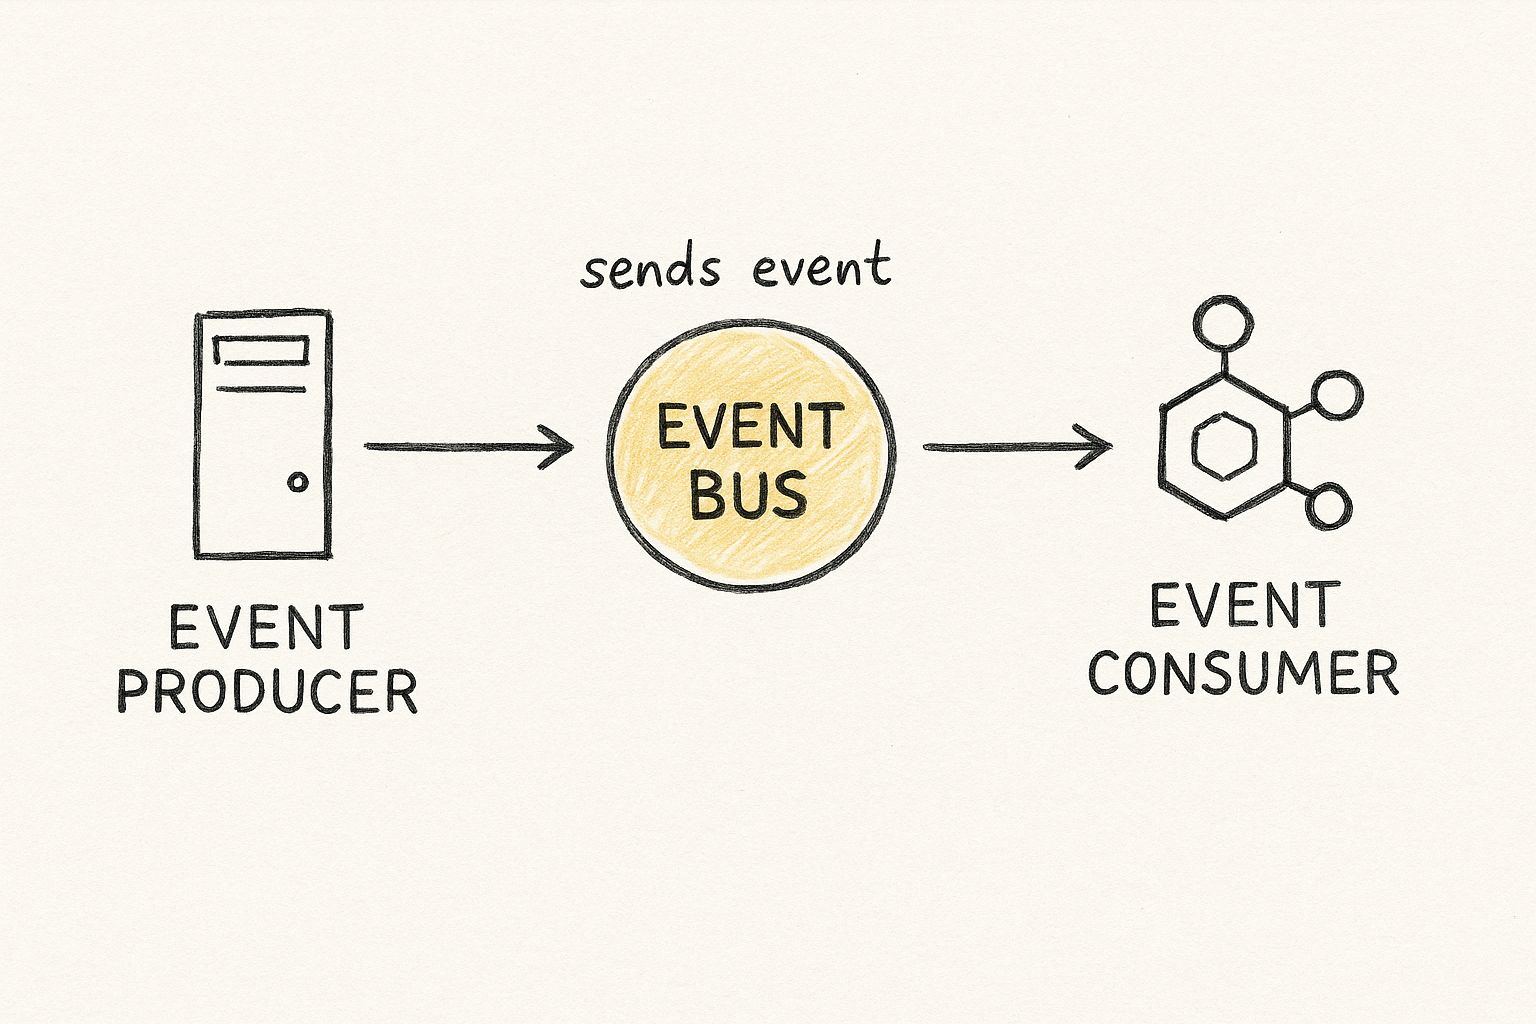
Feature flags provide immense control over releases, but that control is blind without visibility into the impact of those changes. A core component of feature flagging best practices is establishing a comprehensive monitoring and alerting system. This allows you to observe how a new feature affects your application's performance, user behavior, and key business metrics in real time.
Effective monitoring transforms feature flagging from a simple on/off switch into a powerful tool for de-risked, data-driven releases. It enables you to detect negative impacts, such as increased latency or error rates, the moment a flag is toggled. The key is to correlate every metric with the specific flag variant a user is exposed to. For example, when rolling out a new checkout algorithm, you must be able to see if the database query time for the new-checkout-flow group is higher than for the control group.
Actionable Implementation Steps
To build a robust monitoring framework for your feature flags, follow these steps:
- Step 1: Define Key Metrics and Hypotheses: Before enabling a flag, document the expected outcome. For a new caching layer, the hypothesis might be "We expect p95 API latency to decrease by 50% with no increase in error rate." Define the specific system metrics (CPU, memory, error rates), business KPIs (conversion rates, session duration), and user experience metrics (page load time, Core Web Vitals) to watch.
- Step 2: Propagate Flag State to Observability Tools: Ensure the state of the feature flag (
on,off, or variant name) is passed as a custom attribute or tag to your logging, monitoring, and error-tracking platforms. This context is critical. For example, tag your Datadog metrics and Sentry errors withfeature_flag:new-checkout-v2.// Example: Adding flag context to a logger const variant = featureFlagService.getVariant('new-checkout-flow', userContext); logger.info('User proceeded to payment', { user_id: user.id, checkout_variant: variant }); - Step 3: Set Up Variant-Aware Alerting: Create dashboards and alerts that compare the performance of users with the feature enabled versus those without. Configure automated alerts for significant statistical deviations. For instance, trigger a PagerDuty alert if "the 5-minute average error rate for the
new-checkout-v2variant is 2 standard deviations above the control group." To ensure your progressive rollouts and canary releases maintain high software quality, it's essential to align with this guide on prioritizing efficient testing and modern quality assurance best practices. For a deeper dive into observability, explore these infrastructure monitoring best practices.
5. Design for Fail-Safe Defaults and Quick Rollbacks
A feature flag system is only as reliable as its behavior under stress or failure. One of the most critical feature flagging best practices is to design your implementation with resilience in mind, ensuring it defaults to a safe, known-good state if the flagging service is unreachable or evaluation fails. This approach prioritizes system stability and user experience, preventing a feature flag outage from escalating into a full-blown application failure.
This principle involves building circuit breaker patterns and fallback logic directly into your code. When a flag evaluation fails (e.g., due to a network timeout when calling the flagging service), the SDK should not hang or throw an unhandled exception. Instead, it should gracefully revert to a predefined default behavior, log the error, and continue execution. For example, if a flag for a new recommendation algorithm times out, the system should default to false and render the old, stable algorithm, ensuring the core page functionality remains intact.
Actionable Implementation Steps
To build a resilient and fail-safe flagging system, integrate these technical practices:
- Phase 1: Codify Safe Defaults: For every feature flag evaluation call in your code, explicitly provide a default value. This is the value the SDK will use if it cannot initialize or fetch updated rules from the flagging service. The safe default should always represent the stable, known-good path.
// Example: Providing a safe default value in code boolean useNewApi = featureFlagClient.getBooleanValue("use-new-search-api", false, userContext); if (useNewApi) { // Call new, experimental search API } else { // Call old, stable search API } - Phase 2: Implement Local Caching with a Short TTL: Configure your feature flag SDK to cache the last known flag configurations on local disk or in memory with a short Time-To-Live (TTL), such as 60 seconds. If the remote service becomes unavailable, the SDK serves flags from this cache. This prevents a network blip from impacting user experience while ensuring the system can recover with fresh rules once connectivity is restored.
- Phase 3: Standardize and Test the Kill Switch: Your ability to roll back a feature should be near-instantaneous and not require a code deployment. Document the "kill switch" procedure and make it a standard part of your incident response runbooks. Regularly conduct drills ("game days") where your on-call team practices disabling a feature in a staging or production environment to verify the process is fast and effective.
By architecting for failure, you transform feature flags from a potential point of failure into a powerful tool for incident mitigation. A well-designed system with safe defaults and tested rollback plans ensures you can decouple releases from deployments without sacrificing system stability.
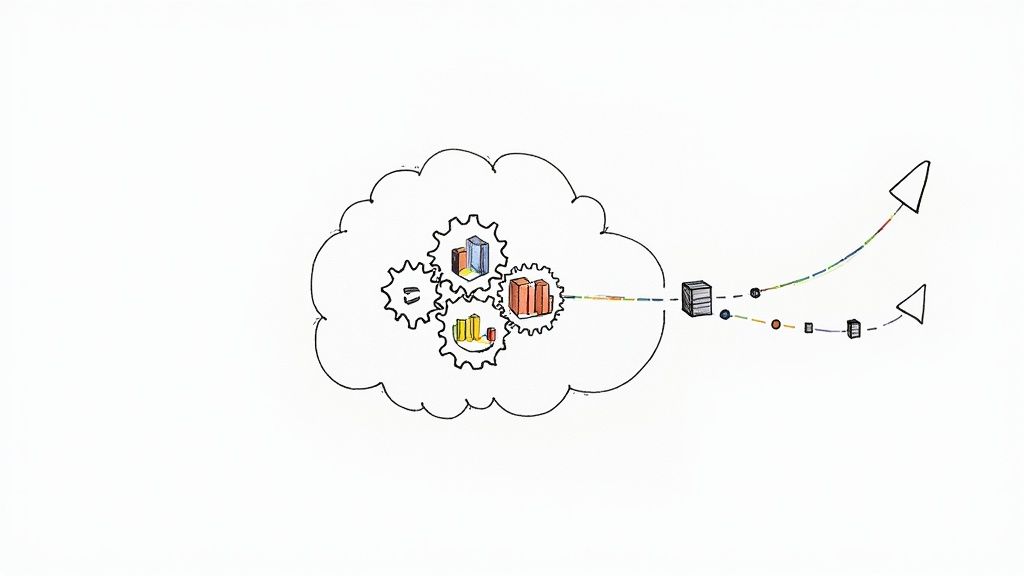
6. Maintain Clean Code Separation and Architecture
A common pitfall in feature flagging is letting flag evaluation logic permeate your entire codebase. One of the most critical feature flagging best practices for long-term scalability is to maintain a strict separation between feature flag checks and core business logic. This architectural discipline prevents technical debt and ensures your code remains clean, testable, and easy to refactor once a flag is removed.
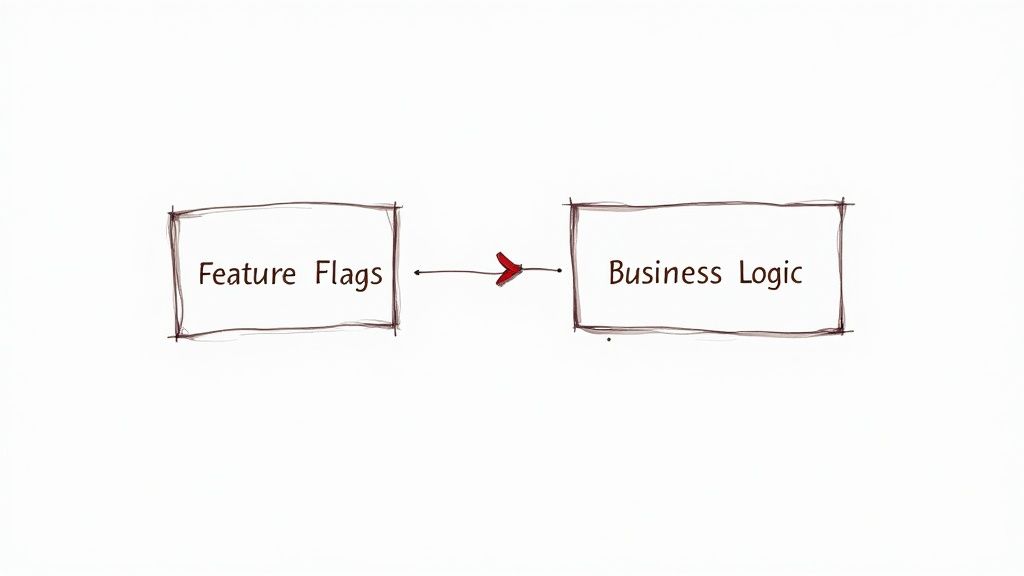
Scattering if (flagIsEnabled(...)) statements across controllers, services, and data models creates "flag debt." A cleaner approach involves isolating flag logic at the application's boundaries (e.g., in controllers or middleware) or using design patterns like Strategy or Decorator to abstract the decision-making process. By doing so, the core business logic remains agnostic of the feature flags, operating on the configuration or implementation it's given. This makes removing the flag a simple matter of deleting the old code path and updating the dependency injection configuration.
Actionable Implementation Steps
To achieve clean separation and avoid flag-induced spaghetti code, implement these architectural patterns:
- Phase 1: Create a Centralized Flag Evaluation Service: Abstract your feature flag provider (e.g., LaunchDarkly, Optimizely) behind your own internal service, like
MyFeatureFlagService. Instead of calling the vendor SDK directly from business logic, call your abstraction. This provides a single point of control, makes it easy to add cross-cutting concerns like logging, and simplifies future migrations to different flagging tools. - Phase 2: Use Dependency Injection with the Strategy Pattern: At application startup or request time, use a feature flag to inject the correct implementation of an interface. This is one of the cleanest patterns for swapping out behavior.
// Example: Using DI to inject the correct strategy public interface IPaymentGateway { Task ProcessPayment(PaymentDetails details); } public class LegacyGateway : IPaymentGateway { /* ... */ } public class NewStripeGateway : IPaymentGateway { /* ... */ } // In Startup.cs or DI container configuration: services.AddScoped<IPaymentGateway>(provider => { var flagClient = provider.GetRequiredService<IFeatureFlagClient>(); if (flagClient.GetBooleanValue("use-new-stripe-gateway", false)) { return new NewStripeGateway(...); } else { return new LegacyGateway(...); } }); - Phase 3: Isolate Flag Logic at the Edges: For UI changes or API routing, perform flag evaluation as early as possible in the request lifecycle (e.g., in middleware or at the controller level). The decision of which component to render or which service method to call should be made there, passing simple data or objects—not the user context and flag names—down into the deeper layers of your application.
7. Implement Proper Security and Access Controls
Feature flags are powerful tools that directly control application behavior in production, making them a potential security vulnerability if not managed correctly. One of the most critical feature flagging best practices is to treat your flagging system with the same security rigor as your production infrastructure. Establishing robust security measures, including role-based access controls (RBAC), audit logging, and secure flag evaluation, is essential to prevent unauthorized changes and maintain compliance.
A poorly secured feature flag system can lead to catastrophic failures. An unauthorized change could enable a feature that exposes sensitive customer PII or bypasses payment logic. To prevent this, every change must be intentional, authorized, and traceable. This means integrating your feature flag management platform with your organization's identity provider (e.g., Okta, Azure AD) for single sign-on (SSO) and enforcing multi-factor authentication (MFA).
Actionable Implementation Steps
To secure your feature flagging implementation, integrate security from the very beginning:
- Phase 1: Enforce Role-Based Access Control (RBAC): Define granular roles with specific permissions based on the principle of least privilege. For instance, a
Developerrole can only create and toggle flags indevandstagingenvironments. ARelease Managerrole can modify flags inproduction. AProduct Managermight have view-only access to production and edit access for A/B test targeting rules. - Phase 2: Implement Mandatory Approval Workflows: For production environments and sensitive flags (e.g., those controlling security features or payment flows), implement a mandatory approval system. A change should require approval from at least one other person (the "four-eyes principle") before it can be saved. This is a core component of many DevOps security best practices.
- Phase 3: Integrate with SIEM via Comprehensive Audit Logging: Ensure every action related to a feature flag (creation, modification, toggling, deletion) is logged with who (
user_id), what (thediffof the change), when (timestamp), and from where (ip_address). These immutable audit logs should be streamed to your Security Information and Event Management (SIEM) system (e.g., Splunk, Elastic) for real-time monitoring of suspicious activity and long-term retention for compliance audits (SOC 2, HIPAA).
7 Best Practices Comparison for Feature Flagging
| Approach | Implementation Complexity | Resource Requirements | Expected Outcomes | Ideal Use Cases | Key Advantages |
|---|---|---|---|---|---|
| Start Simple and Evolve Gradually | Low | Minimal infrastructure, simple setup | Basic feature toggling, quick rollout | Teams starting with feature flags, low-risk launches | Low learning curve, fast initial implementation |
| Implement Comprehensive Flag Lifecycle Management | Medium | Ongoing maintenance, CI/CD tooling, scripting | Reduced technical debt, cleaner codebase, fewer bugs | Large codebases with many feature flags | Prevents flag sprawl, improves maintainability |
| Use Progressive Rollouts and Canary Releases | High | Sophisticated monitoring and coordination | Controlled risk, data-driven rollouts | High-impact features requiring staged releases | Minimizes blast radius, enables data-driven validation |
| Establish Robust Monitoring and Alerting | Medium to High | Investment in monitoring tools, log enrichment | Early issue detection, data-driven decisions | Features with critical performance or business impact | Improves reliability, correlates impact to features |
| Design for Fail-Safe Defaults and Quick Rollbacks | Medium | Architecture design, SDK configuration, testing failure modes | System stability and availability during outages | Systems requiring high availability and resilience | Prevents cascading failures, maintains user trust |
| Maintain Clean Code Separation and Architecture | Medium | Upfront design using patterns (Strategy, DI) | Maintainable, testable, and modular code | Mature applications needing long-term scalability | Easier testing and flag removal, reduced tech debt |
| Implement Proper Security and Access Controls | Medium to High | Security tooling, SSO/IdP integration, SIEM logging | Secure flag management, compliance adherence | Enterprise, regulated industries (finance, healthcare) | Prevents unauthorized changes, ensures auditability |
Integrate Flagging into Your DevOps Culture
Transitioning from traditional deployments to a feature-flag-driven development model is more than a technical upgrade; it's a profound cultural shift. The feature flagging best practices we've explored provide the technical scaffolding for this transformation, but their true power is only unlocked when they become ingrained in your team's daily workflows and strategic thinking. By moving beyond viewing flags as simple on/off switches, you can elevate them into a strategic toolset for managing risk, accelerating delivery, and making smarter, data-informed product decisions.
Mastering these practices means your engineering team can decouple deployment from release, effectively ending the era of high-stakes, monolithic "Big Bang" launches. Your product managers gain the ability to conduct real-world A/B tests and canary releases with precision, gathering invaluable user feedback before committing to a full rollout. This iterative approach, a core tenet of modern software development, becomes not just possible but standard operating procedure. The journey from CI/CD in DevOps from theory to practice to a truly dynamic and responsive delivery pipeline is paved with well-managed feature flags.
Key Takeaways for Strategic Implementation
To truly integrate these concepts, focus on these critical pillars:
- Lifecycle Management is Non-Negotiable: Treat every feature flag as a piece of technical debt from the moment it's created. Enforce a strict lifecycle policy, from naming conventions and metadata tagging to automated cleanup via CI/CD checks, to prevent a chaotic and unmanageable flag ecosystem.
- Safety Nets are Essential: Design every flag with a fail-safe default codified directly in your application. Your system must be resilient enough to handle configuration errors or service outages gracefully, ensuring a degraded but functional experience rather than a complete system failure.
- Security is a First-Class Citizen: Implement granular, role-based access controls (RBAC) for your flagging system, integrated with your company's identity provider. The ability to toggle a feature in production is a powerful privilege that must be meticulously managed and audited to prevent unauthorized changes or security vulnerabilities.
By internalizing these feature flagging best practices, you empower your organization to build a more resilient, agile, and innovative development culture. The ultimate goal is to make shipping software a low-stress, routine activity, enabling your team to focus on what truly matters: delivering exceptional value to your users.
Ready to implement these advanced strategies but need the specialized expertise to build a scalable and secure feature flagging framework? OpsMoon connects you with elite, vetted DevOps and SRE professionals who can design and implement a system tailored to your unique technical and business needs. Find the expert talent to transform your release process from a liability into a competitive advantage at OpsMoon.