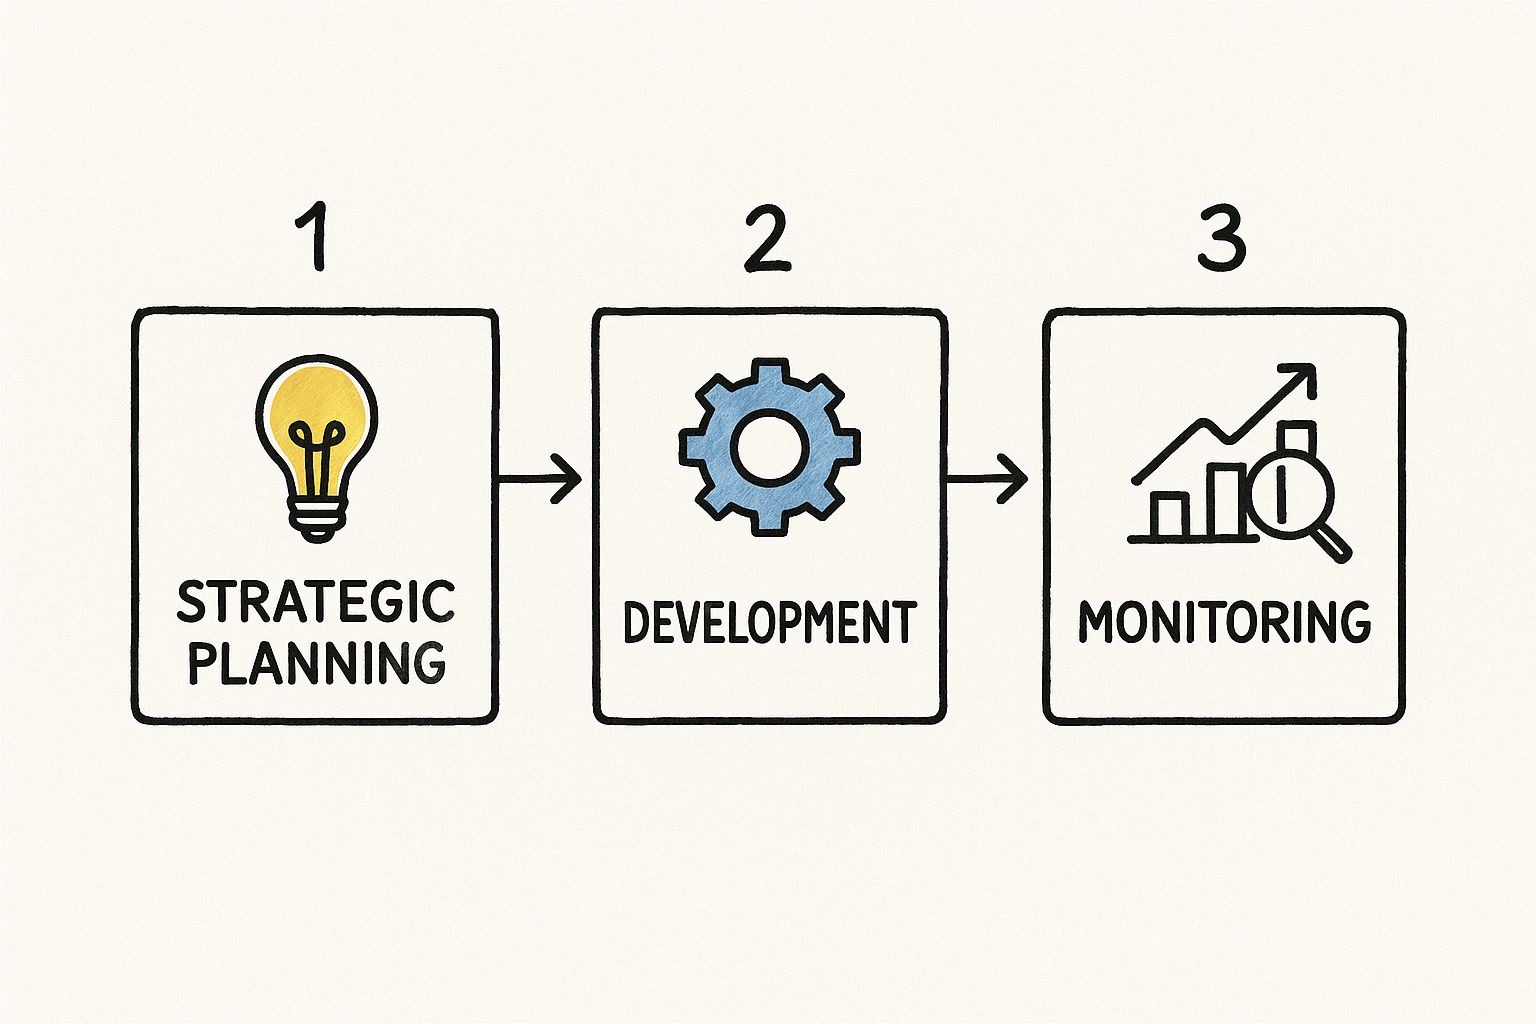
Implementing feature toggles is a strategic engineering decision that decouples code deployment from feature release. The core process involves four main steps: defining a release strategy (e.g., canary release), integrating a feature flag SDK into your application, wrapping new code paths in a conditional block controlled by the flag, and managing the flag's state via a centralized control plane. This separation gives you granular, real-time control over your application's behavior in production.
Why Feature Toggles Are a Game-Changer for Modern Development
Before diving into the implementation details, it's crucial to understand the architectural shift that feature toggles enable. They are more than simple if/else statements; they are a cornerstone of modern CI/CD and progressive delivery, fundamentally altering the software release life cycle.
The primary objective is to separate deployment from release. This allows engineering teams to merge code into the main branch continuously (trunk-based development) and deploy to production frequently with minimal risk. New features remain dormant behind toggles until they are explicitly activated. This approach mitigates the risk of large, monolithic releases and enables a more agile, iterative development process.
This shift yields immediate, measurable benefits:
- Instantaneous Rollbacks: If a new feature causes production issues, a single click in the management dashboard can disable it, effectively performing a logical rollback without redeploying code.
- Canary Releases & Progressive Delivery: You can release a feature to a small, controlled cohort of users—such as 1% of traffic, users on a specific beta plan, or internal employees—to validate performance and functionality in a real-world environment before a full rollout.
- Targeted Beta Programs: Use attribute-based targeting to grant early access to specific enterprise clients or user segments, creating tight feedback loops without affecting the entire user base.
- Trunk-Based Development: By gating incomplete features, all developers can commit directly to the main branch, drastically reducing merge conflicts and eliminating the overhead of long-lived feature branches.
The Core Implementation Workflow
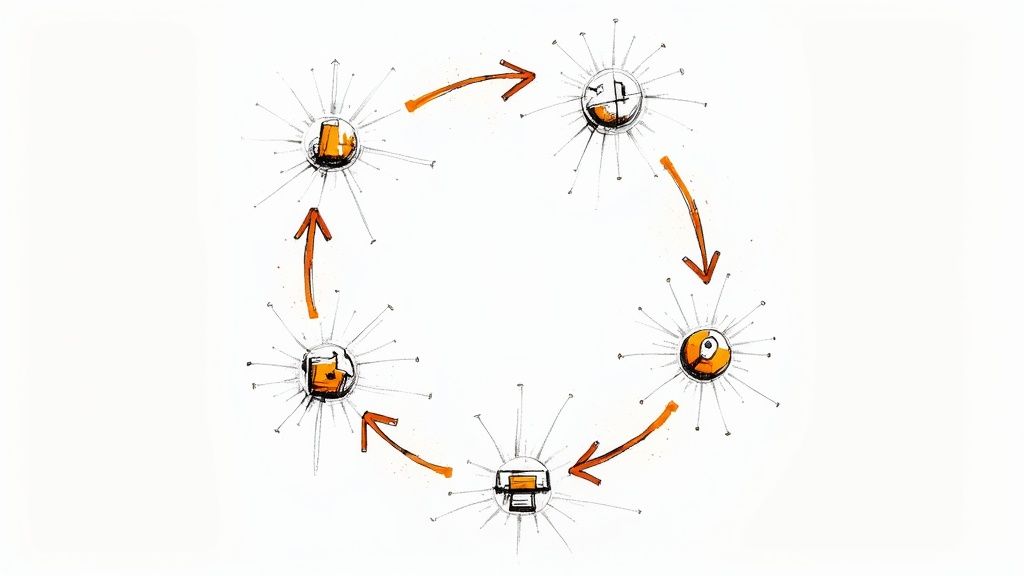
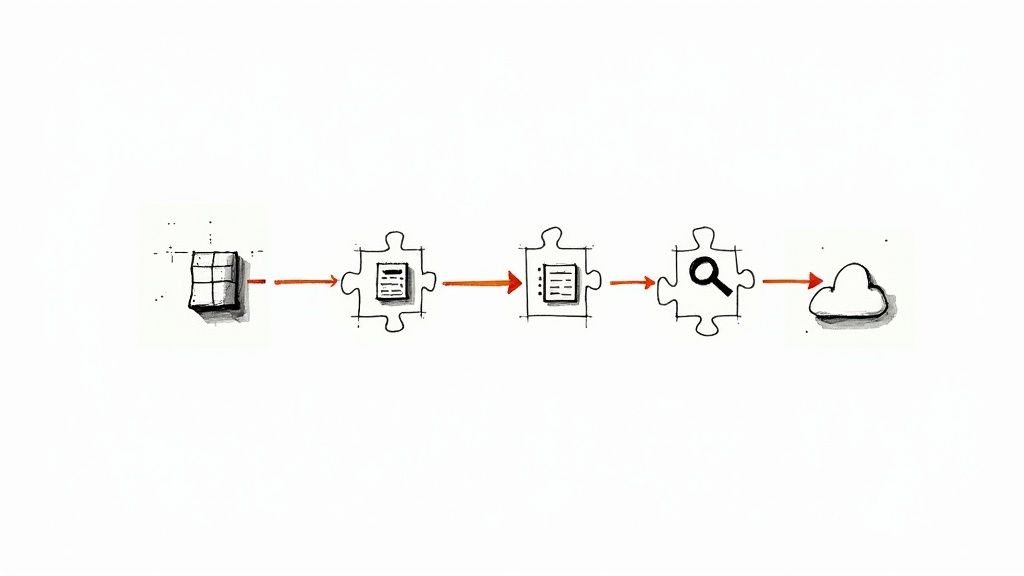
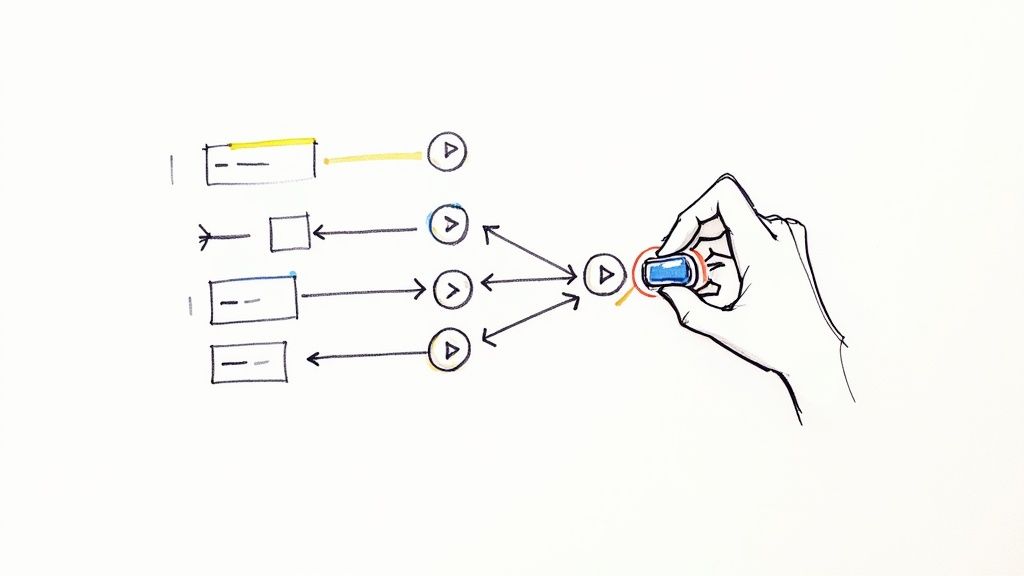
Whether you build an in-house solution or leverage a third-party service, the implementation workflow follows a consistent, cyclical pattern designed for control, safety, and continuous learning.
This infographic outlines the fundamental process.
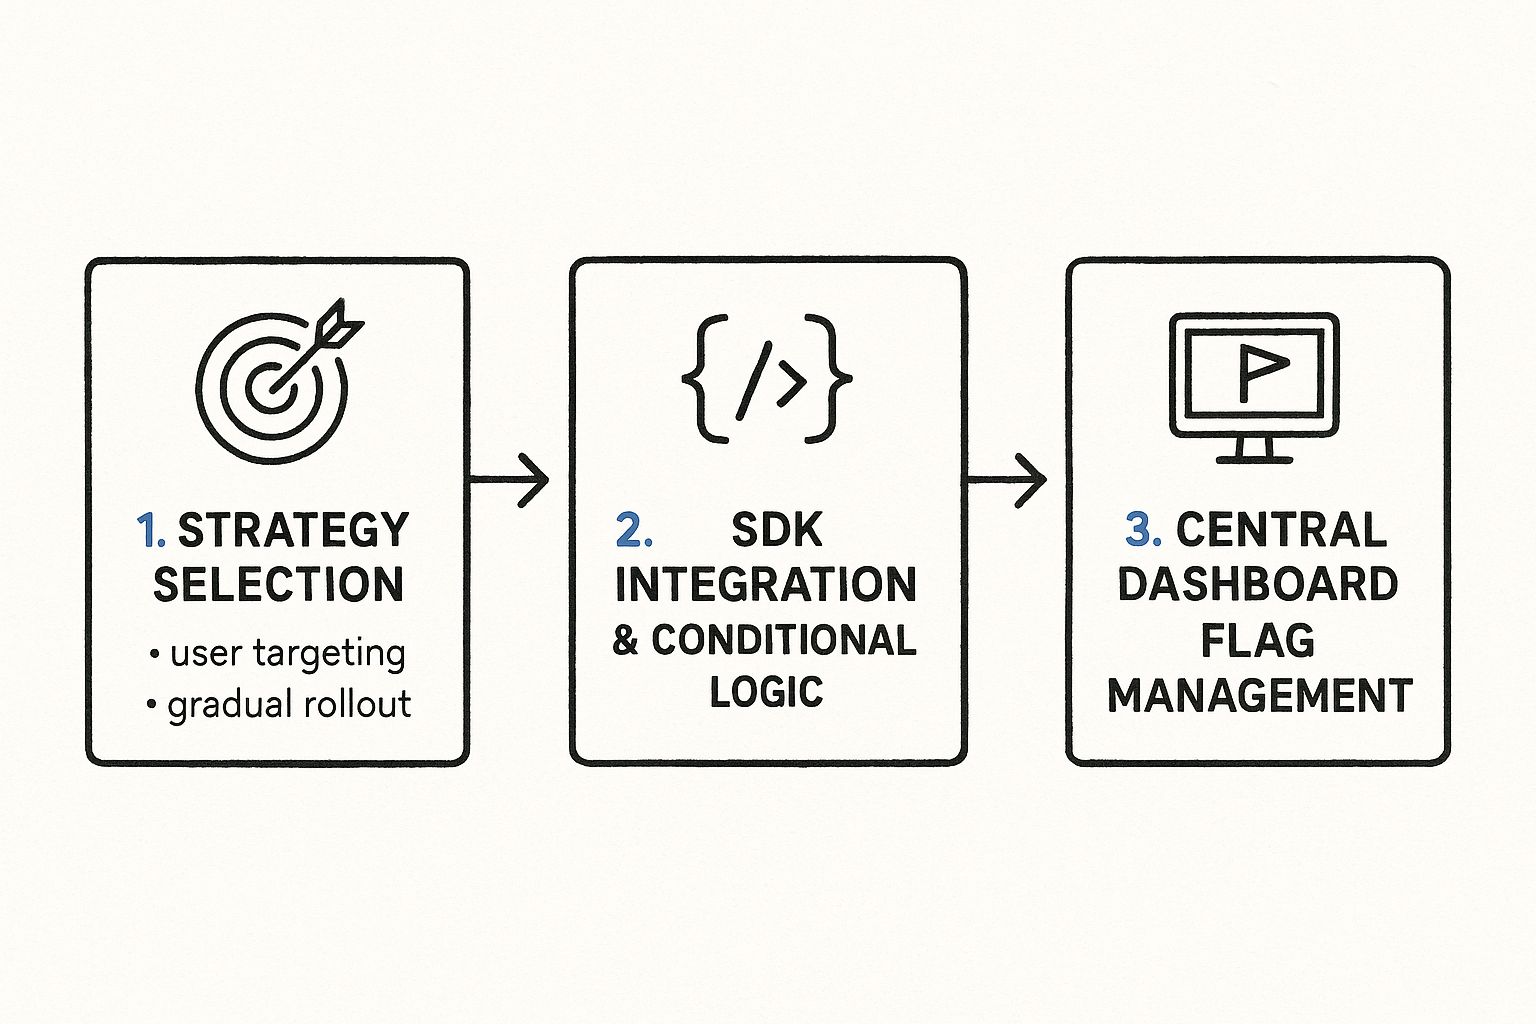
The release strategy (e.g., enable for internal IPs only) dictates the technical implementation (creating a flag with an IP-based targeting rule). The centralized dashboard provides the operational control to modify this rule in real-time.
For example, a fintech app deploying a new payment gateway might implement the following progressive delivery strategy:
- Internal QA: Enable the feature flag where
user.emailends with@company.com. - Limited Beta: Add a rule to enable the flag for
5%of users in a specific geographic region (e.g.,user.country == 'DE'). - Full Rollout: Incrementally increase the percentage rollout to
25%,50%, and finally100%, while monitoring application performance monitoring (APM) and error-tracking dashboards. A single click can revert to the previous state at any point.
Key Takeaway: Feature toggles transform high-risk release events into controlled, data-driven operational decisions, enabling teams to test in production safely and accelerate value delivery.
To understand how to integrate this capability, it’s essential to evaluate the primary architectural approaches.
Core Implementation Approaches at a Glance
| Approach | Best For | Complexity | Key Advantage |
|---|---|---|---|
| Simple Config Files | Small, monolithic applications or internal tools where dynamic control is not a requirement. | Low | Zero latency; configuration is part of the application artifact. Requires redeployment to change. |
| Database-Driven Flags | Teams needing dynamic control without a full SaaS platform, willing to build and maintain the management UI. | Medium | Centralized control and dynamic updates. Introduces a dependency on the database for flag evaluation. |
| In-House Platform | Large enterprises with specific security, compliance, or integration needs and dedicated platform engineering teams. | High | Fully customized to the organization's architecture and business logic. Significant maintenance overhead. |
| Third-Party SaaS | The majority of teams, from startups to enterprises, seeking a scalable, feature-rich solution with minimal setup. | Low | Advanced targeting, analytics, SDKs, enterprise-grade security (SOC 2, etc.), and support. |
While each approach has its place, the industry trend is overwhelmingly toward specialized third-party services that offer robust, off-the-shelf solutions.
A Rapidly Growing Market
The adoption of feature toggles is a significant market trend. The global feature management market was valued at approximately $2.5 billion in 2025 and is projected to grow at a compound annual growth rate (CAGR) of 20% through 2033.
The impact is quantifiable. Financial services firms adopting feature management have reported a 400% increase in deployment frequency. Concurrently, their deployment windows shrank from over 8 hours to under 45 minutes, and change failure rates dropped from 15% to less than 3%. These are not marginal gains; they are transformative improvements in engineering velocity and system stability.
Architecting a Feature Toggle System That Scales
A simple boolean in a configuration file is a feature toggle in its most primitive form, but it does not scale. In a distributed microservices environment, the feature flag architecture becomes a critical component of your application's performance, resilience, and operational stability.
Making sound architectural decisions upfront is essential to prevent your feature flagging system from becoming a source of technical debt or a single point of failure.
The primary architectural challenge is balancing the need for dynamic, real-time control with the performance requirement of avoiding network latency for every flag evaluation. This is achieved through established architectural patterns, often drawing from principles found in enterprise application architecture patterns.
Choosing Your Core Architectural Model
The method of storing, retrieving, and evaluating flags is the system's foundation, with each model offering different trade-offs in terms of latency, complexity, and dynamic control.
-
Config File Toggles: Flags are defined in a static file (e.g.,
features.json,config.yml) bundled with the application artifact. Evaluation is extremely fast (in-memory read), but any change requires a full redeployment, defeating the purpose of dynamic control. This is only suitable for simple, single-service applications. -
In-Memory Solutions: Flag configurations are held directly in the application's memory for near-instantaneous evaluation (often sub-nanosecond). Keeping the in-memory store synchronized with a central source is the key challenge, typically solved with a background polling mechanism or a persistent streaming connection (e.g., SSE, WebSockets).
-
Database-Backed Systems: Storing flags in a centralized database (like PostgreSQL, DynamoDB, or Redis) allows for dynamic updates across multiple services. The primary risk is creating a hard dependency; database latency or downtime can directly impact application performance unless a robust caching layer (e.g., Redis, in-memory) is implemented.
Designing for a Microservices Ecosystem
In a distributed system, a naive implementation can create a single point of failure or a performance bottleneck. A production-grade architecture is designed for resilience and efficiency.
A common pattern involves a centralized configuration service as the single source of truth for all flags. However, application services should never query this service directly for every flag evaluation. The resulting network latency and load would be prohibitive.
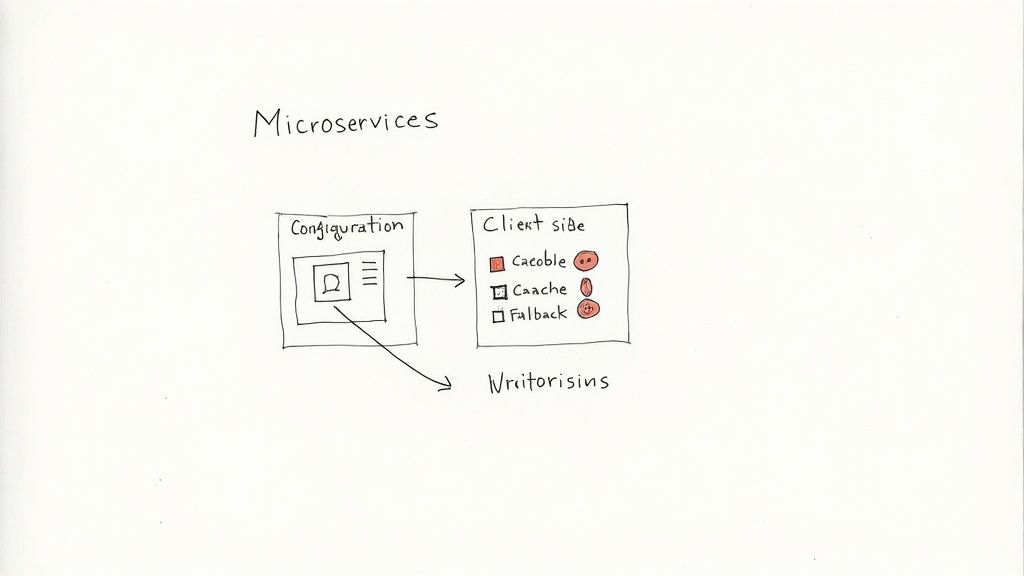
Instead, each microservice integrates a lightweight client-side SDK that performs two critical functions:
- Fetch and Cache: On application startup, the SDK connects to the central service, fetches the relevant flag configurations, and caches them locally in memory.
- Real-Time Updates: The SDK establishes a long-lived streaming connection (e.g., using Server-Sent Events) to the central service. When a flag is modified in the dashboard, the service pushes the update down the stream to all connected SDKs, which then update their local cache in real-time.
This hybrid architecture provides the near-zero latency of an in-memory evaluation with the dynamic control of a centralized system.
Expert Tip: Implement a bootstrap or fallback mechanism. The SDK must be initialized with a set of default flag values, either from a local file packaged with the application or hardcoded defaults. This ensures that if the central toggle service is unavailable on startup, the application can still launch and operate in a known, safe state.
Graceful Degradation and Failure Modes
A well-architected system is designed to fail gracefully. The client-side SDK must be built with resilience in mind.
Consider these fallback strategies:
- Stale on Error: If the SDK loses its connection to the central service, it must continue serving decisions from the last known good configuration in its cache. This is far superior to failing open (enabling all features) or failing closed (disabling all features).
- Default Values: Every flag evaluation call in your code must include a default value (
featureFlag.isEnabled('new-feature', false)). This is the ultimate safety net, ensuring predictable behavior if a flag definition is missing or the system fails before the initial cache is populated. - Circuit Breakers: Implement circuit breakers in the SDK's communication logic. If the central service becomes unresponsive, the SDK should exponentially back off its connection attempts to avoid overwhelming the service and contributing to a cascading failure.
This proactive approach to failure planning is what distinguishes a professional-grade feature flagging implementation.
Moving from architectural theory to practical application, let's examine concrete code examples. We will implement feature toggles in both frontend and backend contexts to make these concepts tangible.
An excellent open-source platform that embodies these principles is Unleash.
Think of Unleash (or similar platforms) as the central control plane from which you can manage feature exposure with precision.
Guarding a New UI Component in React
A primary use case for feature toggles is gating new UI components, allowing frontend code to be merged into the main branch continuously, even if a feature is incomplete. This eliminates the need for long-lived feature branches.
Consider a React application introducing a new BetaDashboard component. We can use a feature flag to control its visibility.
import React from 'react';
import { useFeature } from 'feature-toggle-react'; // Example hook from a library

const OldDashboard = () => <div>This is the classic dashboard.</div>;
const BetaDashboard = () => <div>Welcome to the new and improved beta dashboard!</div>;

const DashboardPage = () => {
  // The hook evaluates the flag locally from the SDK's in-memory cache.
  const isNewDashboardEnabled = useFeature('new-dashboard-beta');

  return (
    <div>
      <h1>My Application Dashboard</h1>
      {isNewDashboardEnabled ? <BetaDashboard /> : <OldDashboard />}
    </div>
  );
};

export default DashboardPage;
In this example, the useFeature('new-dashboard-beta') hook provides a boolean that determines which component is rendered. The evaluation is synchronous and extremely fast because it reads from the local SDK cache. To release the feature, you simply enable the new-dashboard-beta flag in your management console, and the change is reflected in the UI without a redeployment.
Protecting a Backend API Endpoint in Node.js
On the backend, feature toggles are critical for protecting new or modified API endpoints. This prevents users from accessing business logic that is still under development.
Here is an example using an Express.js middleware to guard a new API route.
const express = require('express');
const unleash = require('./unleash-client'); // Your initialized feature flag SDK client

const app = express();

// Middleware to check for a feature toggle
const featureCheck = (featureName) => {
  return (req, res, next) => {
    // Context provides attributes for advanced targeting rules.
    const context = {
      userId: req.user ? req.user.id : undefined,
      sessionId: req.session.id,
      remoteAddress: req.ip
    };

    if (unleash.isEnabled(featureName, context)) {
      return next(); // Feature is enabled for this context, proceed.
    } else {
      // Return 404 to make the endpoint appear non-existent.
      return res.status(404).send({ error: 'Not Found' });
    }
  };
};

// Apply the middleware to a new, protected route
app.post('/api/v2/process-payment', featureCheck('v2-payment-processing'), (req, res) => {
  // New payment processing logic
  res.send({ status: 'success', version: 'v2' });
});

app.listen(3000, () => console.log('Server running on port 3000'));
Now, any POST request to /api/v2/process-payment is intercepted by the featureCheck middleware. If the v2-payment-processing flag is disabled for the given context, the server returns a 404 Not Found, effectively hiding the endpoint.
Choosing the Right Feature Toggle Platform
While the code implementation is straightforward, the power of feature flagging comes from the management platform. Industry leaders like LaunchDarkly, Optimizely, Unleash, Split.io, and FeatBit provide the necessary infrastructure. For context, large tech companies like Facebook manage tens of thousands of active flags. These platforms offer advanced features like audit logs, user targeting, and analytics that tie feature rollouts to business metrics. For more options, explore comprehensive guides to the best feature flag providers.
The ideal tool depends on your team's scale, technical stack, and budget.
Expert Insight: Prioritize the quality and performance of the SDKs for your primary programming languages. A fast, well-documented, and resilient SDK is non-negotiable. Next, scrutinize the targeting capabilities. Can you target users based on custom attributes like subscription tier, company ID, or geographic location? This is where the strategic value of feature flagging is unlocked.
This table provides a high-level comparison of popular platforms.
Comparison of Top Feature Toggle Platforms
The market offers diverse solutions, each with a different focus, from enterprise-grade experimentation to open-source flexibility.
| Platform | Key Feature | Best For | Open Source Option |
|---|---|---|---|
| LaunchDarkly | Enterprise-grade targeting rules and experimentation engine. | Large teams and enterprises needing advanced user segmentation and A/B testing. | No |
| Unleash | Open-source, self-hostable, with strong privacy and data control. | Teams that require full control over their infrastructure or have strict data residency needs. | Yes |
| Optimizely | Deep integration with marketing and product experimentation tools. | Product and marketing teams focused on data-driven feature optimization and testing. | No |
| Split.io | Strong focus on feature data monitoring and performance impact analysis. | Engineering teams that want to measure the direct impact of features on system metrics. | No |
Your choice should align with your team's core priorities, whether it's the infrastructure control of a self-hosted tool like Unleash or the advanced analytics of a platform like Split.io.
Advanced Flag Management and Best Practices
Implementing feature flags is only the first step. Effective long-term management is what separates a successful strategy from one that descends into technical debt and operational chaos.
This requires moving beyond simple on/off switches to a structured lifecycle management process for every flag created. The goal is to maintain a clean, understandable, and manageable codebase as your system scales.
Establishing a Flag Lifecycle
Not all flags serve the same purpose. Categorizing them is the first step toward effective management, as it clarifies their intent and expected lifespan.
There are two primary categories:
- Short-Lived Release Toggles: These are temporary flags used to gate a new feature during its development, rollout, and stabilization phases. Once the feature is fully released (e.g., at 100% traffic) and deemed stable, the toggle has served its purpose. The code paths should be refactored to remove the conditional logic, and the flag should be deleted from the system.
- Permanent Operational Toggles: These flags are intended to be a permanent part of the application's operational toolkit. Examples include kill switches for critical dependencies, flags for A/B testing frameworks, or toggles to enable premium features for different customer subscription tiers.
Drawing a clear distinction between these two types is crucial. A release toggle that persists for months becomes technical debt, adding dead code paths and increasing the cognitive load required to understand the system's behavior.
Preventing Technical Debt from Stale Flags
The most common failure mode of feature flagging is the accumulation of stale flags—release toggles that were never removed. This creates a minefield of dead code, increasing complexity and the risk of regressions.
A systematic cleanup process is non-negotiable.
- Assign Ownership: Every flag must have an owner (an individual or a team) responsible for its entire lifecycle. When ownership changes, it must be formally transferred.
- Set Expiration Dates: When creating a short-lived release toggle, define an expected "cleanup by" date. This creates a clear timeline for its removal.
- Automate Reporting: Use the feature flag platform's API to build scripts that identify stale flags. For example, a script could flag any toggle that has been fully enabled (100%) or disabled (0%) for more than 30 days.
- Integrate Cleanup into Your Workflow: Make flag cleanup a routine part of your development process. Create cleanup tickets in your backlog, schedule a recurring "Flag Hygiene" meeting, or integrate it into your sprint planning.
This proactive hygiene is essential. For a deeper dive, review comprehensive feature flagging best practices to build robust internal processes.
Leveraging Flags for Advanced Use Cases
With solid management practices, feature toggles evolve from a release tool into a strategic asset for product development and operations.
- A/B Testing and Experimentation: Use flags to serve different feature variations to distinct user segments. This enables data-driven product decisions based on quantitative metrics rather than intuition.
- Canary Releases: Orchestrate sophisticated, low-risk rollouts. Start by enabling a feature for a small internal group, then expand to 1%, 10%, and 50% of external users, continuously monitoring APM and error rates at each stage.
- Trunk-Based Development: Feature toggles are the enabling technology for trunk-based development, allowing developers to merge incomplete features into the main branch, hidden from users until they are ready.
These advanced strategies are particularly valuable during complex projects, such as major architectural migrations or significant framework upgrades like those managed by Ruby on Rails upgrade services, where they provide a safe, controlled mechanism for rolling out changes.
Testing and Securing a Feature Toggled Application
Introducing feature toggles adds a new dimension of dynamic behavior to your application, which requires a corresponding evolution in your testing and security practices. A system whose behavior can change without a deployment cannot be adequately tested with static checks alone.
A common concern is the "combinatorial explosion" of test cases. With 10 feature flags, there are 2^10 (1,024) possible combinations. It is impractical to test every permutation. Instead, focus on testing each feature's toggled states (on and off) independently, along with the default production state (the most common combination of flags).
A Robust Testing Strategy
Your testing strategy must treat feature flags as a core part of the application's state. This involves integrating flag configurations directly into your automated test suites.
- Unit Tests: Unit tests must cover both logical paths introduced by a feature toggle. Use mocking or dependency injection to force the flag evaluation to return
trueandfalsein separate tests, ensuring both the old and new code paths are validated. - Integration Tests: These tests should verify that toggled features interact correctly with other system components. For example, if a new API endpoint is behind a flag, an integration test should assert that it makes the expected database calls only when the flag is enabled.
- End-to-End (E2E) Tests: Your E2E test suite (e.g., Cypress, Playwright) must be "flag-aware." Before a test run, configure the desired flag states for that specific test scenario, either by calling the feature flag service's API or by mocking the SDK's response.
Key Takeaway: Configure your CI/CD pipeline to run your test suite against critical flag combinations. A common, effective pattern is to run all tests with flags in their default production state, followed by a targeted set of E2E tests for each new feature with its corresponding flag enabled.
Automating this process is critical for maintaining high release velocity. For more detailed frameworks, see our guide on how to automate software testing.
Analyzing Potential Security Risks
A feature flag system is a powerful control plane for your application's logic. If compromised, an attacker could enable unfinished features, expose sensitive data, or activate malicious code. The feature flag management platform and its APIs must be secured with the same rigor as production infrastructure.
The security benefit, however, is significant: well-managed feature toggles can reduce deployment-related incidents by up to 89%. This is a direct result of decoupling deployment from release, allowing code to be shipped to production while new functionality remains disabled until it has been fully security-vetted. You can read more about these feature flag benefits and best practices.
Concrete Security Best Practices
Securing your feature toggle implementation requires a layered defense, protecting both the management console and the SDK's communication channels.
- Enforce Strict Access Control: Implement Role-Based Access Control (RBAC) in your feature flag dashboard. Limit production flag modification privileges to a small, authorized group of senior engineers or release managers. Use multi-factor authentication (MFA) for all users.
- Secure Your Flag Control APIs: The API endpoints that SDKs use to fetch flag configurations are a critical attack surface. Use short-lived, rotated authentication tokens and enforce TLS 1.2 or higher for all communication.
- Audit Toggled-Off Code: Code behind a disabled flag is not inert. Static Application Security Testing (SAST) tools must scan the entire codebase, regardless of toggle state, to identify vulnerabilities in dormant code before they can be activated.
- Implement an Audit Log: Your feature flag system must maintain an immutable, comprehensive audit log. Every change to a flag's state (who, what, when) must be recorded. This is essential for incident response and regulatory compliance.
Common Questions About Feature Toggles
Here are answers to common technical questions that arise during and after the implementation of a feature flagging system.
How Do Feature Toggles Affect Application Performance?
This is a valid concern that has been largely solved by modern feature flagging platforms. Performance impact is negligible when implemented correctly.
Most SDKs use an in-memory cache for flag configurations. The SDK fetches all rules on application startup and then subscribes to a streaming connection for real-time updates. Subsequent flag evaluations are simple in-memory function calls, with latencies typically measured in nanoseconds, not milliseconds.
The key is local evaluation. A feature flag check should never trigger a synchronous network call during a user request. If it does, the architecture is flawed. With a proper caching and streaming update strategy, the performance overhead is virtually zero.
What’s the Difference Between a Feature Toggle and a Config Setting?
While both control application behavior, their purpose, lifecycle, and implementation are fundamentally different.
- Configuration Settings are generally static per environment (e.g., database connection strings, API keys). They define how an application runs. Changing them typically requires an application restart or a new deployment.
- Feature Toggles are dynamic and designed to be changed in real-time without a deployment. They control application logic and feature visibility, are managed from a central UI, and often depend on user context. They define what the application does for a specific user at a specific moment.
What Is the Best Way to Manage Technical Debt from Old Toggles?
The only effective strategy is proactive, systematic cleanup.
Every flag must have a designated owner and a type: a short-lived release toggle or a permanent operational toggle. Release toggles must have an expected removal date.
Integrate flag hygiene into your team's workflow. Schedule a recurring "Flag Cleanup" task in each sprint to review and remove stale flags. Use your platform's API to build automation that identifies candidates for removal, such as flags that have been at 100% rollout for over 30 days. When cleanup becomes a routine practice, you prevent the accumulation of technical debt.
At OpsMoon, we specialize in building the robust CI/CD pipelines and infrastructure that make advanced techniques like feature toggling possible. Our top-tier DevOps engineers can help you accelerate your releases while improving stability and control. Plan your work with our experts for free.