Legacy system modernisation is the strategic re-engineering of outdated IT systems to meet modern architectural, performance, and business demands. This is not a simple lift-and-shift; it's a deep architectural overhaul focused on transforming technical debt into a high-velocity, scalable technology stack. The objective is to dismantle monolithic constraints and rebuild for agility, turning accumulated liabilities into tangible technical equity.
Why Modernisation Is a Technical Imperative
Clinging to legacy systems is an architectural dead-end that directly throttles engineering velocity and business growth. These systems are often characterized by tight coupling, lack of automated testing, and complex, manual deployment processes. The pressure to modernize stems from crippling maintenance costs, severe security vulnerabilities (like unpatched libraries), and a fundamental inability to iterate at market speed.
Modernisation is a conscious pivot from managing technical debt to actively building technical equity. It's about engineering a resilient, observable, and flexible foundation that enables—not hinders—future development.
The True Cost of Technical Stagnation
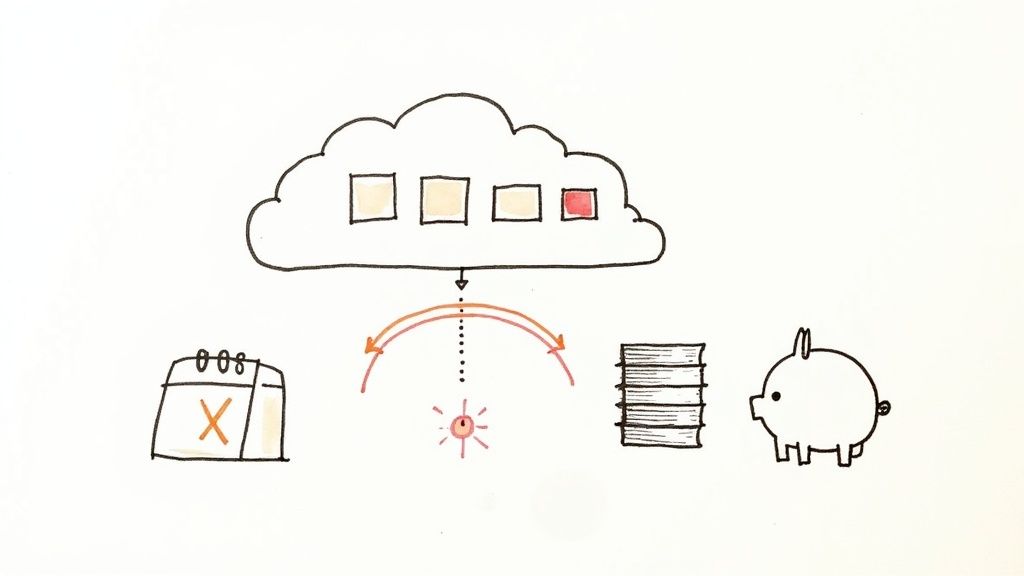
The cost of inaction compounds exponentially. It's not just the expense of maintaining COBOL or archaic Java EE applications; it's the massive opportunity cost. Every engineering cycle spent patching a fragile monolith is a cycle not invested in building features, improving performance, or scaling infrastructure.
This technical drain is why legacy system modernisation has become a critical engineering focus. A staggering 62% of organizations still operate on legacy software, fully aware of the security and performance risks. To quantify the burden, the U.S. federal government allocates roughly $337 million annually just to maintain ten of its most critical legacy systems.
For a deeper analysis of this dynamic in a regulated industry, this financial digital transformation playbook provides valuable technical context.
The engineering conversation must shift from "What is the budget for this project?" to "What is the engineering cost of not doing it?" The answer, measured in lost velocity and operational drag, is almost always greater than the modernisation investment.
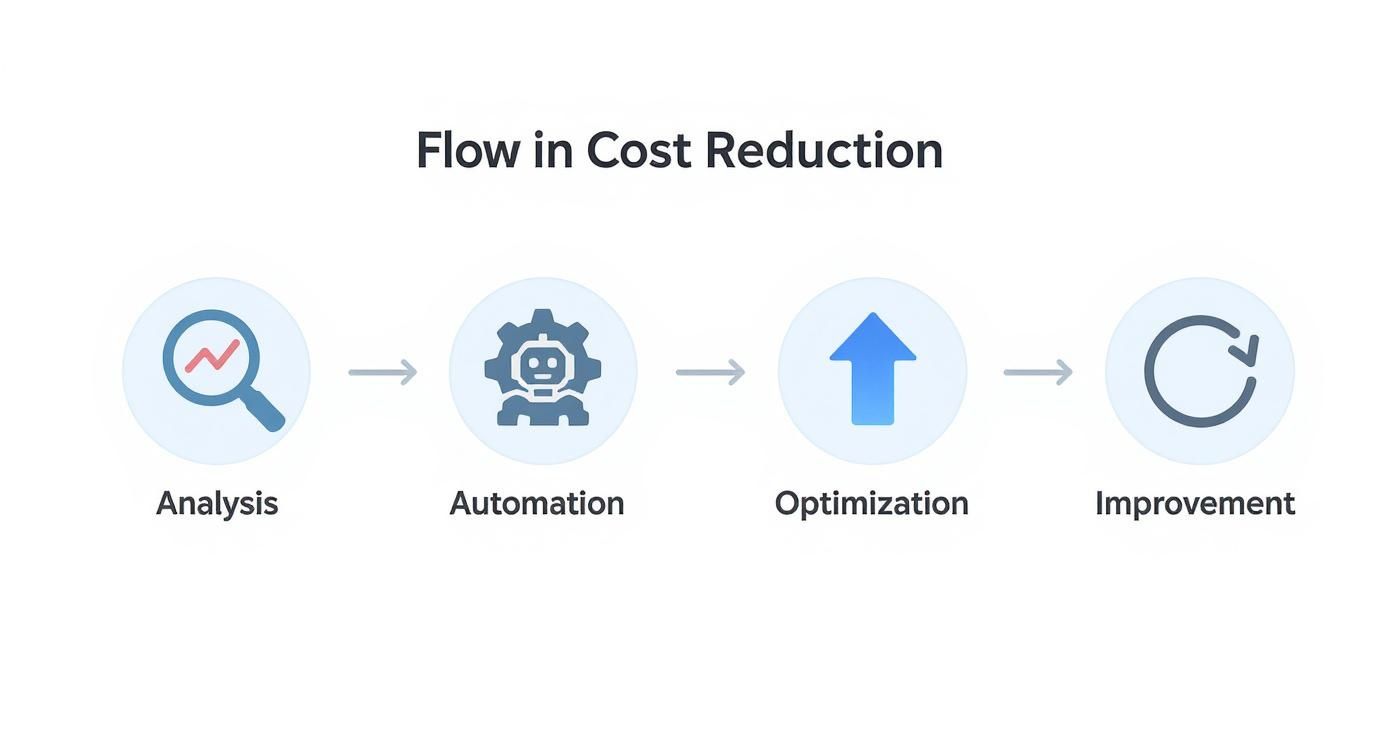
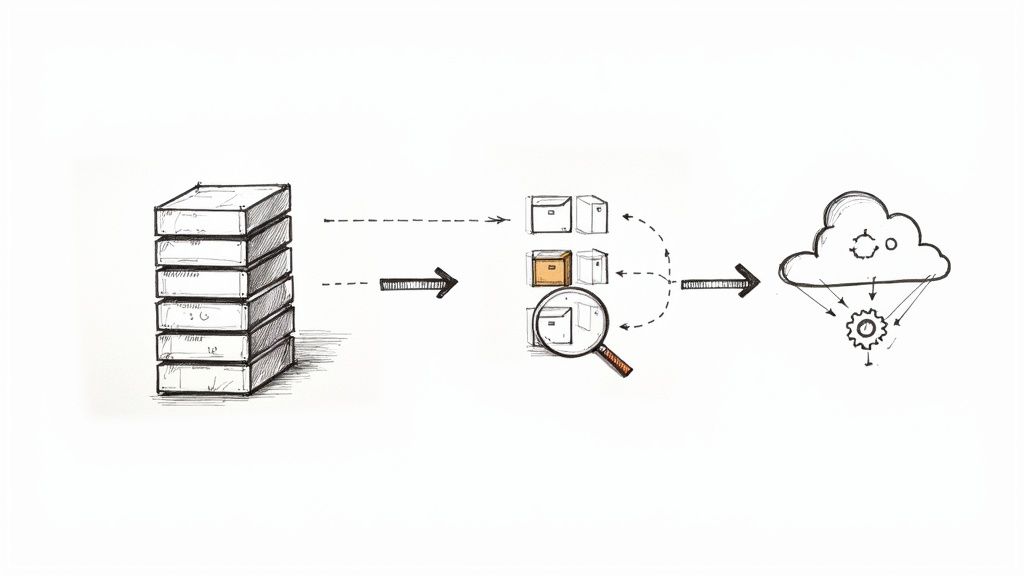
A successful modernisation initiative follows three core technical phases: assess, strategize, and execute.
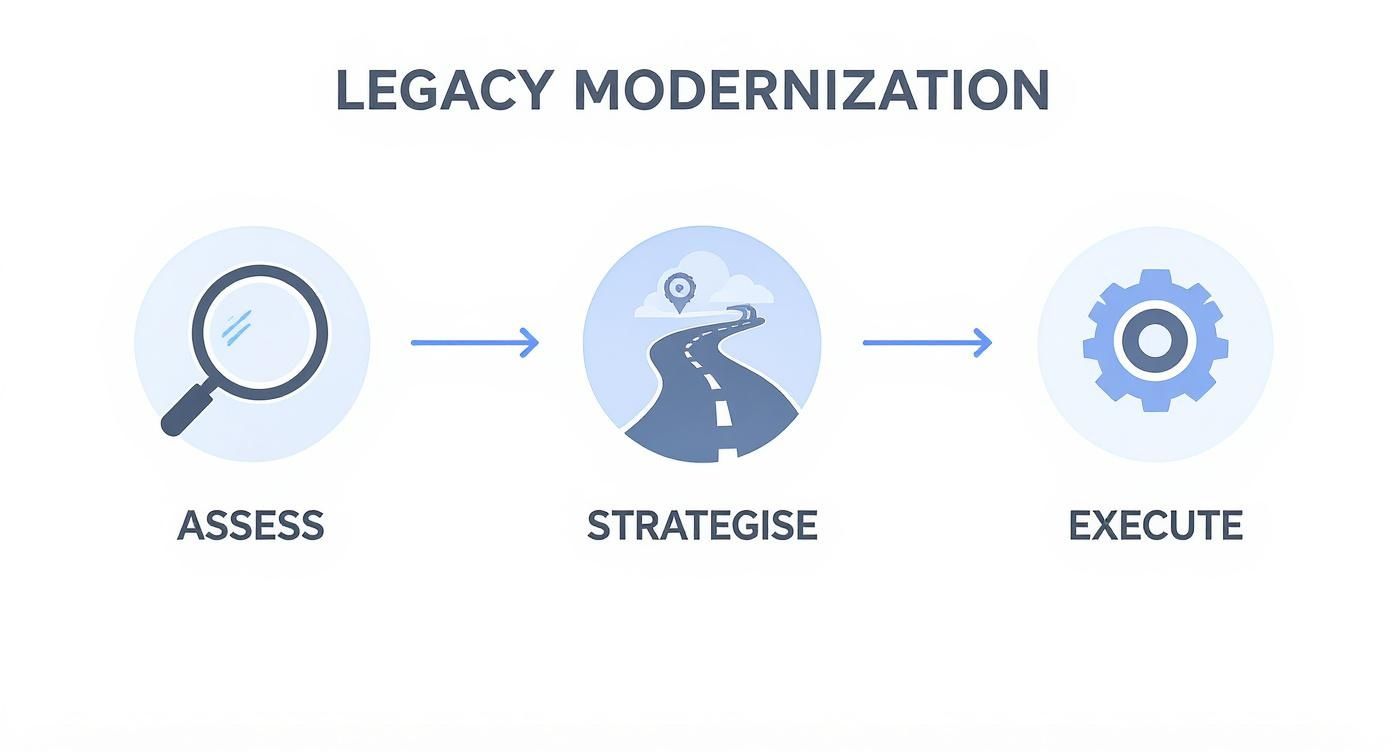
This workflow is a non-negotiable prerequisite for success. A project must begin with a deep, data-driven analysis of the existing system's architecture, codebase, and operational footprint before any architectural decisions are made. This guide provides a technical roadmap for executing each phase. For related strategies, explore our guide on how to reduce operational costs through technical improvements.
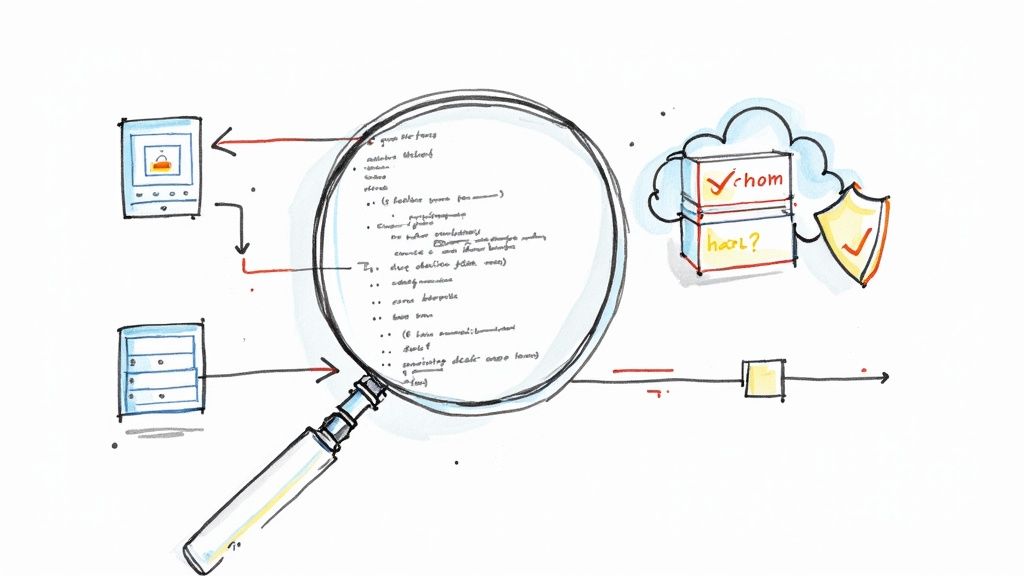
Auditing Your Legacy Environment for Modernisation
Initiating a modernisation project without a comprehensive technical audit is akin to refactoring a codebase without understanding its dependencies. Before defining a target architecture, you must perform a full technical dissection of the existing ecosystem. This ensures decisions are driven by quantitative data, not architectural assumptions.
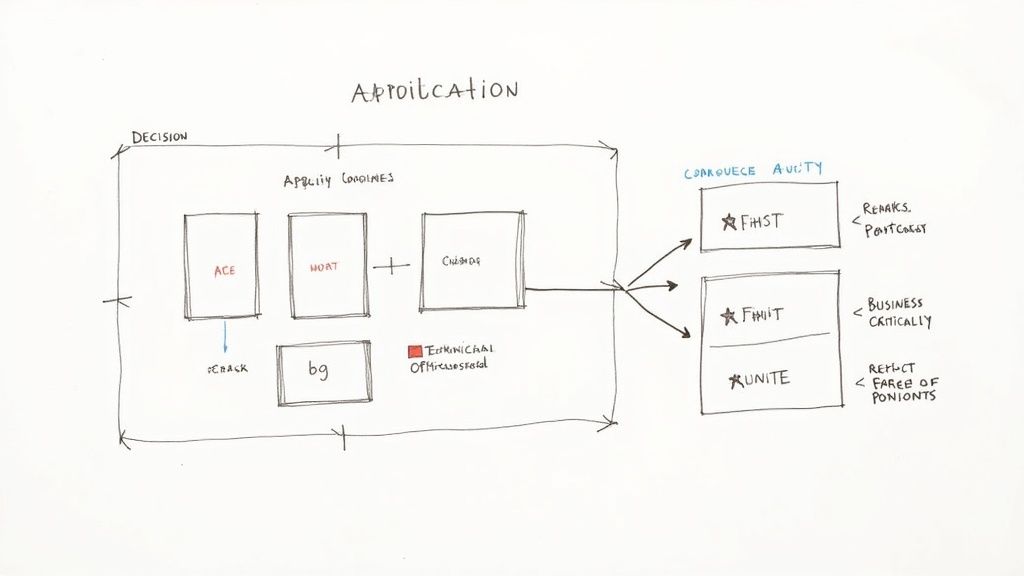
The first step is a complete application portfolio analysis. This involves cataloging every application, service, and batch job, from monolithic mainframe systems to forgotten cron jobs. The goal is to produce a definitive service catalog and a complete dependency graph.
Mapping Dependencies and Business Criticality
Untangling the spaghetti of undocumented, hardcoded dependencies is a primary challenge in legacy systems. A single failure in a seemingly minor component can trigger a cascading failure across services you believed were decoupled.
To build an accurate dependency map, your engineering team must:
- Trace Data Flows: Analyze database schemas, ETL scripts, and message queue topics to establish a clear data lineage. Use tools to reverse-engineer database foreign key relationships and stored procedures to understand implicit data contracts.
- Map Every API and Service Call: Utilize network traffic analysis and Application Performance Monitoring (APM) tools to visualize inter-service communication. This will expose undocumented API calls and hidden dependencies.
- Identify Shared Infrastructure: Pinpoint shared databases, file systems, and authentication services. These are single points of failure and significant risks during a phased migration.
With a dependency map, you can accurately assess business criticality. Classify applications using a matrix that plots business impact against technical health. High-impact applications with poor technical health (e.g., low test coverage, high cyclomatic complexity) are your primary modernisation candidates.
It's a classic mistake to focus only on user-facing applications. Often, a backend batch-processing system is the lynchpin of the entire operation. Its stability and modernisation should be the top priority to mitigate systemic risk.
Quantifying Technical Debt
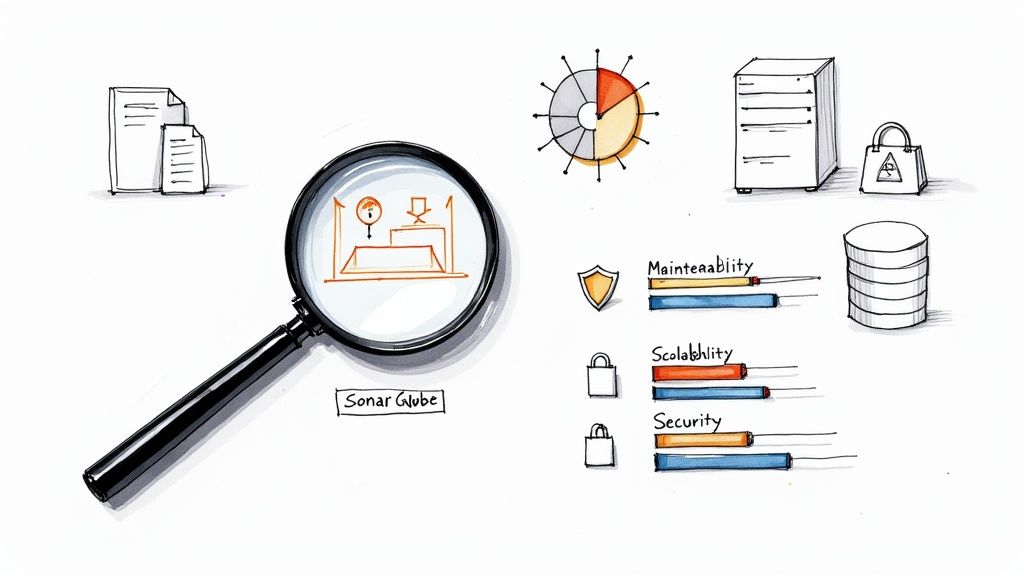
Technical debt is a measurable liability that directly impacts engineering velocity. Quantifying it is essential for building a compelling business case for modernisation. This requires a combination of automated static analysis and manual architectural review.
- Static Code Analysis: Employ tools like SonarQube to generate metrics on cyclomatic complexity, code duplication, and security vulnerabilities (e.g., OWASP Top 10 violations). These metrics provide an objective baseline for measuring improvement.
- Architectural Debt Assessment: Evaluate the system's modularity. How tightly coupled are the components? Can a single module be deployed independently? A "big ball of mud" architecture signifies immense architectural debt.
- Operational Friction: Analyze DORA metrics such as Mean Time to Recovery (MTTR) and deployment frequency. A high MTTR or infrequent deployments are clear indicators of a brittle system and significant operational debt.
Quantifying this liability is a core part of the audit. For actionable strategies, refer to our guide on how to manage technical debt. These metrics establish a baseline to prove the ROI of your modernisation efforts.
Selecting the Right Modernisation Pattern
Not every legacy application requires a rewrite into microservices. The appropriate strategy—often one of the "6 Rs" of migration—is determined by the data gathered during your audit. The choice must balance business objectives, technical feasibility, and team capabilities.
This decision matrix provides a framework for selecting a pattern:
| Pattern | Business Value | Technical Condition | Team Skills | Best Use Case |
|---|---|---|---|---|
| Rehost | Low to Medium | Good | Low (SysAdmin skills) | Quick wins. Moving a monolithic app to an EC2 instance to reduce data center costs. |
| Replatform | Medium | Fair to Good | Medium (Cloud platform skills) | Migrating a database to a managed service like AWS RDS or containerising an app with minimal code changes. |
| Refactor | High | Fair | High (Deep code knowledge) | Improving code quality and maintainability by breaking down large classes or adding unit tests without altering the external behavior. |
| Rearchitect | High | Poor | Very High (Architecture skills) | Decomposing a monolith into microservices to improve scalability and enable independent deployments. |
| Rebuild | Very High | Obsolete | Very High (Greenfield development) | Rewriting an application from scratch when the existing codebase is unmaintainable or based on unsupported technology. |
| Retire | None | Any | N/A | Decommissioning an application that provides no business value, freeing up infrastructure and maintenance resources. |
A structured audit provides the foundation for your entire modernisation strategy, transforming it from a high-risk gamble into a calculated, data-driven initiative. This ensures you prioritize correctly and choose the most effective path forward.
Designing a Resilient and Scalable Architecture
With the legacy audit complete, the next phase is designing the target architecture. This is where abstract goals are translated into a concrete technical blueprint. A modern architecture is not about adopting trendy technologies; it's about applying fundamental principles of loose coupling, high cohesion, and fault tolerance to achieve resilience and scalability.
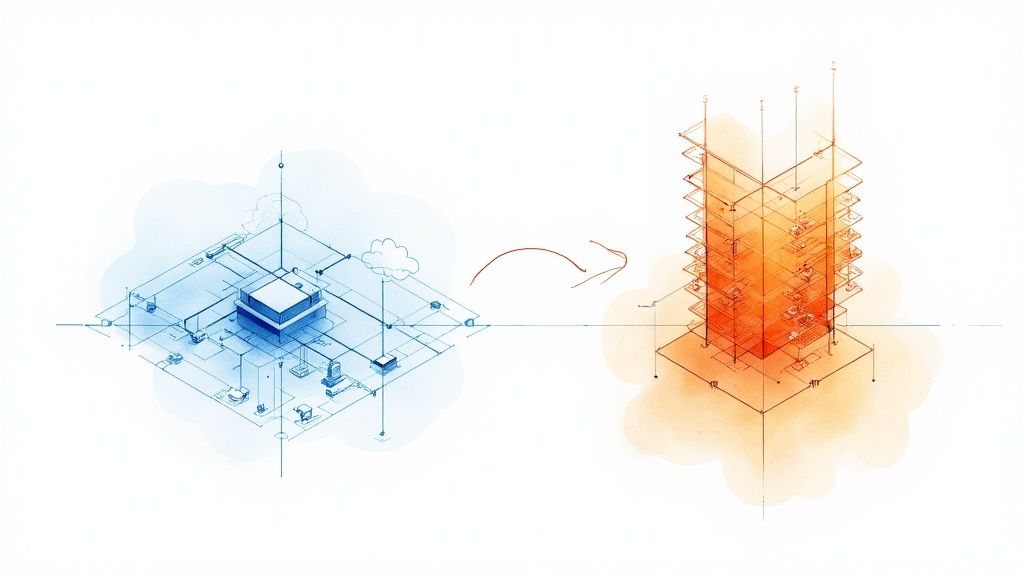
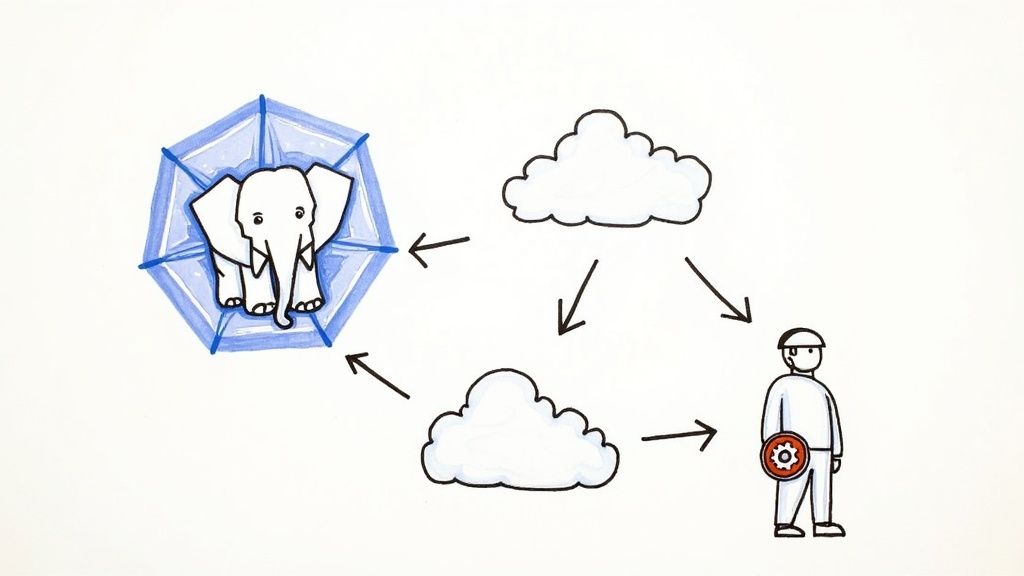
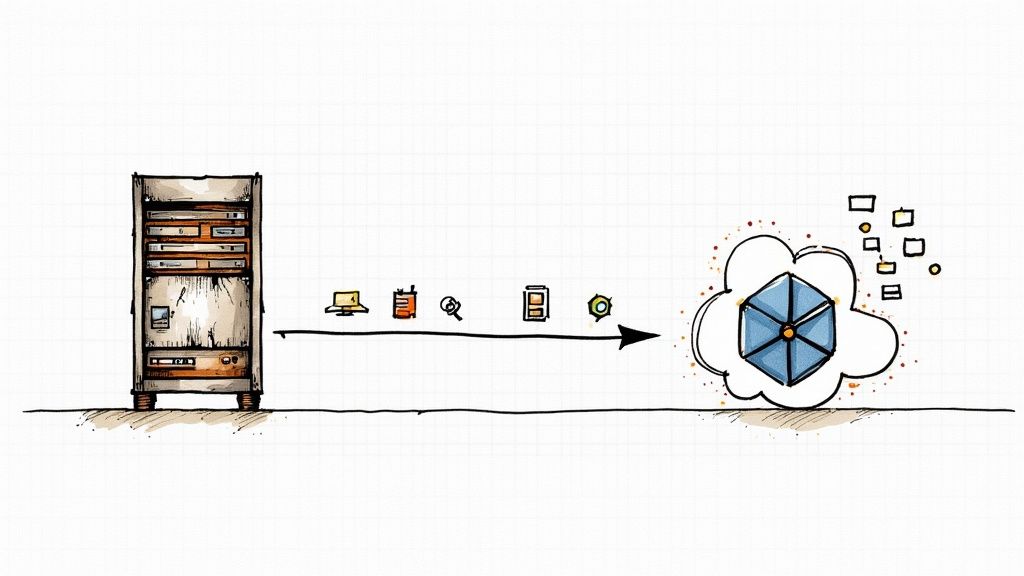
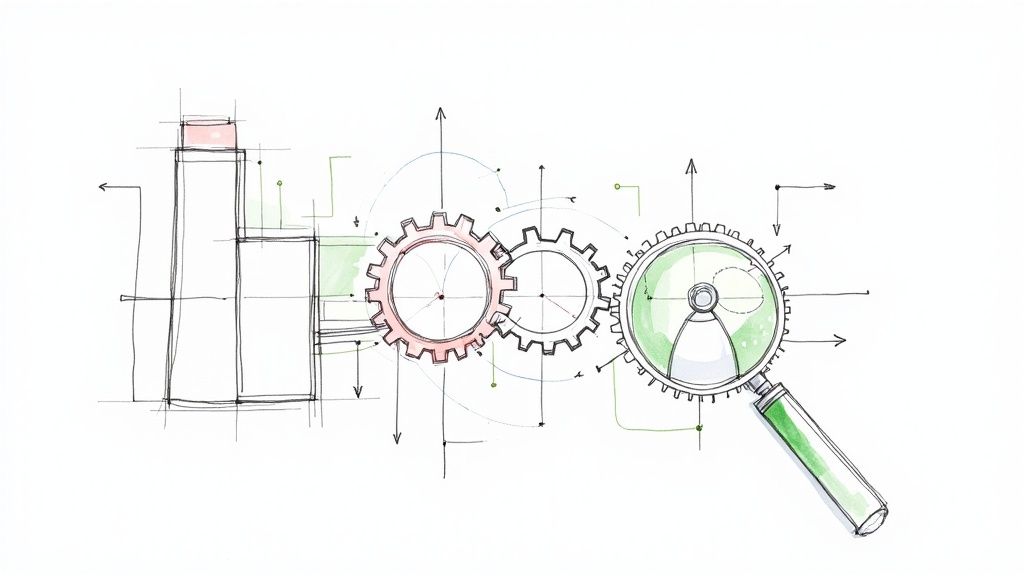
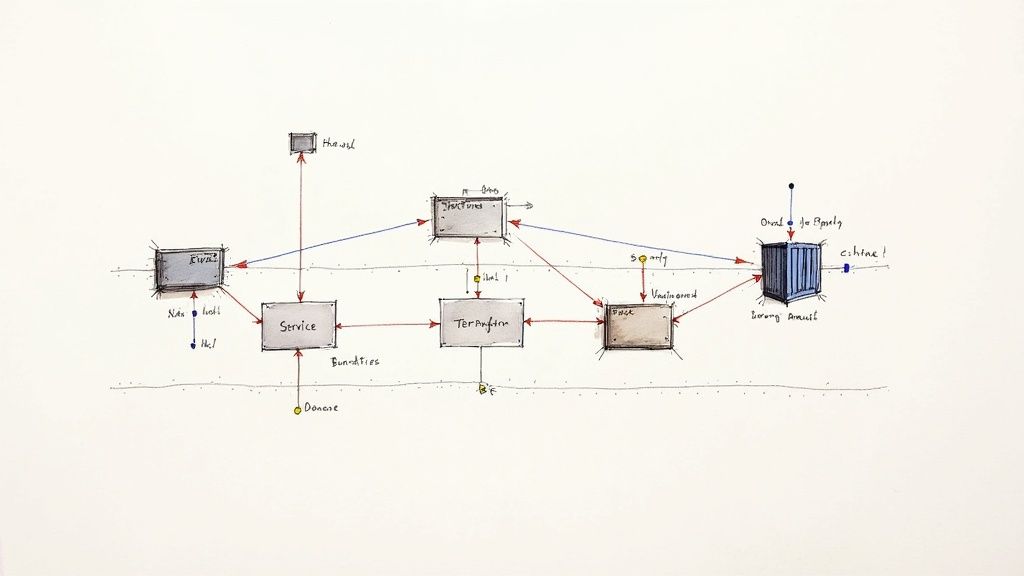
This architectural design is a critical step in any legacy system modernisation project. It lays the groundwork for escaping monolithic constraints and building a system that can evolve at the speed of business. The primary objective is to create a distributed system where components can be developed, deployed, and scaled independently.
This diagram illustrates the conceptual shift from a tightly coupled legacy core to a distributed, cloud-native architecture. A clear visual roadmap is essential for aligning engineering teams on the target state before implementation begins.
Embracing Microservices and Event-Driven Patterns
Decomposing the monolith is often the first architectural decision. This involves strategically partitioning the legacy application into a set of small, autonomous microservices, each aligned with a specific business capability (a bounded context). For an e-commerce monolith, this could mean separate services for product-catalog, user-authentication, and order-processing.
This approach enables parallel development and technology heterogeneity. However, inter-service communication must be carefully designed. Relying solely on synchronous, blocking API calls (like REST) can lead to tight coupling and cascading failures, recreating the problems of the monolith.
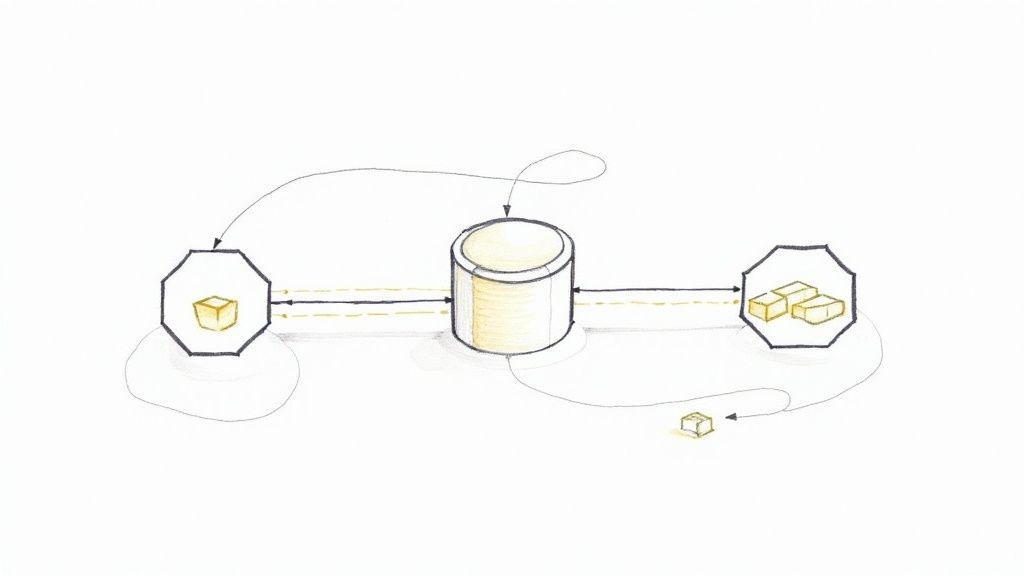
A superior approach is an event-driven architecture. Services communicate asynchronously by publishing events to a durable message bus like Apache Kafka or RabbitMQ. Other services subscribe to these events and react independently, creating a highly decoupled and resilient system.
For example, when the order-processing service finalizes an order, it publishes an OrderCompleted event to a topic. The shipping-service and notification-service can both consume this event and execute their logic without any direct knowledge of the order-processing service.
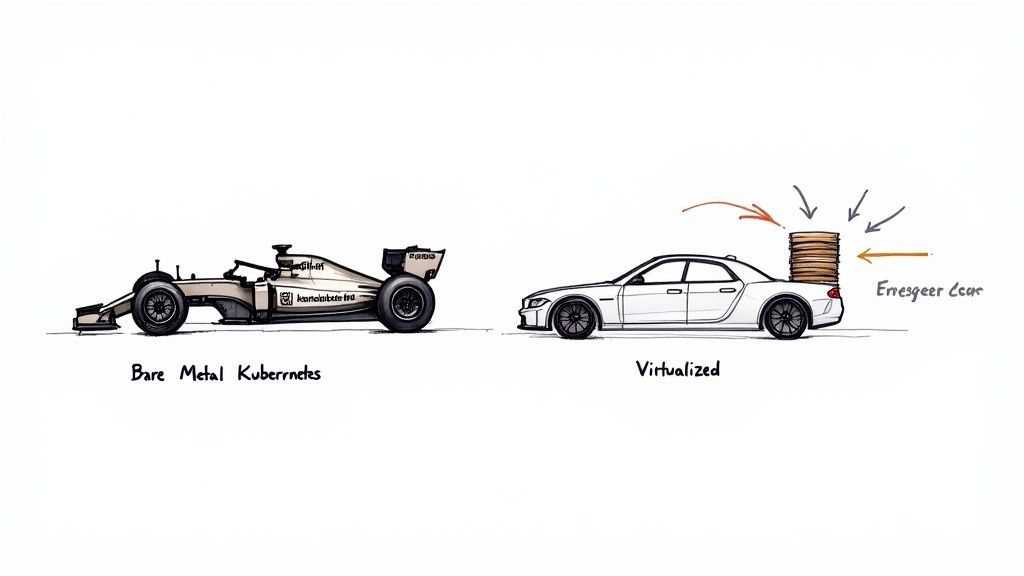
Containerisation and Orchestration with Kubernetes
Modern services require a modern runtime environment. Containerisation using Docker has become the de facto standard for packaging an application with its dependencies into a single, immutable artifact. This eliminates environment drift and ensures consistency from development to production.
Managing a large number of containers requires an orchestrator like Kubernetes. Kubernetes automates the deployment, scaling, and lifecycle management of containerized applications.
It provides critical capabilities for any modern system:
- Automated Scaling: Horizontal Pod Autoscalers (HPAs) automatically adjust the number of container replicas based on CPU or custom metrics, ensuring performance during load spikes while optimizing costs.
- Self-Healing: If a container fails its liveness probe, Kubernetes automatically restarts it or replaces it, significantly improving system availability without manual intervention.
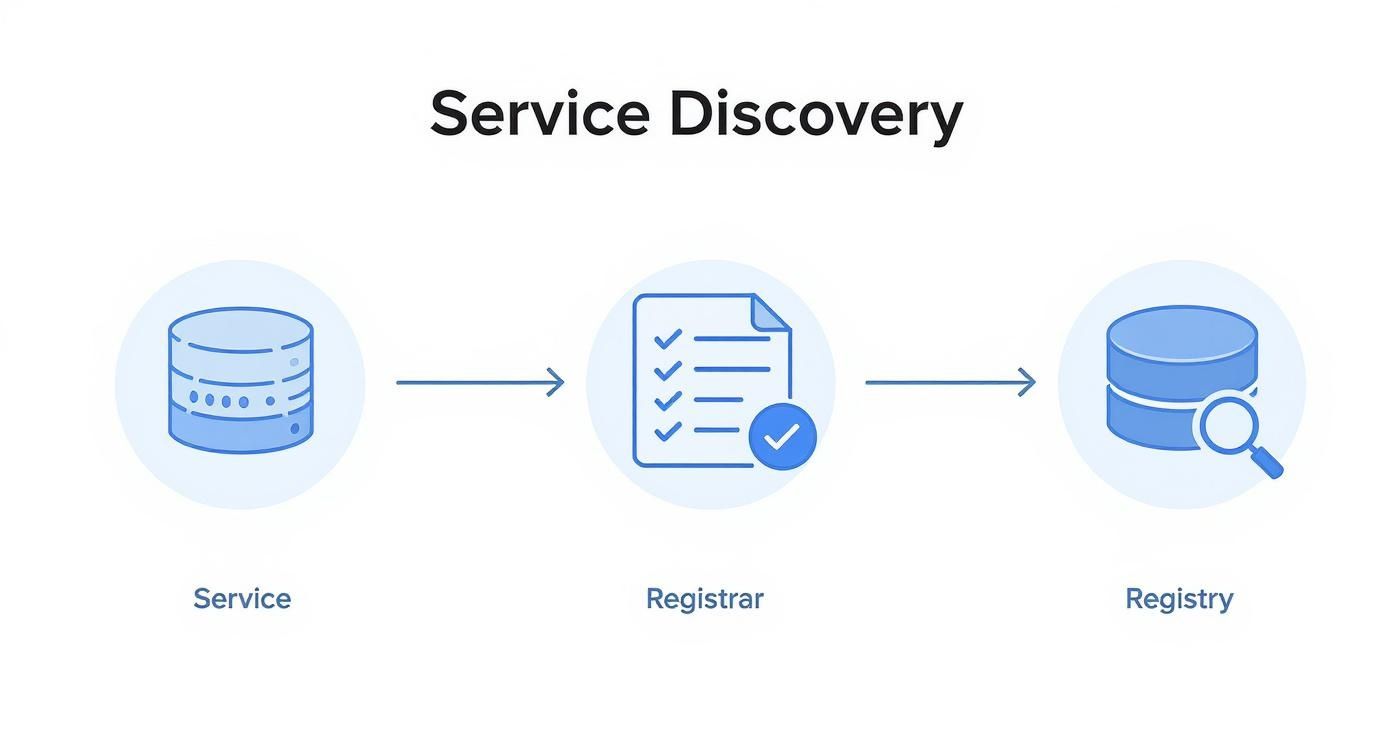
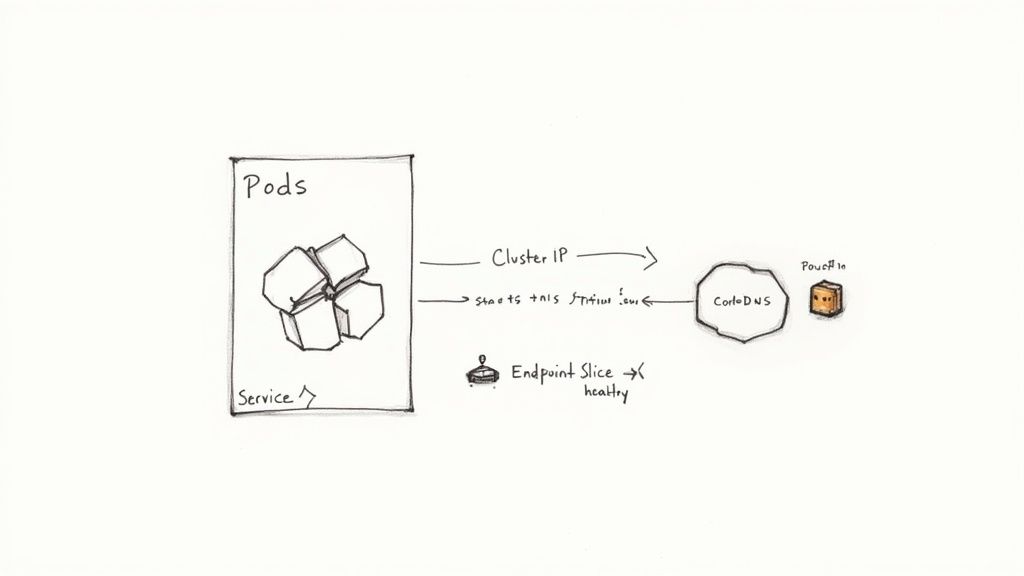
- Service Discovery and Load Balancing: Kubernetes provides stable DNS endpoints for services and load balances traffic across healthy pods, simplifying inter-service communication.
This level of automation is fundamental to modern operations, enabling teams to manage complex distributed systems effectively.
Infrastructure as Code and CI/CD Pipelines
Manual infrastructure provisioning is a primary source of configuration drift and operational errors. Infrastructure as Code (IaC) tools like Terraform or Pulumi allow you to define your entire infrastructure—VPCs, subnets, Kubernetes clusters, databases—in declarative code. This code is version-controlled in Git, enabling peer review and automated provisioning.
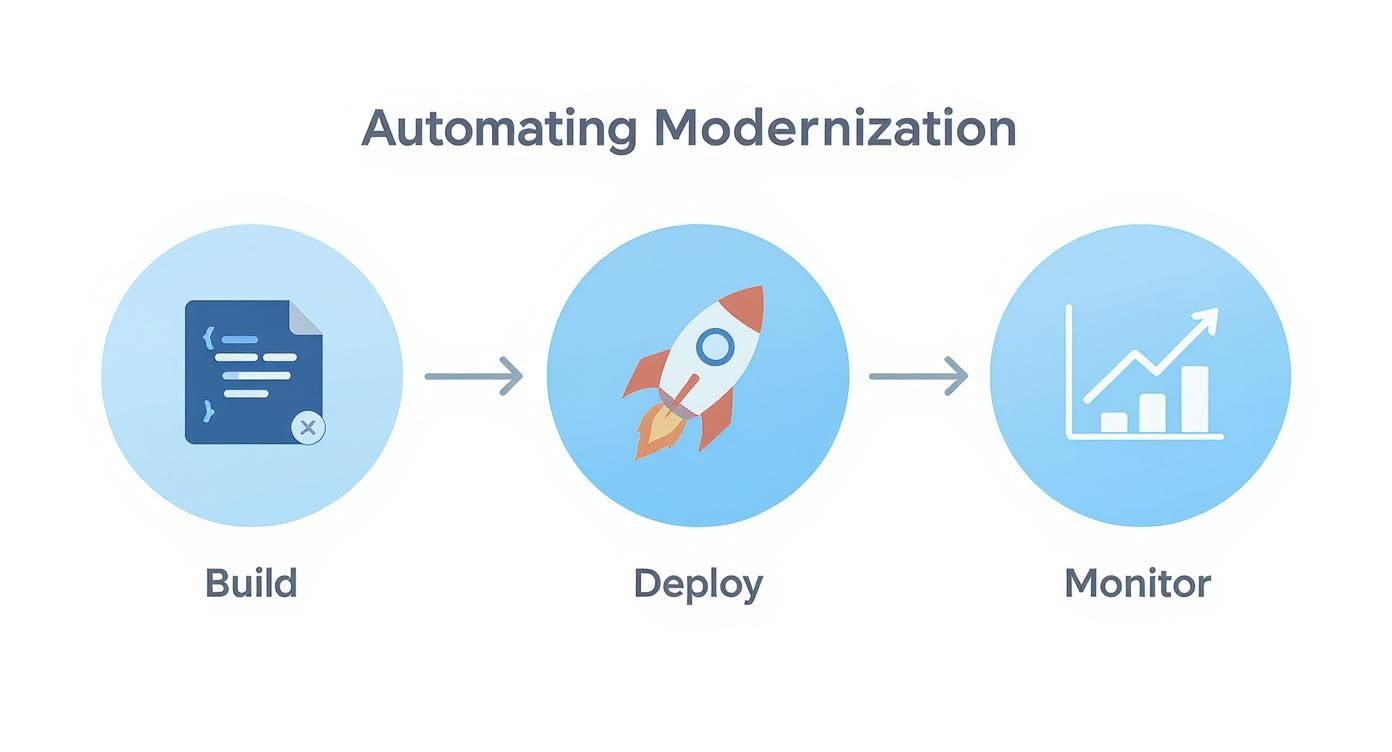
This IaC foundation is the basis for a robust Continuous Integration/Continuous Deployment (CI/CD) pipeline, managed by tools like GitLab CI or Jenkins. A mature pipeline automates the entire release process:
- Build: Compiles code and builds a versioned Docker image.
- Test: Executes unit, integration, and static analysis security tests (SAST).
- Deploy: Pushes the new image to an artifact repository and deploys it to staging and production environments using strategies like blue-green or canary deployments.
Automation enables teams to ship small, incremental changes safely and frequently, accelerating feature delivery and reducing the risk of each release.
Designing for Observability from Day One
In a distributed system, you cannot debug by SSH-ing into a server. Observability—the ability to infer the internal state of a system from its external outputs—must be engineered into the architecture from the outset.
The market reflects this necessity: the global legacy modernization services market was valued at $17.8 billion in 2023 and is projected to grow as companies adopt these complex architectures. When executed correctly, modernisation can yield infrastructure savings of 15-35% and reduce application maintenance costs by up to 50%, driven largely by the operational efficiencies of modern practices. You can find more data and legacy modernization trends at Acropolium.com.
A robust observability strategy is built on three pillars:
- Logging: Centralized logging using a stack like ELK (Elasticsearch, Logstash, Kibana) or Loki aggregates logs from all services, enabling powerful search and analysis.
- Metrics: Tools like Prometheus scrape time-series metrics from services, providing insights into system performance (latency, throughput, error rates) and resource utilization. This data powers Grafana dashboards and alerting rules.
- Distributed Tracing: Instruments like Jaeger or OpenTelemetry propagate a trace context across service calls, allowing you to visualize the entire lifecycle of a request as it moves through the distributed system and identify performance bottlenecks.
Executing a Low-Risk Migration Strategy
With a target architecture defined, the focus shifts to execution. A successful migration is not a single, high-risk "big bang" cutover; it is a meticulously planned, iterative process. The primary goal is to migrate functionality and data incrementally, ensuring business continuity at every stage.
This is the phase where your legacy system modernisation blueprint is implemented. Technical planning must align with operational reality to de-risk the entire initiative. The key is to decompose the migration into small, verifiable, and reversible steps. This allows teams to build momentum and derisk the process incrementally.
Applying the Strangler Fig Pattern
The Strangler Fig pattern is one of the most effective, low-risk methods for incremental modernisation. It involves placing a reverse proxy or API gateway in front of the legacy monolith, which initially routes all traffic to the old system. As new microservices are built to replace specific functionalities—such as user authentication or inventory management—the proxy's routing rules are updated to redirect traffic for that functionality to the new service.
This pattern offers several key advantages:
- Reduced Risk: You migrate small, isolated functionalities one at a time. If a new service fails, the proxy can instantly route traffic back to the legacy system, minimizing disruption.
- Immediate Value: The business benefits from the improved performance and new features of the modernised components long before the entire project is complete.
- Continuous Learning: The team gains hands-on experience with the new architecture and tooling on a manageable scale, allowing them to refine their processes iteratively.
Over time, as more functionality is migrated to new services, the legacy monolith is gradually "strangled" until it can be safely decommissioned.
Managing Complex Data Migration
Data migration is often the most complex and critical part of the process. Data integrity must be maintained throughout the transition from a legacy database to a modern one. This requires a sophisticated, multi-stage approach.
A proven strategy is to use data synchronization with Change Data Capture (CDC) tools like Debezium. CDC streams changes from the legacy database's transaction log to the new database in near real-time. This allows both systems to run in parallel, enabling thorough testing of the new services with live data without the pressure of an immediate cutover.
The typical data migration process is as follows:
- Initial Bulk Load: Perform an initial ETL (Extract, Transform, Load) job to migrate the historical data.
- Continuous Sync: Implement CDC to capture and replicate ongoing changes from the legacy system to the new database.
- Validation: Run automated data validation scripts to continuously compare data between the two systems, ensuring consistency and identifying any discrepancies.
- Final Cutover: During a planned maintenance window, stop writes to the legacy system, allow CDC to replicate any final transactions, and then re-point all applications to the new database as the source of truth.
Comprehensive Testing in a Hybrid Environment
Testing in a hybrid environment where new microservices coexist with legacy components is exceptionally complex. Your testing strategy must validate not only the new services in isolation but also the integration points between the old and new systems.
A critical mistake is to test new services in isolation. The real risk lies in the integration points. Your testing must rigorously validate the data contracts and communication patterns between your shiny new microservices and the decades-old monolith they still depend on.
A comprehensive testing plan must include:
- Unit & Integration Testing: Standard testing to ensure the correctness of individual services and their direct dependencies.
- Contract Testing: Using tools like Pact to verify that services adhere to their API contracts, which is essential for preventing breaking changes in a distributed system.
- End-to-End (E2E) Testing: Simulating user journeys that traverse both new microservices and legacy components to validate the entire workflow.
- Performance & Load Testing: Stress-testing the new services and the proxy layer to ensure they meet performance SLOs under production load.
Successful modernization projects often result in significant operational efficiency gains, such as 50% faster processing times. This is why IDC predicts that 65% of organizations will aggressively modernize their legacy systems. For a deeper academic analysis, see the strategic drivers of modernization in this Walden University paper.
For teams moving to a cloud-native architecture, mastering the migration process is crucial. Learn more in our guide on how to migrate to cloud. By combining the Strangler Fig pattern with a meticulous data migration and testing strategy, you can execute a modernisation that delivers value incrementally while minimizing business risk.
Managing Costs, Timelines, and Technical Teams
Modernisation projects are significant engineering investments. Effective project management is the determining factor between a successful transformation and a costly failure. The success of any legacy system modernisation hinges on precise management of budget, schedule, and team structure. It's not just about technology; it's about orchestrating the resources to implement it effectively.
This requires a holistic view that extends beyond infrastructure costs. Disciplined project management is essential to prevent scope creep and ensure alignment with business objectives. For different frameworks, it’s worth exploring how to go about mastering IT infrastructure project management strategies.
Calculating the True Total Cost of Ownership
Underestimating the Total Cost of Ownership (TCO) is a common pitfall. The cost of cloud services and software licenses is only a fraction of the total investment. A realistic TCO model must account for all direct and indirect costs over the project's lifecycle.
A comprehensive financial model must include:
- Tooling and Licensing: Costs for new CI/CD platforms, observability stacks like Prometheus or Datadog, Kubernetes subscriptions, and commercial IaC tools.
- Team Retraining and Upskilling: Budget for training engineers on new technologies such as containerisation, microservices architecture, and event-driven patterns. This is a critical investment in your team's capabilities.
- Temporary Productivity Dips: Account for an initial drop in velocity as the team adapts to new tools and workflows. Factoring this into the project plan prevents reactive course corrections later.
- Parallel Running Costs: During a phased migration (e.g., Strangler Fig pattern), you will incur costs for both the legacy system and the new infrastructure simultaneously. This period of dual operation must be accurately budgeted.
Structuring Your Modernisation Teams
Team topology has a direct impact on project velocity and outcomes. The two primary models are the dedicated team and the integrated team.
The dedicated modernisation team is a separate squad focused exclusively on the modernisation initiative. This focus accelerates progress but can create knowledge silos and lead to difficult handovers upon project completion.
The integrated product team model embeds modernisation work into the backlogs of existing product teams. This fosters a strong sense of ownership and leverages deep domain knowledge. However, progress may be slower as teams must balance this work with delivering new business features.
A hybrid model is often the most effective. A small, central "platform enablement team" can build the core infrastructure and establish best practices. The integrated product teams then leverage this platform to modernise their own services. This combines centralized expertise with decentralized execution.
Building Realistic Timelines with Agile Methodologies
Rigid, multi-year Gantt charts are ill-suited for large-scale modernisation projects due to the high number of unknowns. An agile approach, focused on delivering value in small, iterative cycles, is a more effective and less risky methodology.
By decomposing the project into sprints or delivery waves, you can:
- Deliver Value Sooner: Stakeholders see tangible progress every few weeks as new components are deployed, rather than waiting years for a "big bang" release.
- Learn and Adapt Quickly: An iterative process allows the team to learn from each migration phase and refine their approach based on real-world feedback.
- Manage Risk Incrementally: By tackling the project in small pieces, you isolate risk. A failure in a single microservice migration is a manageable issue, not a catastrophic event that derails the entire initiative.
This agile mindset is essential for navigating the complexity of transforming deeply embedded legacy systems.
Real-World Examples from the Field
Theory is useful, but practical application is paramount. At OpsMoon, we’ve guided companies through these exact scenarios.
A fintech client was constrained by a monolithic transaction processing system that was causing performance bottlenecks. We helped them establish a dedicated modernisation team to apply the Strangler Fig pattern, beginning with the user-authentication service. This initial success built momentum and demonstrated the value of the microservices architecture to stakeholders.
In another instance, a logistics company was struggling with an outdated warehouse management system. They adopted an integrated team model, tasking the existing inventory tracking team with replatforming their module from an on-premise server to a containerized application in the cloud. While the process was slower, it ensured that critical domain knowledge was retained throughout the migration.
Common Legacy Modernisation Questions
Initiating a legacy system modernisation project inevitably raises critical questions from both technical and business stakeholders. Clear, data-driven answers are essential for maintaining alignment and ensuring project success. Here are some of the most common questions we address.
How Do We Justify the Cost Against Other Business Priorities?
Frame the project not as a technical upgrade but as a direct enabler of business objectives. The key is to quantify the cost of inaction.
Provide specific metrics:
- Opportunity Cost: Quantify the revenue lost from features that could not be built due to the legacy system's constraints.
- Operational Drag: Calculate the engineering hours spent on manual deployments, incident response, and repetitive bug fixes that would be automated in a modern system.
- Talent Attrition: Factor in the high cost of retaining engineers with obsolete skills and the difficulty of hiring for an unattractive tech stack.
When the project is tied to measurable outcomes like improved speed to market and reduced operational costs, it becomes a strategic investment rather than an IT expense.
Is a "Big Bang" or Phased Approach Better?
A phased, iterative approach is almost always the correct choice for complex systems. A "big bang" cutover introduces an unacceptable level of risk. A single unforeseen issue can lead to catastrophic downtime, data loss, and a complete loss of business confidence.
We strongly advocate for incremental strategies like the Strangler Fig pattern. This allows you to migrate functionality piece by piece, dramatically de-risking the project, delivering value sooner, and enabling the team to learn and adapt throughout the process.
The objective is not a single, flawless launch day. The objective is a continuous, low-risk transition that ensures business continuity. A phased approach is the only rational method to achieve this.
How Long Does a Modernisation Project Typically Take?
The timeline varies significantly based on the project's scope. A simple rehost (lift-and-shift) might take a few weeks, while a full re-architecture could span several months to a year or more.
However, a more relevant question is, "How quickly can we deliver value?"
With an agile, incremental approach, the goal should be to deploy the first modernised component within the first few months. This could be a single microservice that handles a specific function. This early success validates the architecture, demonstrates tangible progress, and builds the momentum needed to drive the project to completion. The project is truly "done" only when the last component of the legacy system is decommissioned.
Navigating the complexities of legacy system modernisation requires deep technical expertise and strategic planning. OpsMoon connects you with the top 0.7% of DevOps engineers to accelerate your journey from assessment to execution. Get started with a free work planning session and build the resilient, scalable architecture your business needs. Find your expert at OpsMoon.