Blog

  • A Technical Guide to DevSecOps Consulting Services

    A Technical Guide to DevSecOps Consulting Services

    DevSecOps consulting provides expert engineers to integrate security controls directly into the Software Development Lifecycle (SDLC). The primary goal is to address the cybersecurity skills gap by embedding security expertise within development and operations teams, enabling them to ship secure software faster.

    From a technical standpoint, this means shifting from a traditional "gatekeeper" security model—where security reviews happen post-development—to a continuous, automated approach. The objective is to build security in, not bolt it on. This is achieved by integrating security tools and practices directly into CI/CD pipelines, Infrastructure as Code (IaC) workflows, and the developer's local environment.

    Why Expert Guidance Is a Technical Necessity

    In modern software delivery, CI/CD pipelines automate the path from code commit to production deployment. This velocity creates a significant challenge: traditional, manual security audits become bottlenecks, forcing a choice between deployment speed and security assurance. This is an unacceptable trade-off in an environment where vulnerabilities can be exploited within hours of discovery.

    DevSecOps consulting services resolve this conflict by implementing "shift-left" security principles. This means security moves from being a final, blocking stage to an automated, continuous process embedded from the initial commit through to production monitoring.

    Conceptual drawing of a building complex illustrating development, security, and safety features.

    Bridging the Critical Skills Gap

    A common organizational challenge is the knowledge gap between development, operations, and security teams. Developers are experts in application logic, not necessarily in exploit mitigation. Security professionals understand threat vectors but may lack deep knowledge of declarative IaC or container orchestration.

    DevSecOps consultants act as specialized engineers who bridge this divide by implementing tangible solutions and fostering a security-conscious engineering culture.

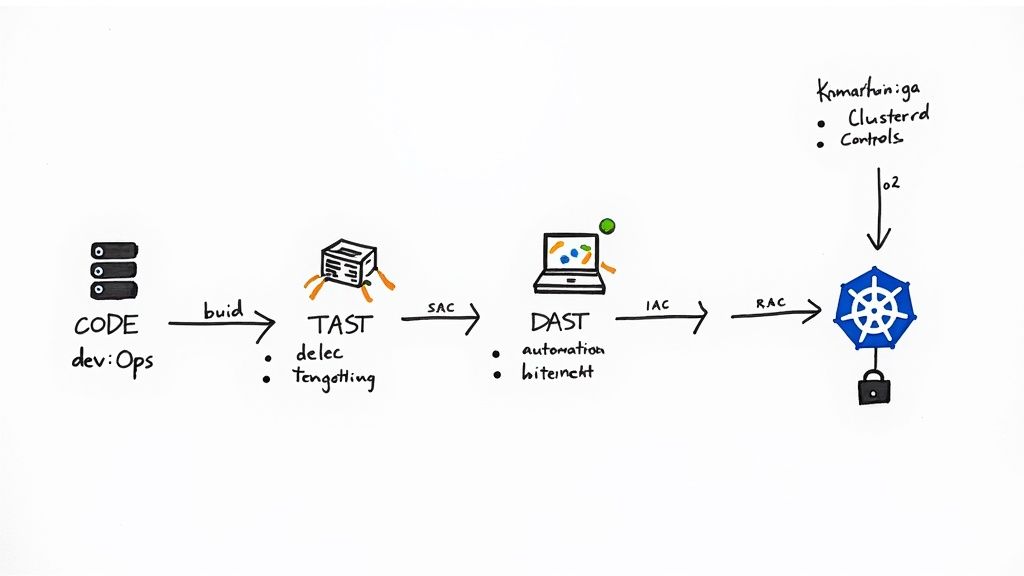
    • For Developers: They integrate automated security tools—Static Application Security Testing (SAST), Dynamic Application Security Testing (DAST), and Software Composition Analysis (SCA)—directly into Git hooks and CI pipelines. This provides immediate, context-aware feedback on vulnerabilities within the developer's existing workflow (e.g., as comments on a pull request).
    • For Operations: They codify security best practices for cloud infrastructure using IaC security scanners, harden container images with multi-stage builds and vulnerability scanning, and implement robust observability for production environments using tools like Falco for runtime threat detection.
    • For Leadership: They translate technical risk into quantifiable business impact, demonstrating how security investments align with strategic objectives and compliance mandates.

    This proactive, engineering-led model is driving market growth. The global DevSecOps market, valued at USD 5.89 billion, is projected to reach USD 52.67 billion by 2032, reflecting a fundamental shift in software engineering.

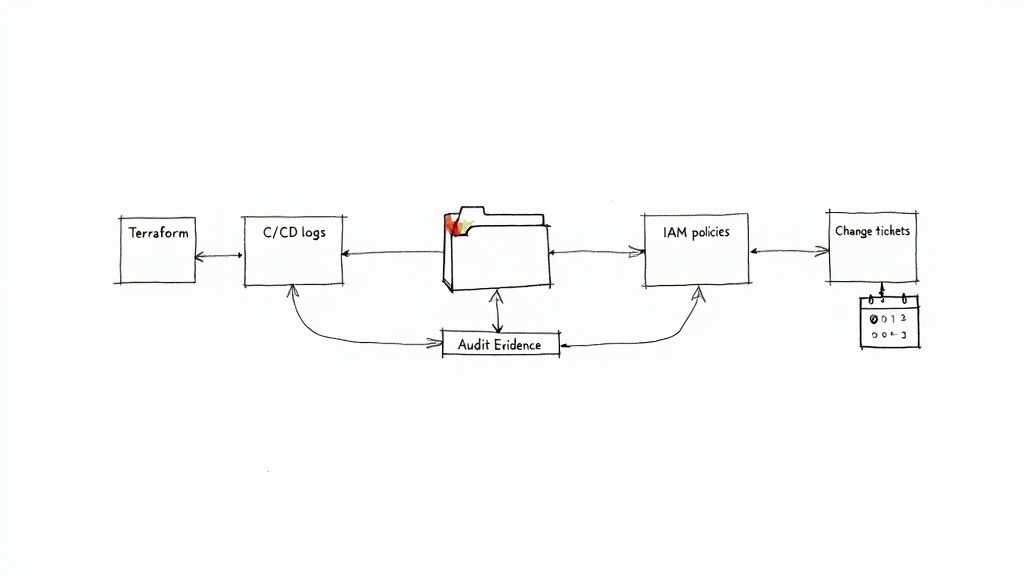
    Automating Compliance and Governance

    Regulatory frameworks like PCI DSS, HIPAA, and GDPR impose stringent requirements on data protection and system integrity. Manually auditing against these standards is slow and error-prone. See our guide on SOC 2 requirements for an example of the complexity involved.

    DevSecOps consultants address this by implementing automated governance through Policy-as-Code (PaC). This transforms compliance from a periodic manual audit into a continuous, automated validation, ensuring systems meet regulatory standards without impeding development velocity.

    A Technical Breakdown of Core Consulting Offerings

    A diagram illustrating a secure software development pipeline from build to deployment, including security testing.

    A DevSecOps consulting engagement is not about delivering high-level strategy documents. It's about deploying senior engineers to work alongside your teams, implementing and automating security controls directly within your existing toolchains and workflows.

    The value is delivered through tangible, automated security measures embedded in code and infrastructure, not just documented in a final report. Consultants target high-risk areas where development velocity and security requirements conflict, acting as specialized engineers who not only identify vulnerabilities but also build the automated systems to prevent and remediate them. This hands-on approach is a key reason North America holds a 36-42.89% market share, with projections reaching USD 4.036 billion by 2030 due to cloud-native adoption and regulatory pressures.

    Let's examine the specific technical deliverables.

    Hardening the CI/CD Pipeline

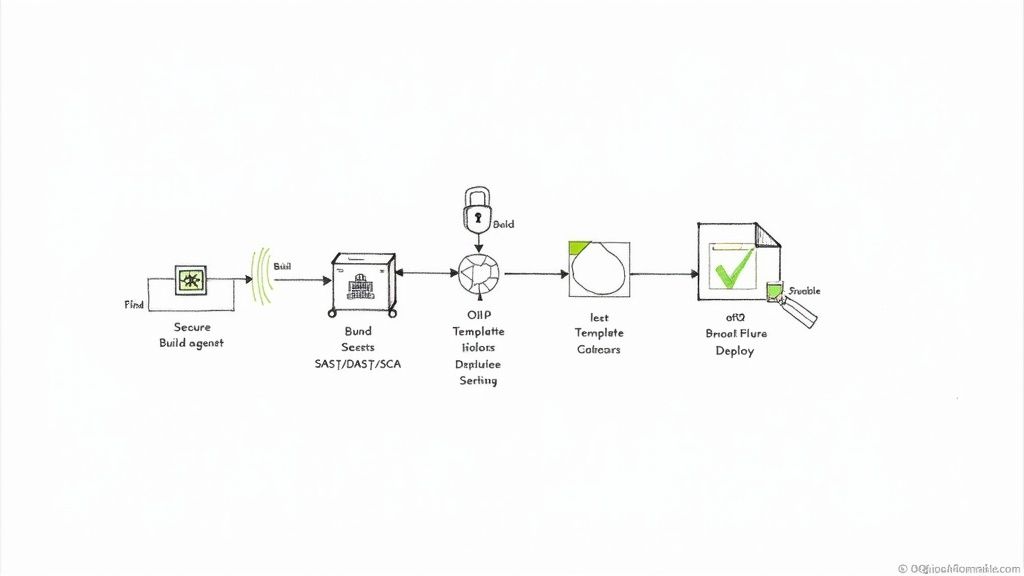
    The CI/CD pipeline is the automation backbone of software delivery. A compromised pipeline can inject vulnerabilities or malicious code into every application it builds. Consultants focus on transforming the pipeline into a secure software factory.

    This involves several critical technical implementations:

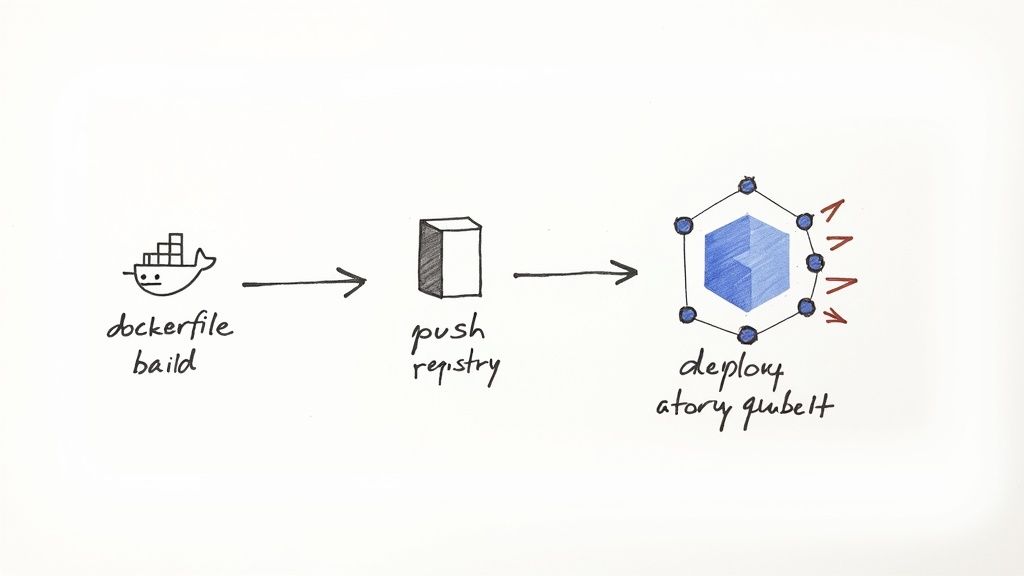
    • Securing Build Agents: Implementing ephemeral, single-use build agents with minimal privileges, network isolation, and continuous vulnerability scanning. This prevents a compromised agent from persisting or accessing other systems. For example, using AWS Fargate or Kubernetes Jobs for build execution ensures a clean environment for every run.
    • Implementing Secrets Management: Eradicating hardcoded credentials (API keys, database passwords) from source code and configuration files. This is achieved by integrating the pipeline with a centralized secrets manager like HashiCorp Vault or AWS Secrets Manager. Applications and pipelines fetch credentials at runtime via authenticated API calls, a non-negotiable practice for preventing credential leakage.
    • Integrating Security Scanners: Automating security analysis at specific pipeline stages. Static Application Security Testing (SAST) tools (e.g., SonarQube, Snyk Code) are integrated to scan source code on every commit. Software Composition Analysis (SCA) tools (e.g., OWASP Dependency-Check, Trivy) scan dependencies for known CVEs before an artifact is built. For a deep dive, see our guide to secure CI/CD pipelines.

    Conducting Infrastructure as Code Security Reviews

    Infrastructure as Code (IaC) enables rapid provisioning but also allows a single misconfiguration in a Terraform file to expose entire systems. Consultants implement automated security analysis for IaC templates, treating infrastructure definitions with the same rigor as application code.

    Specialized static analysis tools are integrated into the CI pipeline to detect security flaws before deployment:

    • Checkov or Terrascan can be configured to scan Terraform, CloudFormation, and Kubernetes manifests for misconfigurations like public S3 buckets, unencrypted databases, or overly permissive IAM roles.
    • tfsec provides Terraform-specific analysis, offering actionable feedback directly within a developer's pull request, making it easier to remediate issues pre-merge.

    This proactive approach catches infrastructure vulnerabilities at the code review stage, preventing them from ever reaching a live environment.

    Technical Example: A consultant configures a CI job that runs tfsec on every pull request targeting the main branch. If tfsec detects a security group rule allowing unrestricted ingress (0.0.0.0/0) to a sensitive port like 22 or 3389, the pipeline fails, blocking the merge and posting a comment on the PR detailing the exact line of code and remediation steps.

    Implementing Automated Compliance and Governance

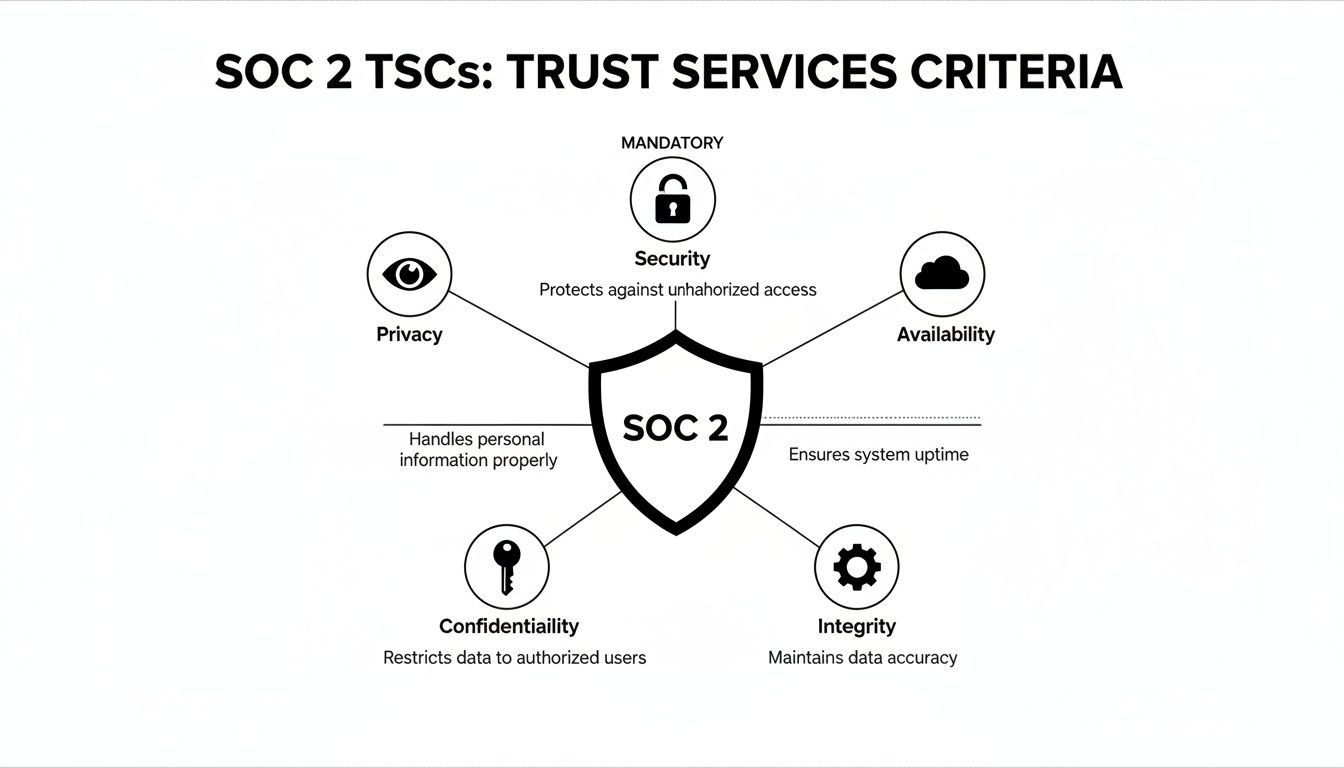
    To automate compliance with standards like SOC 2 or HIPAA, consultants implement Policy-as-Code (PaC). This practice codifies organizational and regulatory policies into machine-enforceable rules.

    The primary tool for this is often Open Policy Agent (OPA). Consultants write policies in OPA's declarative language, Rego, to enforce rules across the technology stack. For instance, a Rego policy can be integrated with a Kubernetes admission controller to automatically reject any deployment that attempts to run a container as the root user or mount a sensitive host path.

    This transforms compliance from a periodic, manual audit into a continuous, automated enforcement mechanism.

    Delivering Threat Modeling as a Service

    Threat modeling is a structured process for identifying and mitigating potential security threats during the design phase of an application or feature. Consultants facilitate these sessions, guiding engineering teams to analyze their system architecture from an attacker's perspective.

    Using frameworks like STRIDE (Spoofing, Tampering, Repudiation, Information Disclosure, Denial of Service, Elevation of Privilege), they help teams identify potential attack vectors and vulnerabilities. The output is a living document that maps threats to specific components, prioritizes them based on risk, and defines concrete technical mitigations. These mitigations are then translated into user stories and added to the development backlog, ensuring security is addressed from the earliest stage of development.

    How to Evaluate and Choose a DevSecOps Partner

    Selecting the right partner for DevSecOps consulting services requires a rigorous evaluation of their technical capabilities. You are not hiring a vendor to install software; you are bringing in a strategic engineering partner who will fundamentally alter your development and security practices.

    The evaluation must go beyond marketing materials to verify deep, hands-on technical expertise. A qualified partner must demonstrate proficiency with your technology stack, understand your compliance landscape, and deliver measurable security outcomes. The focus should be on validating their technical depth, implementation methodology, and cultural fit. A superior consultant empowers your team by transferring knowledge and implementing sustainable, automated processes, not just installing tools.

    Assessing Technical Depth and Real-World Experience

    True expertise is demonstrated through a tool-agnostic, problem-solving mindset, not a list of vendor certifications. Consultants must have production experience implementing and managing security in complex, regulated environments.

    Key areas to probe:

    • Compliance Framework Mastery: Move beyond "we handle compliance." Ask for specific examples. "Describe the architecture you designed for a client to achieve PCI DSS compliance for their Kubernetes environment. What specific controls did you implement at the network, container, and application layers?"
    • Hands-On IaC and Pipeline Security: Ask for a technical walkthrough. "Walk us through how you would secure a multi-stage GitLab CI pipeline that builds a container, pushes it to a registry, and deploys to EKS. What specific security tools would you integrate at each stage and why?"
    • Case Studies with Measurable Results: Vague claims are a red flag. Demand concrete metrics. Instead of "we improved their security," look for "reduced Mean Time to Remediate (MTTR) for critical vulnerabilities from 28 days to 2 days" or "automated 90% of security evidence collection for a SOC 2 audit."

    Choosing the Right Engagement Model

    DevSecOps consulting is not one-size-fits-all. The optimal engagement model depends on your team's current maturity, specific technical challenges, and long-term goals.

    A critical part of this evaluation involves assessing their communication and responsiveness. It’s important to understand what constitutes effective client follow-up strategies, as this often reflects their overall professionalism and commitment to partnership.

    Common engagement structures include:

    1. Project-Based Statement of Work (SOW): Best for specific, time-bound objectives, such as conducting a security maturity assessment or implementing a secure CI/CD pipeline for a key application. This model provides a fixed scope, timeline, and set of deliverables.
    2. Long-Term Advisory Retainer: Ideal for ongoing strategic guidance. The consultant functions as a fractional CISO or Principal Security Engineer, providing continuous oversight, mentoring teams on secure coding practices, and evolving the security roadmap.
    3. Team Augmentation: An embedded model where one or more consultant engineers join your team to fill a specific skill gap (e.g., cloud security, pipeline automation). This model is highly effective for hands-on knowledge transfer and accelerating project timelines. To understand this better, compare the roles of a top-tier DevOps consulting company.

    DevSecOps Vendor Evaluation Checklist

    This checklist provides a structured framework for evaluating and comparing potential DevSecOps consultants to ensure a technically sound decision.

    Evaluation Criterion What to Look For Red Flags to Avoid
    Technical Expertise Deep, hands-on experience with your specific stack (e.g., AWS, GCP, Kubernetes, GitHub Actions). Vague answers, reliance on buzzwords, inability to discuss technical trade-offs.
    Proven Methodology A clear, repeatable process for assessment, implementation, and knowledge transfer. An ad-hoc "we'll figure it out as we go" approach.
    Real-World Case Studies Concrete examples with measurable KPIs (e.g., "reduced vulnerability escape rate by X%"). Anecdotal success stories without specific data or metrics.
    Tool-Agnostic Approach Recommends tools based on technical merit and your needs, not vendor partnerships. Pushing a specific commercial tool before a thorough analysis of your environment.
    Compliance Knowledge Verifiable experience implementing controls for specific frameworks (HIPAA, PCI DSS, SOC 2). A surface-level understanding of compliance requirements without implementation details.
    Cultural Fit & Communication Ability to communicate complex technical concepts clearly to engineers and leadership. Arrogance, condescending attitude, or an unwillingness to collaborate with your team.
    Client References Eager to provide references from projects with similar technical challenges and scope. Hesitation, or providing references from unrelated projects.

    By systematically applying this checklist, you can objectively assess each vendor's capabilities and select a partner equipped to deliver tangible security improvements.

    Probing Questions to Validate Expertise

    To differentiate true experts from sales engineers, ask pointed technical questions that require practical, experience-based answers.

    • "Describe your process for tuning a SAST tool to reduce its false-positive rate. How do you balance signal vs. noise to maintain developer trust and adoption?"
    • "How would you design a secrets management strategy for a microservices architecture running on Kubernetes in a multi-cloud environment? What are the trade-offs between solutions like HashiCorp Vault and native cloud offerings like AWS Secrets Manager?"
    • "Walk us through your methodology for conducting a threat modeling workshop for a new serverless application. What specific artifacts would we receive, and how would they be integrated into our development backlog?"

    How DevSecOps Consulting Engagements Actually Work

    Engaging a DevSecOps consulting service is a technical partnership. Understanding the structure of this partnership—the engagement model—is critical for achieving measurable results. The model must align with your current technical maturity and immediate objectives. It's crucial to understand the differences between approaches like staff augmentation vs consulting, as this choice dictates the engagement's scope and outcomes.

    Let’s dissect the two most common engagement models and the specific technical deliverables you should expect from each. This ensures transparency and a clear definition of success.

    The typical engagement flow is sequential: it begins with a deep technical assessment, proceeds to hands-on implementation, and concludes with the delivery of concrete, operational assets.

    A three-step DevSecOps engagement process diagram showing Assessment, Implementation, and Deliverables.

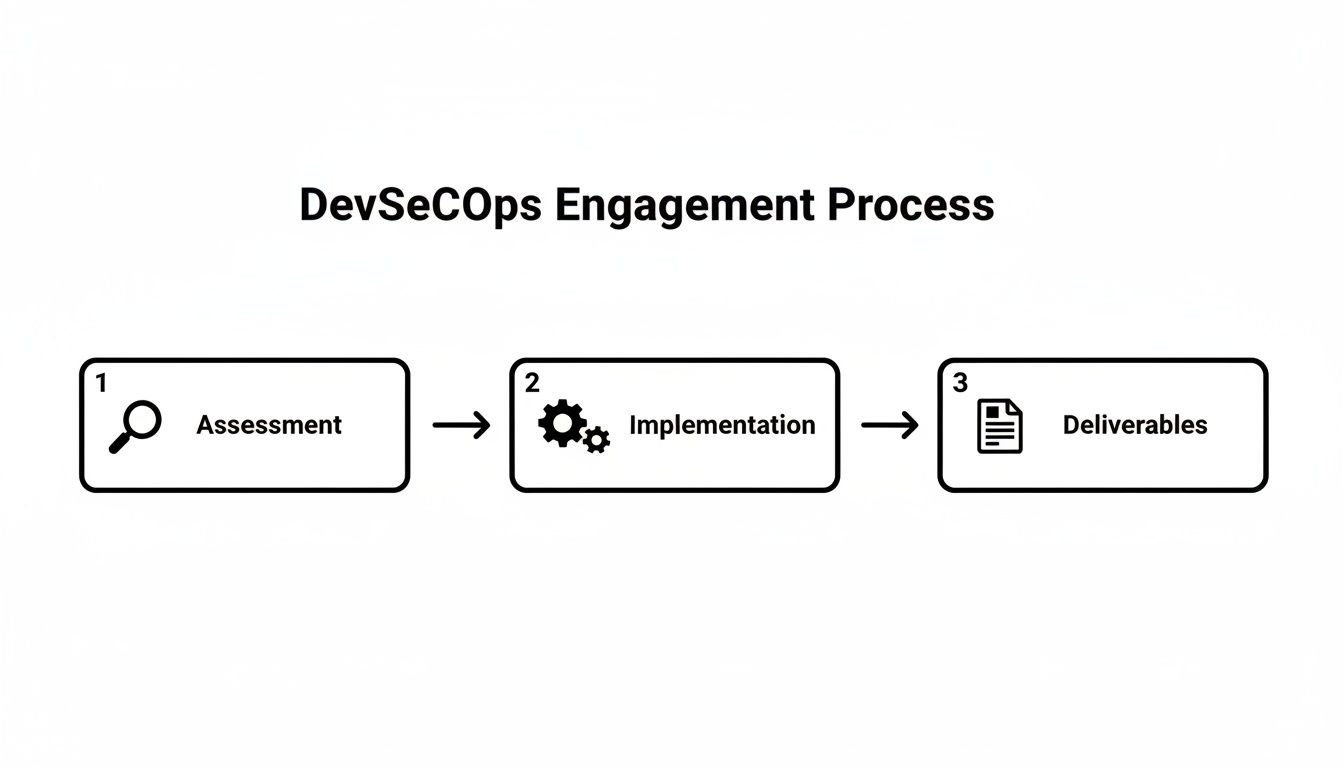
    This structured approach ensures that implementation efforts are based on a thorough understanding of your specific environment, not generic best practices.

    Model 1: The Maturity Assessment and Strategic Roadmap

    If you lack clarity on your security posture and vulnerabilities, a maturity assessment is the logical starting point. This is a comprehensive technical audit of your entire SDLC. The consultant functions as a security architect, mapping your current processes, tools, and culture against established industry frameworks.

    The goal is not merely to identify weaknesses but to produce a prioritized, actionable roadmap that answers the question: "What are the most impactful security investments we can make, and in what order?"

    A maturity assessment transforms ambiguous security concerns into a concrete, phased implementation plan. Every recommendation is justified with technical reasoning and tied to a specific risk reduction.

    Key Technical Deliverables:

    • DevSecOps Maturity Scorecard: A quantitative assessment based on a framework like OWASP SAMM or BSIMM, providing a clear baseline of your capabilities across domains like Governance, Design, Implementation, and Verification.
    • Prioritized Remediation Report: A technical document detailing identified vulnerabilities and process gaps, ranked by risk (e.g., using the DREAD model) and implementation effort. Each finding includes specific remediation guidance.
    • 12-Month Technical Roadmap: A quarter-by-quarter plan with explicit technical milestones. For example: "Q1: Integrate SAST scanning with pull request feedback in all Tier-1 application repositories. Q3: Implement Policy-as-Code to enforce TLS on all Kubernetes Ingress resources."

    Model 2: The Hands-On Pipeline Implementation

    This model is designed for organizations with a clear objective: build a secure CI/CD pipeline or harden an existing one. The consultant transitions from an architect to a hands-on implementation engineer, embedding with your team to build and configure security controls directly within your toolchain.

    This is a code-centric engagement where success is measured by the deployment of live, automated security gates and guardrails within your production pipelines.

    Key Technical Deliverables:

    • Secured Pipeline Configurations: Production-ready, version-controlled pipeline definitions (e.g., gitlab-ci.yml, GitHub Actions workflows, Jenkinsfile) with integrated security scanning stages.
    • Policy-as-Code (PaC) Artifacts: Functional Rego policies for Open Policy Agent (OPA) or configuration rules for tools like Checkov, designed to enforce your specific security and compliance requirements on IaC and Kubernetes manifests.
    • Integrated Security Dashboards: A centralized vulnerability management dashboard (e.g., in DefectDojo or a SIEM) configured to ingest, de-duplicate, and display findings from all integrated scanning tools.
    • Team Runbooks and Training: Comprehensive documentation and hands-on workshops to empower your engineers to operate, maintain, and extend the new security controls independently.

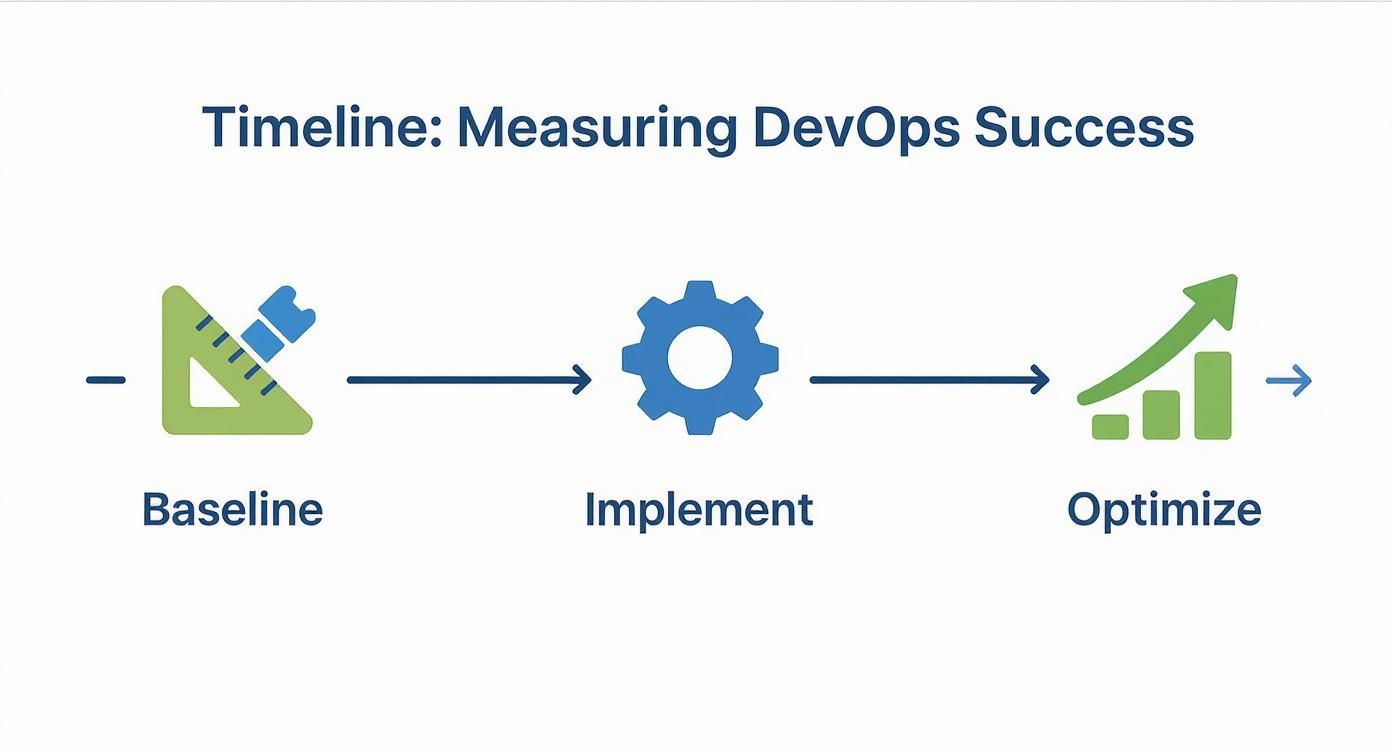
    Building Your DevSecOps Implementation Roadmap

    A continuous DevSecOps pipeline diagram showing phases: Discovery, Foundation Box, Automation, and Monitoring.

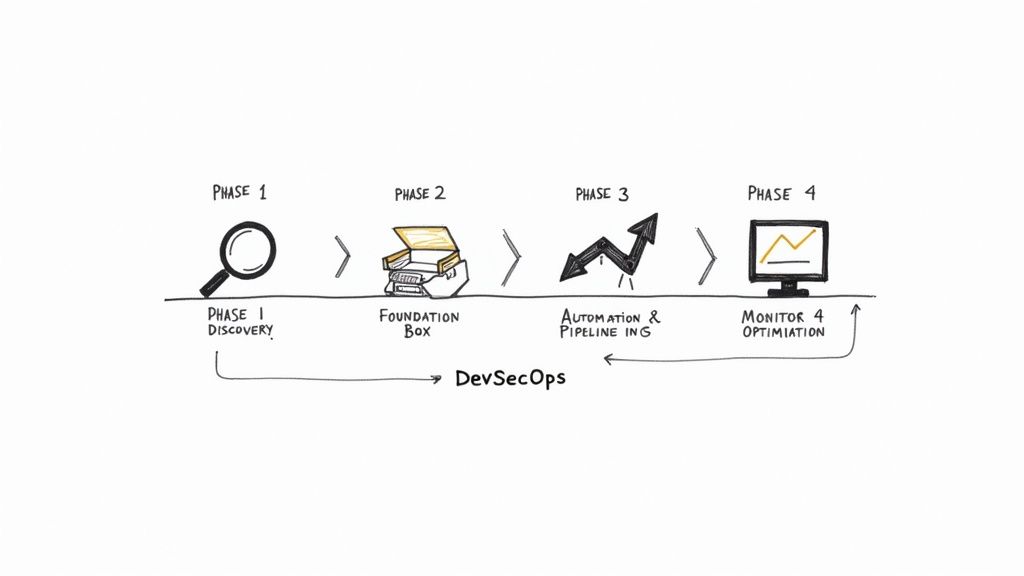
    A successful DevSecOps implementation requires a structured, phased roadmap. Attempting a "big bang" overhaul is disruptive and prone to failure. A logical, phased approach builds a solid foundation, delivers incremental value, and maintains momentum without overwhelming engineering teams.

    The process moves from discovery and baselining to foundational tool integration, followed by advanced automation and continuous monitoring. Each phase builds upon the last, culminating in a resilient, efficient, and secure SDLC. This methodology is particularly effective for small and medium-sized businesses, which are adopting DevSecOps at an 18.5% CAGR to counter increasing threats.

    Globally, organizations with mature DevSecOps practices achieve 3x faster secure software releases. This competitive advantage is crucial in an environment where the annual cost of cybercrime is projected to hit $10.5 trillion. You can find more market data from Verified Market Research.

    Phase 1 Discovery and Baseline Assessment

    The initial phase involves a thorough technical discovery to map your current SDLC, toolchain, and security posture. This intelligence-gathering stage is crucial for informed decision-making in subsequent phases. It includes technical interviews with developers and operations staff, as well as audits of CI/CD pipelines and cloud environments.

    Technical Milestones:

    • Document the end-to-end SDLC, from code commit to production deployment, identifying all tools and manual handoffs.
    • Execute initial vulnerability scans (SAST, SCA, DAST) against key applications to establish a quantitative security baseline.
    • Perform a security review of existing IaC templates (Terraform, CloudFormation) to identify critical misconfigurations.

    The primary deliverable is a technical report detailing your current security maturity, identifying critical gaps, and proposing a high-level implementation plan.

    Phase 2 Foundation and Toolchain Integration

    With a clear baseline established, this phase focuses on integrating foundational security tools into the developer's immediate workflow. The goal is to "shift left" by providing developers with fast, actionable security feedback within their existing tools (IDE, Git, CI system).

    This is where cultural transformation begins, as security becomes a visible and integrated part of the daily development process.

    Technical Note: The success of this phase hinges on the quality of the feedback loop. Tools must be configured to provide low-noise, high-signal alerts. If developers are inundated with false positives, they will ignore the tooling, rendering it ineffective.

    Technical Milestones:

    • Integrate a Static Application Security Testing (SAST) tool into CI builds for feature branches, providing feedback directly in pull requests.
    • Implement Software Composition Analysis (SCA) to scan third-party dependencies for known vulnerabilities on every build.
    • Introduce a secrets detection tool (e.g., Git-leaks, TruffleHog) as a pre-commit hook and a CI pipeline step to prevent credentials from being committed to repositories.

    Phase 3 Pipeline Automation and Policy Enforcement

    This phase builds on the foundational tools by automating security enforcement within the CI/CD pipeline. The focus shifts from simply notifying developers of issues to actively blocking insecure code from progressing to production. Policy-as-Code is implemented to enforce security and compliance rules automatically.

    Consider the case of "Innovate Inc." They transitioned from manual security reviews to an automated pipeline that failed any build containing a critical CVE or a hardcoded secret. A key challenge was tuning the SAST tool to eliminate false positives; this was solved by developing a custom ruleset tailored to their specific codebase and risk profile. The result was a 50% reduction in critical vulnerabilities reaching production within six months.

    Technical Milestones:

    • Configure the CI/CD pipeline to "break the build" if security scans exceed a predefined risk threshold (e.g., >0 critical vulnerabilities).
    • Deploy Dynamic Application Security Testing (DAST) scans to run automatically against applications in a staging environment post-deployment.
    • Implement policy-as-code using tools like Open Policy Agent (OPA) to enforce infrastructure security standards (e.g., ensuring all S3 buckets block public access).

    Phase 4 Continuous Optimization and Observability

    This is an ongoing phase focused on continuous improvement. With a secure, automated pipeline in place, the focus shifts to advanced threat detection, security observability, and tightening the feedback loop. Production security events are monitored and the intelligence is fed back into the development lifecycle to proactively address threats.

    Technical Milestones:

    • Aggregate logs and events from all security tools into a centralized observability platform (e.g., a SIEM or logging solution like Splunk or ELK Stack) for unified analysis and alerting.
    • Implement container security scanning in the registry (on push) and at runtime (using agents like Falco or Aqua Security).
    • Establish a formal process for conducting threat modeling workshops for all new features or services.

    This continuous feedback loop ensures your security posture evolves to meet new threats, maximizing the long-term value of your DevSecOps consulting services engagement.

    Got Questions About DevSecOps Consulting? We've Got Answers.

    Engaging with DevSecOps consulting services often brings up practical questions about scope, cost, and ROI. Here are technical answers to the most common inquiries.

    How Long Does a Typical Engagement Last?

    The duration is dictated by the scope. A focused Maturity Assessment and Strategic Roadmap is typically a 4 to 6-week engagement. This involves deep-dive analysis and results in a detailed, actionable plan.

    A hands-on Secure CI/CD Pipeline Implementation usually requires 3 to 6 months, depending on the complexity of your environment and the number of pipelines in scope. For large-scale enterprises with complex regulatory needs, engagements can extend to 12 months or more, often transitioning into an ongoing advisory retainer for continuous improvement.

    Can We Use Our Existing Tools?

    Yes, this is the preferred approach. A competent consultant leverages and optimizes your existing toolchain first. Their initial objective is to maximize the value of your current investments.

    Whether your ecosystem is built on Jenkins, GitLab CI, or GitHub Actions, the first step is to integrate security controls into those existing workflows. New tools are only recommended when there is a clear capability gap that cannot be filled by existing systems, or when a new tool offers a significant ROI in terms of risk reduction or operational efficiency. The goal is seamless integration, not a disruptive "rip and replace."

    Technical Insight: A consultant's value is often demonstrated by their ability to make your existing tools more effective. For example, instead of replacing your logging tool, they might build custom parsers and correlation rules to better detect security events. Immediate recommendations for a full toolchain replacement without a deep technical justification should be viewed with skepticism.

    What Is the Typical Cost of DevSecOps Consulting?

    Costs vary based on the engagement model. For time-and-materials contracts, hourly rates for senior DevSecOps engineers typically range from $150 to over $400.

    Fixed-price projects are common for well-defined scopes. A Security Maturity Assessment may cost between $20,000 and $40,000. A full CI/CD pipeline security implementation can range from $80,000 to $250,000+. Always demand a detailed Statement of Work (SOW) that explicitly defines all activities, technical deliverables, and costs to avoid scope creep and budget overruns.

    How Do We Measure the ROI of an Engagement?

    The ROI of a DevSecOps engagement must be measured using specific, quantifiable metrics. Track these KPIs from the beginning to demonstrate tangible improvement.

    Key Technical KPIs:

    • Vulnerability Escape Rate: The percentage of vulnerabilities discovered in production versus those caught pre-production. This should decrease significantly.
    • Mean-Time-to-Remediate (MTTR): The average time taken to fix a detected vulnerability. A successful engagement will drastically reduce this time.
    • Deployment Frequency: The rate at which you can deploy to production. With security bottlenecks removed, this metric should increase.

    Key Business Metrics:

    • Cost Avoidance: The estimated cost of security breaches that were prevented, calculated using industry data (e.g., average cost per record breached).
    • Compliance Adherence: Reduced time and cost for audits, and avoidance of non-compliance penalties.
    • Time-to-Market: The speed at which new features are delivered to customers. Removing security as a blocker directly accelerates this, providing a competitive edge.

    Ready to build a security-first culture without slowing down your developers? At OpsMoon, we provide the expert DevSecOps engineers you need to harden your pipelines and protect your infrastructure. Start with a free work planning session today to map out your secure software delivery roadmap.

  • A CTO’s Guide to the 10 Key Pros and Cons of Offshore Outsourcing in 2025

    A CTO’s Guide to the 10 Key Pros and Cons of Offshore Outsourcing in 2025

    In today's hyper-competitive landscape, CTOs and engineering leaders constantly navigate the build vs. buy dilemma, especially for critical functions like DevOps and platform engineering. Offshore outsourcing presents a compelling value proposition: access to a global talent pool, accelerated timelines, and significant cost efficiencies. However, this strategic lever is not without its complexities. Missteps in communication, quality control, or security can quickly erode any potential gains, turning a cost-saving initiative into a source of technical debt and operational friction.

    This guide moves beyond the surface-level debate to provide a technical, actionable breakdown of the key pros and cons of offshore outsourcing. We will dissect the most critical factors engineering leaders must weigh, offering a decision framework to determine if, and how, offshoring aligns with your technical roadmap and business objectives. For organizations considering specific geographic hubs, understanding the local corporate landscape is paramount. To truly decode the strategic imperative of offshore outsourcing for modern engineering, it is crucial to consult a comprehensive strategic guide to offshore companies in UAE that details their role in streamlining setup, reducing taxes, and expanding regional reach.

    We'll explore a balanced view, presenting both the immense opportunities and the significant risks. You will gain insights into:

    • Cost vs. Control: Analyzing the real total cost of ownership beyond just labor arbitrage.
    • Talent & Scalability: Leveraging global expertise without sacrificing internal alignment.
    • Risk Mitigation: Actionable strategies for managing IP, security, and communication challenges.
    • Decision Frameworks: A practical guide for evaluating if offshoring is the right move for your engineering team.

    This article equips you with the insights needed to make an informed, strategic decision, ensuring your outsourcing strategy is a powerful enabler, not a hidden liability.

    1. Pro: Cost Reduction and Labor Arbitrage

    The most significant and often primary driver behind the pros and cons of offshore outsourcing is the potential for substantial cost savings through labor arbitrage. By leveraging wage differentials between high-cost regions like North America or Western Europe and talent hubs in Eastern Europe, Asia, or Latin America, companies can reduce operational expenditures by 40-60%. This isn't merely about cutting salary costs; it's a strategic reallocation of capital. The funds saved on recurring payroll can be redirected toward core business functions like product innovation, marketing campaigns, or upgrading engineering tooling.

    A hand-drawn illustration depicts a balance scale where 'costs' (coins, dollar sign) outweigh 'value' (globe).

    For engineering and DevOps teams, this financial lever fundamentally alters budget allocation possibilities. The fully-loaded cost of a single senior SRE in a major US tech hub could potentially fund an entire offshore team of three to four mid-level engineers. This dramatically increases engineering output per dollar spent, enabling startups and enterprises alike to tackle more ambitious projects—like a full-scale migration to a service mesh architecture—that would otherwise be cost-prohibitive.

    Key Insight: Effective labor arbitrage is less about finding the cheapest option and more about optimizing your "talent-to-cost" ratio to maximize engineering velocity and project scope within a fixed budget.

    Practical Implementation and Actionable Tips

    To realize these savings without sacrificing quality, a disciplined approach is crucial.

    • Conduct a Total Cost of Ownership (TCO) Analysis: Look beyond salary comparisons. Your TCO model must include costs for management overhead (e.g., 15% of an onshore manager's time), new communication tools (e.g., premium Slack/Zoom licenses), potential travel for initial onboarding, and any legal or administrative fees. A comprehensive TCO reveals the true financial impact.
    • Establish Ironclad Service Level Agreements (SLAs): Vague agreements lead to poor outcomes. Define precise, quantifiable metrics from day one. For a DevOps team, this could include CI/CD pipeline uptime percentages (e.g., 99.9%), maximum ticket response times (e.g., P1 incidents under 15 mins), and code deployment failure rates (e.g., <5%).
    • Budget for Intensive Onboarding: Earmark funds and engineering time for an initial 1-3 month period dedicated to knowledge transfer, cultural integration, and process alignment. This upfront investment prevents costly misunderstandings and rework later.

    This financial strategy extends beyond technical roles. Many organizations find similar efficiencies in other specialized functions. To see how this applies elsewhere, you can explore the advantages of outsourcing accounting for a parallel perspective on leveraging external expertise to reduce overhead.

    2. Pro: Access to Global Talent Pool and Specialized Expertise

    Beyond cost savings, one of the most compelling pros of offshore outsourcing is gaining access to a worldwide talent pool. Local hiring markets, especially in major tech hubs, are often saturated and fiercely competitive, making it difficult and expensive to find engineers with niche skills. Offshoring unlocks access to specialized expertise in emerging technology centers across Eastern Europe, Asia, and Latin America, where specific tech stacks or disciplines may have a deeper talent concentration.

    This allows companies to find professionals with rare, high-demand skills, such as Kubernetes security, advanced serverless architecture, or specific cloud-native observability tooling, that might be unavailable or cost-prohibitive domestically. For instance, tech giants like Microsoft and Google have established major engineering centers in India and Poland not just for cost, but to tap into the rich veins of highly qualified software and systems engineers graduating from top local universities. This strategy allows them to build specialized teams that can innovate around the clock.

    Key Insight: Offshore outsourcing transforms hiring from a localized constraint into a global opportunity, enabling you to build a team based on required skills and expertise rather than geographical limitations.

    Practical Implementation and Actionable Tips

    To effectively leverage this global talent without introducing operational chaos, a strategic approach is essential.

    • Map Skills to Regions: Don't search globally without a plan. Research which regions are known for specific technical strengths. For example, some Eastern European countries are renowned for their deep expertise in complex algorithms and cybersecurity, while certain hubs in Southeast Asia have a strong focus on mobile development and quality assurance.
    • Implement a Rigorous, Standardized Vetting Process: Create a technical and cultural vetting process that is applied consistently across all candidates, regardless of location. This should include hands-on coding challenges (e.g., deploying a sample app on Kubernetes via a GitOps workflow), systems design interviews, and scenario-based problem-solving that reflects real-world challenges your team faces.
    • Foster Knowledge-Sharing Channels: Use dedicated Slack channels, internal wikis (like Confluence), and regular cross-team "lunch and learn" sessions to ensure specialized knowledge from the offshore team is documented and shared with the entire organization. This prevents knowledge silos from forming.

    Strategically tapping into this global market can be a powerful way to augment your existing team. For a deeper dive into sourcing and integrating specialized roles, you can explore detailed strategies on how to hire remote DevOps engineers and build a cohesive, high-performing distributed team.

    3. Pro: 24/7 Operations and Round-the-Clock Productivity

    One of the most powerful strategic advantages within the pros and cons of offshore outsourcing is the ability to establish a "follow-the-sun" model for continuous operations. By strategically distributing engineering and DevOps teams across multiple time zones, companies can achieve a truly 24/7 workflow. Work handed off at the close of business in a US office can be picked up and advanced by a team in Asia or Eastern Europe, effectively eliminating downtime and drastically compressing project timelines.

    A hand-drawn globe surrounded by clocks and arrows, with '24/7' text, symbolizing continuous global availability.

    For engineering leaders, this means a critical bug discovered at 6 PM in California doesn't have to wait until the next morning for a fix. An offshore team can triage, develop, and deploy a patch while the US-based team is offline. This model transforms support and maintenance from a reactive, time-gated function into a proactive, continuous service. Companies like Microsoft and Cisco have long leveraged this model to maintain global service uptime and accelerate development cycles, turning time zone differences from a liability into a competitive advantage.

    Key Insight: A successful follow-the-sun model isn't just about handing off tasks; it's about creating a single, cohesive global team that operates on a continuous 24-hour cycle, maximizing productivity and system resilience.

    Practical Implementation and Actionable Tips

    Executing a seamless 24/7 operation requires discipline and robust tooling.

    • Implement a Centralized Project Management System: Use tools like Jira or Asana as a single source of truth. Tasks must be meticulously documented with clear acceptance criteria so they can be handed off without ambiguity. Every task handoff should be treated like a formal API call: well-defined inputs and expected outputs.
    • Create Detailed Handoff Documentation (EOD Reports): Mandate a standardized end-of-day (EOD) report from each team. This document should summarize progress, list specific blockers (with links to relevant tickets/logs), and outline the exact state of the environment or codebase for the incoming team. This minimizes the "discovery" time for the next shift.
    • Schedule Strategic Overlap Hours: Designate a 1-2 hour window where time zones overlap for live communication. This time is sacred and should be used for high-bandwidth activities like sprint planning, complex problem-solving sessions, or architectural reviews, not routine status updates.

    4. Pro: Scalability and Flexibility

    Beyond cost, one of the most compelling pros of offshore outsourcing is the ability to achieve operational elasticity. Companies can rapidly scale engineering and DevOps teams up or down in response to project demands, market shifts, or funding cycles without the logistical friction and long-term financial commitment of hiring permanent, in-house staff. This on-demand access to talent transforms headcount from a fixed operational cost into a variable expenditure directly tied to business needs.

    This model is particularly powerful for dynamic environments. Consider a startup preparing for a major product launch; they can onboard an offshore DevOps team to build out a robust CI/CD pipeline and production infrastructure, then scale the team down to a smaller, long-term maintenance crew post-launch. This agility allows organizations like Uber and Airbnb to enter new markets and scale services aggressively, leveraging distributed teams to meet localized engineering challenges without over-committing to a permanent local workforce for each new initiative.

    Key Insight: Offshore outsourcing decouples your operational capacity from the constraints of local hiring cycles, enabling your engineering organization to scale at the speed of your business strategy, not your recruitment pipeline.

    Practical Implementation and Actionable Tips

    Harnessing this flexibility requires a deliberate, structured approach to avoid operational chaos as teams change size.

    • Maintain a Core Internal Team: Always keep a small, core team of senior engineers and architects in-house. This team owns the core intellectual property, sets the technical direction, and acts as the crucial knowledge bridge for any scaling offshore teams, ensuring continuity and quality control.
    • Document Processes Meticulously: Scalability is impossible without standardization. Your processes for everything from code commits and pull requests to incident response and on-call rotations must be rigorously documented in a central knowledge base (e.g., Confluence, Notion). This ensures new team members can onboard and become productive quickly.
    • Utilize Tiered Engagement Models: Don't use a one-size-fits-all contract. Structure your agreements to allow for different levels of engagement. For instance, have a "core team" on a long-term retainer, a "burst capacity" team available on a project basis, and specialized experts you can engage on an hourly basis for specific problems like a database performance audit.

    5. Con: Quality and Process Management Challenges

    One of the most significant risks in the pros and cons of offshore outsourcing is the difficulty of maintaining consistent quality standards across geographical and cultural divides. The physical distance, asynchronous communication due to time zones, and different interpretations of "done" can lead to a gradual but critical erosion of quality. This often manifests as buggy code, inconsistent UI/UX implementation, or security vulnerabilities that require extensive and costly rework, directly impacting customer satisfaction and engineering team morale.

    For DevOps and engineering teams, this challenge goes beyond simple product defects. It impacts the entire software development lifecycle. Inconsistent coding practices can introduce technical debt, poorly managed infrastructure can lead to production outages, and a lack of adherence to security protocols can create severe compliance risks. What seems like a minor deviation from an established process by an offshore team can cascade into a major incident for the core business.

    Key Insight: Quality in offshore engagements is not a default outcome; it's a direct result of meticulously defined processes, shared tooling, and a relentless focus on measurable standards that are enforced and audited consistently.

    Practical Implementation and Actionable Tips

    To mitigate these quality risks, you must implement a robust framework for process governance and quality assurance from the outset.

    • Implement Comprehensive, Automated Guardrails: Don't rely on manual reviews alone. Enforce quality through technology. Use automated linting tools (e.g., ESLint), static code analysis (SAST) tools (e.g., SonarQube), and mandatory pre-commit hooks in your CI/CD pipelines to ensure every submission meets a minimum quality bar before it can even be merged.
    • Establish Granular Quality KPIs: Go beyond generic SLAs. Define specific, non-negotiable metrics such as code coverage percentage (e.g., >80%), cyclomatic complexity scores, security vulnerability thresholds (e.g., zero critical or high vulnerabilities in a new build), and Mean Time to Recovery (MTTR) for any production incidents caused by a new deployment.
    • Conduct Regular Process and Quality Audits: Schedule bi-weekly or monthly sessions to review the offshore team's adherence to established processes. This includes pull request review quality, documentation standards, and incident response protocols. Treat these audits as opportunities for coaching, not just for criticism.

    Integrating quality assurance directly into your development cycle is non-negotiable for successful outsourcing. You can explore how to build a resilient system by diving into the principles of DevOps Quality Assurance and applying them to your distributed team model.

    6. Con: Communication and Coordination Barriers

    Among the pros and cons of offshore outsourcing, communication friction is one of the most persistent and damaging risks. The combination of language differences, disparate cultural norms, and significant time zone gaps creates a complex barrier to effective collaboration. These issues can manifest as misunderstood project requirements, delayed feedback loops on critical pull requests, and a general lack of the high-context, real-time problem-solving that agile DevOps teams rely on.

    Cartoon showing three confused people becoming clear and understanding after a timed process.

    For engineering teams, this isn't a minor inconvenience; it directly impacts velocity and quality. A subtle nuance missed in a Slack message about infrastructure requirements can lead to days of rework. The inability to quickly hop on a call to debug a production incident can extend downtime and erode user trust. High-profile cases, like Dell's early struggles with offshore customer support, highlight how communication breakdowns can directly harm a company's reputation and bottom line.

    Key Insight: Successful offshore outsourcing treats communication not as a soft skill but as a core piece of engineering infrastructure that requires deliberate design, tooling, and investment to function correctly.

    Practical Implementation and Actionable Tips

    Mitigating these barriers requires a proactive, system-level approach rather than simply hoping for the best.

    • Establish a Communication "Glossary of Terms": Create a shared, living document in your wiki (e.g., Confluence) that defines key technical terms, project-specific acronyms, and operational jargon. This prevents ambiguity and ensures everyone, regardless of native language, understands a "hotfix" versus a "patch" in the same way.
    • Mandate Overlapping Work Hours: Enforce a minimum of 3-4 hours of daily overlapping work time for synchronous communication. Use this window for daily stand-ups, pair programming on complex issues, and architectural design sessions. Protect this time fiercely.
    • Invest in Asynchronous Tooling and Training: Don't just provide tools like Slack or Jira; train teams on how to use them effectively for asynchronous work. This includes writing detailed ticket descriptions with clear acceptance criteria, recording short Loom videos to explain complex bugs, and over-communicating status updates.

    7. Con: Intellectual Property and Security Risks

    One of the most critical drawbacks in the pros and cons of offshore outsourcing is the heightened risk to intellectual property (IP) and data security. Entrusting core business logic, proprietary code, and sensitive customer data to an external team in a different legal jurisdiction introduces significant vulnerabilities. Weaker IP protection laws in some regions, coupled with the logistical challenges of enforcing non-disclosure agreements across borders, can lead to IP theft, data breaches, or compliance failures.

    For engineering teams, this risk is acute. Source code, database schemas, and infrastructure configurations are the crown jewels of a technology company. Exposing them without ironclad protections can result in cloned products or catastrophic data leaks, as seen in breaches involving third-party vendors. The increased data handling surface area makes maintaining compliance with regulations like GDPR and CCPA exponentially more complex.

    Key Insight: Security in an offshore model is not just about technology; it's a legal and procedural challenge. Your contract is your primary line of defense, and your security protocols are your second. Both must be flawless.

    Practical Implementation and Actionable Tips

    To mitigate these serious risks, a proactive, multi-layered security and legal strategy is non-negotiable.

    • Implement a "Least Privilege" Access Model: Your offshore team should only have access to the specific code repositories, databases, and cloud environments necessary for their tasks. Use granular IAM (Identity and Access Management) roles and temporary, just-in-time access credentials (e.g., via HashiCorp Vault or AWS IAM Identity Center) instead of providing broad, long-lived permissions.
    • Enforce Stringent Contractual IP Clauses: Work with legal counsel specializing in international IP law. Your contract must explicitly state that all work product and pre-existing IP remains your exclusive property. Include clauses for immediate termination, data wiping verification, and legal action in case of a breach.
    • Conduct Regular Security Audits and Penetration Testing: Do not rely solely on your vendor's security assurances. Mandate and conduct independent, third-party security audits (e.g., SOC 2 Type II) of their infrastructure and processes. Treat the offshore team as a potential attack vector in your regular penetration testing schedule.

    Securing the development lifecycle is paramount when working with distributed teams. Integrating robust security measures is a core component of modern DevOps. To deepen your understanding, review these essential DevOps security best practices and ensure your offshore engagement model is built on a secure foundation.

    8. Con: Hidden Costs and Total Cost of Ownership Miscalculation

    One of the most critical pitfalls in the pros and cons of offshore outsourcing is the failure to accurately calculate the Total Cost of Ownership (TCO). While the allure of lower salaries is compelling, it often obscures a wide range of indirect and hidden expenses. These unforeseen costs can easily erode, or even negate, the anticipated 40-60% savings, turning a strategic initiative into a financial liability. These costs include management overhead, travel for integration, new communication tools, and the significant cost of rework due to miscommunication or quality gaps.

    For example, a project's budget might account for the offshore team's salaries but fail to include the 15-20% of a domestic senior engineer's time now dedicated to code reviews and architectural oversight for that team. Similarly, companies often underestimate the investment required for initial training, security audits, and setting up compliant infrastructure. Case studies frequently reveal that these hidden costs can add 30-50% on top of the initial labor cost estimate, a miscalculation that can derail project timelines and budgets.

    Key Insight: True cost savings are not measured by comparing salary figures but by a comprehensive TCO analysis that models all direct and indirect expenses, including the impact on domestic team productivity.

    Practical Implementation and Actionable Tips

    To avoid this common pitfall, engineering leaders must adopt a forensic approach to financial planning.

    • Build a Granular TCO Model: Go beyond salaries. Your model must factor in recruitment fees, legal setup, international banking fees, software licenses for the offshore team (e.g., IDEs, VPNs), and increased cybersecurity measures. A realistic model often allocates 20-30% of the base labor cost for these overheads.
    • Quantify the "Productivity Tax": Estimate the cost of the time your internal team will spend managing, training, and reviewing the work of the offshore team. This includes daily stand-ups, ad-hoc support, and more rigorous QA cycles. Model this as a percentage of your onshore team's fully-loaded cost.
    • Budget for a Stabilization Period: Plan for an initial 6-12 month period where productivity may be lower and costs higher than projected. Earmark a contingency fund, typically 10-15% of the first year's total project cost, to cover unexpected expenses during this integration phase.

    9. Con: Loss of Control and Management Complexity

    A significant downside in the pros and cons of offshore outsourcing is the inherent loss of direct operational control. When core engineering or DevOps functions are transferred to an external vendor thousands of miles away, the ability to maintain hands-on oversight, enforce internal standards in real-time, and rapidly pivot on project requirements diminishes significantly. This distance introduces layers of communication and management complexity that can slow down decision-making and obscure performance issues.

    Managing a distributed team across vast time zones and different cultural contexts adds an exponential layer of difficulty. Simple ad-hoc clarifications that would take five minutes in person can turn into a 24-hour cycle of emails and messages. This friction can be particularly damaging for agile DevOps teams that rely on tight feedback loops and rapid iteration to maintain velocity and respond to production incidents. Without a robust management framework, companies risk their offshore partnership becoming a black box, where inputs go in but outputs are unpredictable.

    Key Insight: The primary challenge isn't just distance; it's the dilution of direct influence. Effective outsourcing requires shifting from a model of direct command to one of managing outcomes through contracts, metrics, and structured communication.

    Practical Implementation and Mitigation Strategies

    To counter this loss of control, a proactive and structured governance model is non-negotiable.

    • Establish a Rigid Governance Framework: Clearly define decision-making authority, escalation paths, and communication protocols from the outset. Create a Responsibility Assignment Matrix (RACI) for key processes like code deployments, incident response, and architectural changes to eliminate ambiguity.
    • Implement Granular, Real-Time Monitoring: Use technology to regain visibility. Implement shared dashboards (e.g., Grafana, Datadog) that provide real-time insights into application performance, CI/CD pipeline status, and infrastructure health. This ensures both in-house and offshore teams are operating from a single source of truth.
    • Insist on Measurable SLAs with Penalties: Go beyond high-level agreements. Define specific, measurable metrics with clear penalties for non-compliance. For a DevOps team, this means SLAs for system uptime (e.g., 99.95%), mean time to recovery (MTTR) after an outage, and deployment frequency.
    • Appoint a Dedicated Relationship Manager: Have a single point of contact in-house whose primary responsibility is managing the vendor relationship. This individual acts as a bridge, facilitating communication, tracking performance against SLAs, and resolving conflicts before they escalate.

    10. Con: Cultural Differences and Organizational Misalignment

    A significant risk in the pros and cons of offshore outsourcing is the potential for friction stemming from cultural and organizational misalignment. Divergent work ethics, communication styles, and professional norms can create subtle but persistent friction between onshore and offshore teams. For instance, a direct and confrontational feedback style common in some Western cultures might be perceived as disrespectful in others, leading to demotivation and reduced collaboration. This isn't just a social issue; it directly impacts engineering velocity and product quality.

    These misalignments can manifest as a reluctance to ask clarifying questions, hesitation to report potential problems, or differing views on work-life balance, which affects response times during critical incidents. For a DevOps team where rapid, transparent communication is paramount for incident response and CI/CD pipeline health, these cultural gaps can introduce dangerous delays and misunderstandings, turning a minor issue into a major outage.

    Key Insight: Organizational culture is a technical asset. When an offshore team's cultural norms don't align with your engineering practices (e.g., blameless post-mortems, proactive communication), it creates a hidden "technical debt" that slows down an entire team.

    Practical Implementation and Actionable Tips

    Proactively managing cultural integration is essential to mitigate these risks and turn a potential weakness into a source of diverse strength.

    • Codify Your Engineering Culture: Don't leave culture to chance. Create an explicit document outlining your core engineering values, communication protocols, and behavioral expectations. Define what a "blameless post-mortem" looks like, how to deliver constructive code reviews (e.g., using the "Conventional Comments" standard), and the expected protocol for escalating production issues.
    • Invest in Cross-Cultural Training: Provide targeted training for both onshore and offshore teams that goes beyond generic etiquette. Focus on specific business scenarios: how to navigate disagreements during a sprint planning session, the appropriate way to challenge a senior architect's proposal, and how to communicate project blockers effectively.
    • Establish Cross-Regional Mentorship: Pair an onshore engineer with an offshore counterpart for a formal mentorship program. This creates a safe, one-on-one channel for asking "silly questions" about company norms, getting feedback on communication styles, and building the personal relationships that are the bedrock of high-trust, high-performance teams.

    Offshore Outsourcing: 10-Point Pros & Cons Matrix

    Item Implementation complexity Resource requirements Expected outcomes Ideal use cases Key advantages
    Cost Reduction and Labor Arbitrage Moderate — vendor selection, transition planning Management oversight, training, vendor infra; lower wage bill Significant operational cost savings (40–60%) but possible initial quality variance High-volume, standardized, labor‑intensive processes (BPO, back‑office, engineering) Major cost reduction; access to cheaper specialized talent; scalable workforce
    Access to Global Talent Pool and Specialized Expertise Moderate–High — recruiting, vetting, integration Skilled vendor management, onboarding, collaboration tools Faster skills gap closure and higher technical capability Niche technical projects, R&D, specialized engineering and product development Access to world‑class expertise and diverse perspectives
    24/7 Operations and Round-the-Clock Productivity High — scheduling, handoffs and coordination Overlap hours, monitoring/alerting systems, 24/7 staffing Reduced time‑to‑market; continuous support; faster incident resolution Customer support, global DevOps, incident response, continuous delivery Continuous productivity; always‑on support; accelerated delivery
    Scalability and Flexibility Low–Moderate — contracts and processes for scaling Flexible engagement models, documentation, core in‑house team Rapid scaling up/down with lower fixed overhead Market entry, short‑term projects, variable demand scenarios Quick capacity adjustments; lower hiring burden; low long‑term commitments
    Quality and Process Management Challenges High — implement QA frameworks and audits QA teams, SLAs, automated testing, regular audits Variable quality if unmanaged; higher rework and quality control costs Work requiring strict standards or centralized QA governance Opportunity to standardize processes and adopt global QA best practices
    Communication and Coordination Barriers High — establish protocols, overlap times, training Bilingual PMs, collaboration tools, documentation practices Miscommunication and delays unless mitigated Routine, well‑defined tasks; avoid for highly collaborative innovation unless addressed Builds cross‑cultural skills; forces clearer documentation
    Intellectual Property and Security Risks High — legal, compliance and security controls needed Legal counsel, NDAs, encryption, security audits, restricted access Elevated IP/data breach risk and compliance overhead Non‑core functions or projects with strong contractual safeguards Drives stronger security practices; some jurisdictions improving IP protection
    Hidden Costs and Total Cost of Ownership Miscalculation Moderate — detailed TCO modelling required Finance analysis, contingency budgets, transition resources Projected savings often reduced by hidden costs; longer ROI period Large outsourcing transformations where full costing is feasible Opportunity to identify inefficiencies; long‑term gains after stabilization
    Loss of Control and Management Complexity High — governance, SLAs, continuous oversight Relationship managers, audit processes, reporting tools Reduced direct control; potential misalignment and higher oversight costs Non‑strategic operations or where vendor expertise compensates control loss Frees company to focus on core functions; access to vendor process expertise
    Cultural Differences and Organizational Misalignment High — change management and cultural integration Cultural training, liaisons, team‑building, time investment Possible conflicts, reduced cohesion and turnover without integration Projects tolerant of diverse approaches or with investment in cultural alignment Diverse perspectives, enhanced organizational learning and innovation

    Making the Call: A Strategic Framework for Offshore Outsourcing

    The decision to engage in offshore outsourcing is a pivotal strategic inflection point for any engineering organization. As we've explored, this path is not a simple binary choice between saving money and sacrificing control. Instead, it's a complex equation involving a nuanced trade-off analysis. The journey through the pros and cons of offshore outsourcing reveals that success is not a matter of chance, but of deliberate, calculated strategy. The allure of significant cost reduction, access to a vast global talent pool, and the potential for 24/7 productivity are powerful motivators. Yet, these must be carefully weighed against the very real risks of communication friction, quality degradation, security vulnerabilities, and the insidious creep of hidden costs.

    For a CTO or engineering leader, the central challenge is to harness the immense potential of offshoring while building a robust framework to neutralize its inherent risks. The decision transcends mere financial arithmetic; it requires a deep, technical understanding of your own organization's capabilities and the specific nature of the work to be outsourced. A one-size-fits-all approach is a recipe for failure.

    Recapping the Core Trade-Offs

    Let's distill our findings into the central tensions you must navigate:

    • Cost vs. Total Cost of Ownership (TCO): The initial labor arbitrage is often compelling, but the true TCO must account for management overhead, ramp-up time, potential rework, and the costs of establishing secure communication channels. Failing to model these secondary expenses is the most common reason offshore initiatives underdeliver on their financial promises.
    • Talent Access vs. Knowledge Transfer: While offshoring opens doors to specialized global expertise, it simultaneously introduces the challenge of effective knowledge transfer and institutional memory retention. Core architectural knowledge and proprietary business logic are often poor candidates for outsourcing precisely because of this risk.
    • Speed vs. Control: Achieving round-the-clock development cycles is a significant advantage, but it can come at the cost of direct oversight and real-time course correction. Your internal processes, from code reviews to deployment approvals, must be mature enough to function asynchronously across different time zones.

    Ultimately, successful offshore outsourcing is less about finding the cheapest vendor and more about finding the right partner and the right engagement model. It requires a foundational investment in process maturity, clear documentation, and a management layer capable of governing distributed teams effectively.

    An Actionable Decision Framework for CTOs

    To move from theory to practice, apply this structured framework to your next outsourcing consideration:

    1. Classify Your Engineering Workload: Segment your projects and tasks. Are you looking to offload a well-defined, non-core function like CI/CD pipeline maintenance or legacy system support? Or are you trying to outsource a core, innovative product feature requiring tight feedback loops and deep domain context? The former is a strong candidate; the latter is a high-risk endeavor.
    2. Conduct a Management Overhead Audit: Honestly assess your team's current capacity. Do you have detailed runbooks, well-documented APIs, and an established asynchronous communication culture (e.g., using tools like Slack, Jira, and Confluence effectively)? If your internal processes are chaotic, offshoring will only amplify that chaos.
    3. Initiate a Controlled Pilot Program: Never commit to a large-scale engagement without a trial run. Select a small, low-risk, and well-scoped project. Use this pilot to rigorously test the vendor's technical competence, communication protocols, and adherence to security policies. This provides invaluable data to refine your TCO calculations and validate the partnership before you scale.

    The mastery of these pros and cons of offshore outsourcing transforms it from a risky gamble into a powerful strategic lever. By approaching it with a clear-eyed, data-driven framework, you can unlock global talent and operational efficiencies that give your organization a decisive competitive edge, turning a potential pitfall into a powerful engine for growth.


    Ready to leverage global DevOps talent without the traditional risks? OpsMoon provides a vetted platform connecting you with the top 0.7% of freelance SRE, Platform, and DevOps engineers, complete with architect-level oversight to ensure project success. Start your risk-free work planning session today and see how our managed approach can de-risk and accelerate your offshore initiatives at OpsMoon.

  • A Practical Guide to SOC 2 Requirements for Engineers

    A Practical Guide to SOC 2 Requirements for Engineers

    When people hear "SOC 2 requirements," they often picture a massive, rigid checklist. But SOC 2 is a flexible framework, not a prescriptive rulebook. It’s built to prove your systems are secure and reliable, based on five core principles known as the Trust Services Criteria.

    For anyone just starting out, getting a handle on the basics is key. If you're looking for a good primer, this piece on What Is SOC 2 Compliance is a great place to begin.

    The framework, developed by the American Institute of Certified Public Accountants (AICPA), provides customers with verifiable proof that you handle their data responsibly. Instead of forcing a one-size-fits-all model, it allows you to tailor the audit to your specific services and technical architecture.

    What Are the Core SOC 2 Requirements

    The heart of any SOC 2 audit is the Trust Services Criteria (TSCs). These are the principles your internal controls—both procedural and technical—will be measured against.

    The only mandatory requirement is the Security criterion. This is the non-negotiable foundation of every SOC 2 audit. From there, you select additional criteria—Availability, Processing Integrity, Confidentiality, and Privacy—that align with your service commitments and customer contracts.

    The Five Trust Services Criteria

    The framework is built around one mandatory criterion and four optional ones you can choose from. This structure is what makes SOC 2 so adaptable to different technologies and business models.

    Here’s a technical breakdown of each one to give you a clearer picture.

    The Five SOC 2 Trust Services Criteria at a Glance

    Trust Services Criterion Core Objective Commonly Required For
    Security (Mandatory) Protect systems and data from unauthorized access, disclosure, and damage. Every SOC 2 audit, no exceptions. This is the foundation.
    Availability (Optional) Ensure systems are available for use as agreed upon in contracts or SLAs. Services with strict uptime guarantees, like IaaS, PaaS, or critical business apps.
    Processing Integrity (Optional) Ensure system processing is complete, accurate, timely, and authorized. Financial platforms, e-commerce sites, or any app performing critical transactions.
    Confidentiality (Optional) Protect sensitive information (e.g., intellectual property, trade secrets) from unauthorized disclosure. Companies handling proprietary business data, strategic plans, or other restricted info.
    Privacy (Optional) Protect Personally Identifiable Information (PII) through its entire lifecycle. B2C companies, healthcare platforms, or any service collecting personal data from individuals.

    Your choice of TSCs has a huge impact on the scope and technical depth of your audit. This decision should be a direct reflection of your customer contracts, your system architecture, and the specific data flows you're responsible for.

    I’ve seen teams make the mistake of trying to tackle all five TSCs to look "more compliant." A strong SOC 2 report isn't about quantity; it's about relevance. Including Processing Integrity for a simple data storage service just adds unnecessary complexity and cost to the audit without providing any real value. An auditor will ask you to prove controls for every TSC you select; over-scoping creates unnecessary engineering work.

    Choosing your TSCs wisely ensures the entire audit process stays focused, relevant, and gives a true picture of your security posture. It’s about proving you do what you say you do, where it counts the most for your customers.

    Translating the Five Trust Services Criteria into Code

    Knowing the theory behind the five Trust Services Criteria (TSCs) is one thing, but actually implementing them is a whole different ball game. This is where the rubber meets the road—where abstract compliance goals have to become real, auditable technical controls baked right into your systems and code.

    It's all about mapping those high-level principles to concrete configurations, scripts, and architectural choices. So, let's break down how each of the five TSCs translates into tangible engineering tasks that an auditor can actually test and verify.

    This visual shows how the five criteria fit together, with Security serving as the non-negotiable foundation for any SOC 2 report.

    Diagram illustrating SOC 2 Trust Services Criteria: Security, Availability, Privacy, Confidentiality, and Integrity.

    While every audit is built on Security, you'll choose the other criteria based on the specific services you offer and the kind of data you handle.

    Security: The Mandatory Foundation

    Security isn't optional; it's the bedrock of every single SOC 2 report. The entire point is to prove you're protecting your systems against unauthorized access, plain and simple.

    From an engineering standpoint, this means building a defense-in-depth strategy.

    • Network Segmentation: Implement a multi-VPC architecture. Use Virtual Private Clouds (VPCs) and fine-grained subnets to isolate your production environment from development and staging. Enforce strict ingress/egress rules using network ACLs and security groups, allowing traffic only on necessary ports (e.g., TCP/443) from trusted sources.
    • Intrusion Detection Systems (IDS): Deploy network-based IDS tools like AWS GuardDuty or an open-source option like Suricata to monitor VPC Flow Logs and DNS queries for anomalous activity. Configure automated alerts that pipe findings directly into a dedicated incident response channel in Slack or create a PagerDuty incident for critical threats.
    • Vulnerability Management: Integrate static and dynamic security testing (SAST/DAST) tools directly into your CI/CD pipeline. Use tools like Snyk or Trivy to scan container images for known CVEs and third-party libraries for vulnerabilities as part of every build. Configure the pipeline to fail if high-severity vulnerabilities are detected.

    Availability: Guaranteeing Uptime

    If you promise customers a certain level of performance—usually defined in a Service Level Agreement (SLA)—then the Availability criterion is for you. The goal here is to prove your system is resilient and can handle failures without falling over.

    Your technical controls need to reflect that promise:

    • Automated Failover Architecture: Design your infrastructure to span multiple availability zones (AZs). Use managed services like AWS Application Load Balancers (ALBs) and auto-scaling groups to automatically reroute traffic and launch new instances if an instance or an entire AZ becomes unhealthy. For data tiers, use managed multi-AZ database services like Amazon RDS.
    • Disaster Recovery (DR) Testing: Don't just write a DR plan; automate it. Use Infrastructure as Code to define a recovery environment and write scripts that simulate a full regional failover. Regularly test these scripts to measure your Recovery Time Objective (RTO) and Recovery Point Objective (RPO), ensuring you can restore from backups and meet your SLA commitments.
    • Uptime Monitoring: Implement comprehensive monitoring using tools like Prometheus for metrics and alerting and Datadog for log aggregation and APM. Set up alerts on key service-level indicators (SLIs) like latency, error rates, and saturation. Ensure alerts are triggered before an SLA breach, allowing you to meet a 99.99% uptime guarantee.

    Processing Integrity: Accurate and Reliable Transactions

    Processing Integrity is all about ensuring that system processing is complete, accurate, and authorized. If you're building a financial platform, an e-commerce site, or anything where transaction correctness is absolutely critical, this one's for you.

    Here’s how you build that trust into your code:

    • Data Validation Checks: Implement strict server-side data validation using schemas (e.g., JSON Schema) in your APIs and ingestion pipelines. Ensure that any data failing validation is rejected with a clear error code (e.g., HTTP 400) and logged for analysis, preventing malformed data from corrupting your system.
    • Robust Error Logging: When a transaction fails, you need to know why—immediately. Implement structured logging (e.g., JSON format) that captures the full context of the error, including a unique transaction ID, user ID, and stack trace. Centralize these logs and create automated alerts for spikes in specific error types.
    • Transaction Reconciliation: Implement idempotent APIs to prevent duplicate processing. Set up automated reconciliation jobs that perform checksums or row counts between source and destination databases (e.g., between an operational PostgreSQL DB and a data warehouse) to programmatically identify discrepancies.

    Confidentiality: Protecting Sensitive Data

    Confidentiality is focused on protecting data that has been designated as, well, confidential. This isn't just customer data; we're talking about your intellectual property, internal financial reports, or secret business plans.

    The controls here are all about preventing unauthorized disclosure:

    • Encryption Everywhere: Mandate TLS 1.3 for all data in transit by configuring your load balancers and servers to reject older protocols. For data at rest, use platform-managed keys (like AWS KMS) to enforce server-side encryption (SSE-KMS) on all S3 buckets, EBS volumes, and RDS instances.
    • Access Control Lists (ACLs): Implement granular, role-based access control (RBAC). Use IAM policies and S3 bucket policies to enforce the principle of least privilege. For example, a service account for a data processing job should only have s3:GetObject permission for a specific bucket, not s3:*.
    • Infrastructure as Code (IaC): Use tools like Terraform or CloudFormation to define and manage your infrastructure. This gives you a clear, version-controlled audit trail of who configured what and when, making it dead simple to prove your security settings are correct. To see what this looks like in practice, check out our guide on how to properly inspect Infrastructure as Code.

    Privacy: Safeguarding Personal Information

    While Confidentiality is about protecting company secrets, Privacy is laser-focused on protecting Personally Identifiable Information (PII). This criterion is your ticket to aligning with major regulations like GDPR and CCPA.

    The technical implementations get very specific:

    • PII Data Mapping: Use automated data discovery and classification tools to scan your databases and object stores to identify and tag columns or files containing PII. Maintain a data inventory that maps each PII element to its physical location, owner, and retention policy.
    • Consent Mechanisms: Engineer granular, user-facing consent management features directly into your application's API and UI. Store user consent preferences (e.g., for marketing communications vs. analytics) as distinct boolean flags in your user database with a timestamp.
    • Automated DSAR Workflows: Create automated workflows to handle Data Subject Access Requests (DSARs). Build scripts that query all PII-containing data stores for a given user ID and can programmatically export or delete that user's data, generating an audit log of the action.

    Choosing Between a SOC 2 Type I and Type II Report

    Figuring out whether to go for a SOC 2 Type I or Type II report is more than just a compliance checkbox. It’s a strategic call that ripples across your engineering team, customer trust, and even how fast you can close deals.

    The difference between them is pretty fundamental, but a simple analogy makes it crystal clear.

    A Type I report is a photograph. It's a snapshot, capturing your security controls at one specific moment. An auditor comes in, looks at the design of your controls—your documented policies, your IaC configurations, your access rules—and confirms that, on paper, they look solid enough to meet the SOC 2 criteria you’ve chosen.

    On the other hand, a Type II report is a video. Instead of a single snapshot, it records your controls in action over a longer stretch, usually three to twelve months. This report doesn’t just say your controls are designed well; it proves they’ve been working effectively, day in and day out.

    The Startup Playbook: Type I as a Baseline

    For an early-stage company, a Type I report is often the most pragmatic first move. It’s faster, costs less, and is a great way to unblock those early sales conversations with enterprise customers who need some kind of security validation to move forward.

    Think of it as a readiness assessment that comes with an official stamp of approval. The process forces your engineering team to get its house in order by documenting processes, hardening systems, and putting the foundational controls in place for a real security program. It gives you a solid baseline and shows prospects you’re serious, all without the long, drawn-out observation period a Type II demands.

    Why Enterprises Demand Type II

    As you grow, so do your customers' expectations. A Type I shows you have a good plan, but a Type II proves your plan actually works. Big companies, especially those in financial services, healthcare, or other regulated fields, almost always require a Type II. They need rock-solid assurance that your security controls aren’t just theoretical—they've been consistently enforced over time.

    A Type I report might get you past the initial security questionnaire, but a Type II report is what closes the deal. It provides irrefutable, third-party evidence of your security posture, making it the gold standard for vendor due diligence.

    The engineering lift for a Type II is much heavier, no doubt about it. It means months of meticulous evidence collection—pulling logs from CI/CD pipelines, digging up Jira tickets for change management, and grabbing cloud configuration snapshots to show everything is operating as it should. The audit is more intense and the cost is higher, but the trust it builds is priceless.

    A Clear Decision Framework

    So, which one is right for you? It really boils down to your company's stage, your resources, and what your customer contracts demand.

    A Type I is your best bet for a quick win to establish a security baseline and get sales moving. A Type II is the long-term investment you make to land and keep those big enterprise fish.

    Automating Evidence Collection for Your Audit

    A successful SOC 2 audit boils down to one thing: rock-solid evidence. You can't just scramble at the last minute to prove your controls were working six months ago. That approach is a recipe for failure.

    The real key is to get ahead of the audit. You need to shift from reactive data hunting to proactive, automated evidence collection. It’s about baking compliance right into your daily engineering workflows, not treating it as a once-a-year fire drill.

    This journey starts by defining a crystal-clear audit scope. Think of it as drawing a boundary around everything the auditors will examine—every system, piece of infrastructure, and code repo that falls under your chosen Trust Services Criteria. Get this right, and you eliminate surprises down the road.

    Flowchart illustrating the collection and linkage of audit evidence from Terraform, CI/CD logs, IAM policies, and change tickets.

    This proactive stance isn't just a nice-to-have; it's becoming a necessity. A staggering 68% of SOC 2 audits fail because of insufficient monitoring evidence. This trend has pushed the AICPA to mandate monthly control testing for SOC 2 Type II reports, a huge leap from the old annual check-ins.

    Defining Your Audit Scope

    Before you can collect a single piece of evidence, you need to know exactly what the auditors are going to look at. This isn't just a quick list of servers; it's a complete inventory of your entire service delivery environment.

    • System and Infrastructure Mapping: Use a Configuration Management Database (CMDB) or even a version-controlled YAML file to document all your production servers, databases, cloud services (like AWS S3 buckets or RDS instances), and networking components. Link each asset to the TSCs it supports (e.g., your load balancers are key evidence for Availability).
    • Code Repository Identification: Pinpoint the specific Git repositories that house your application code, Infrastructure as Code (IaC), and deployment scripts for any in-scope systems. Use a CODEOWNERS file to formally define ownership and review requirements for critical repositories.
    • Data Flow Diagrams: Create and maintain diagrams (using a tool like Lucidchart or Diagrams.net) that map how sensitive data moves through your systems, including entry points, processing steps, and storage locations. This is critical for proving controls for the Confidentiality and Privacy criteria.

    Identifying Key Evidence Sources

    With your scope locked in, the next step is to figure out where your evidence actually lives. For modern engineering teams, this data is generated constantly by the tools you’re already using every single day. The trick is knowing what to grab.

    Auditors aren't looking for vague promises; they want concrete proof that your controls are working as designed. This means tangible artifacts, like:

    • Infrastructure as Code (IaC) Configurations: Your Terraform or CloudFormation files are pure gold. They provide a version-controlled, declarative record of how your cloud environment is configured, proving your security settings are intentional and consistently applied.
    • CI/CD Pipeline Logs: Logs from tools like Jenkins, GitLab CI, or GitHub Actions are a treasure trove. They show that code changes went through automated testing, security scans, and required approvals before ever touching production.
    • Cloud IAM Policies: Exported JSON policies from AWS IAM or similar services in GCP and Azure are direct evidence of your access control rules. They're undeniable proof of how you enforce the principle of least privilege.
    • Change Management Tickets: Tickets in Jira or Linear that are linked to pull requests tell the human story behind a change. They show the business justification, peer review, and final approval, satisfying crucial change management requirements.

    Mapping DevOps Practices to SOC 2 Controls

    The good news is that your existing DevOps practices are likely already generating the evidence you need. It's just a matter of connecting the dots. By mapping your CI/CD pipelines, IaC workflows, and monitoring setups to specific SOC 2 controls, you can turn your everyday operations into a compliance machine.

    This table shows how some common DevOps activities directly support SOC 2 requirements.

    SOC 2 Common Criteria DevOps Practice Example Evidence to Collect
    CC6.1 (Logical Access) Role-Based Access Control (RBAC) via AWS IAM, managed with Terraform. Terraform code defining IAM roles and policies; screenshots of IAM console.
    CC7.1 (System Configuration) Infrastructure as Code (IaC) to define and enforce security group rules. *.tf files showing security group configurations; terraform plan outputs.
    CC7.2 (Change Management) CI/CD Pipeline with required PR approvals and automated security scans. Pull request history with reviewer approvals; CI pipeline logs (e.g., GitHub Actions).
    CC7.4 (System Monitoring) Observability Platform (e.g., Datadog, Grafana) with alerting on critical events. Alert configurations; logs showing alert triggers and responses.
    CC8.1 (System Development) Automated Testing in the CI pipeline (unit, integration, vulnerability scans). Test reports from the CI pipeline (e.g., SonarQube, Snyk); build logs.

    By viewing your DevOps toolchain through a compliance lens, you'll find that you’re already well on your way. The challenge isn't creating new processes from scratch, but rather learning how to capture and present the evidence from the robust processes you already have.

    Implementing Automation for Continuous Collection

    Trying to gather all this evidence manually is a surefire path to audit fatigue and human error. The goal is to automate this process so that evidence is continuously collected, organized, and ready for auditors the moment they ask for it.

    Automation transforms SOC 2 evidence collection from a painful, periodic event into a seamless, background process. It's the difference between frantically digging through archives and simply pointing an auditor to a pre-populated, organized repository of proof.

    You can get this done using scripts or specialized compliance platforms that tap into the APIs of your existing tools. Set up scheduled jobs (e.g., cron jobs or Lambda functions) to automatically pull pipeline logs, fetch IAM role configurations from the AWS API, and archive Jira tickets via webhooks. Store all this evidence in a secure, centralized S3 bucket with versioning and locked-down access controls.

    By doing this, you're building an irrefutable audit trail that runs 24/7. It makes the audit itself a simple verification exercise rather than a massive investigative project. Our guide to what is continuous monitoring dives deeper into how to build these kinds of automated systems.

    Embedding SOC 2 Controls in Your DevOps Workflow

    Getting SOC 2 compliant shouldn't feel like a separate, soul-crushing task tacked on at the end. The most effective—and frankly, the most sane—way to meet SOC 2 requirements is to stop treating them like an external checklist. Instead, bake the controls directly into the DevOps lifecycle your team already lives and breathes every day.

    When you do this, compliance becomes a natural outcome of great engineering, not a disruptive event you have to brace for. It's a mindset shift: security and compliance checks become just another part of the software delivery process, from the first line of code to the final deployment. This way, you build a system where compliance is automated, continuous, and woven right into your engineering culture.

    Diagram illustrating a secure software development pipeline from code and testing to Kubernetes deployment.

    Automating Security in the CI/CD Pipeline

    Your CI/CD pipeline is the central nervous system of your entire development process. That makes it the perfect place to automate security controls that would otherwise be a massive manual headache. Instead of just relying on human code reviews, you can integrate automated tools to act as vigilant gatekeepers.

    • Static Application Security Testing (SAST): Tools like SonarQube or Snyk Code can be plugged right into your pipeline. They scan your source code for vulnerabilities before it ever gets merged, catching things like SQL injection or insecure configurations at the earliest possible moment. A build should automatically fail if high-severity issues pop up.
    • Dynamic Application Security Testing (DAST): After your application is built and humming along in a staging environment, DAST tools like OWASP ZAP can actively poke and prod it for weaknesses. This simulates a real-world attack, uncovering runtime flaws that static analysis might miss.

    This "shift-left" approach turns security into a shared responsibility, not just a problem for the security team to clean up later. It gives developers instant feedback, helping them learn and write more secure code from the get-go.

    Infrastructure as Code as an Audit Trail

    Infrastructure as Code (IaC) is one of your biggest allies for SOC 2 compliance. When you use tools like Terraform or CloudFormation to define your entire cloud environment in version-controlled files, you create an undeniable, time-stamped audit trail for your infrastructure.

    Every single change—from tweaking a firewall rule to updating an IAM policy—is captured in a commit. This directly satisfies critical change management requirements. An auditor can simply look at your Git history to see who made a change, what the change was, and who approved it through a pull request. What was once a painful audit request becomes a simple matter of record.

    IaC transforms your infrastructure from a manually configured, hard-to-track mess into a declarative, auditable, and repeatable asset. It’s not just a DevOps best practice; it's a compliance superpower.

    Leveraging Observability for Security Monitoring

    Modern observability platforms are no longer just for tracking application performance; they're essential for meeting SOC 2’s monitoring and incident response requirements. Tools like Datadog, Prometheus, or Grafana Loki give you the visibility needed to spot and react to security events.

    To make these tools truly SOC 2-ready, you need to configure them to:

    1. Collect Security-Relevant Logs: Make sure you're pulling in logs from your cloud provider (like AWS CloudTrail), your applications, and the underlying operating systems.
    2. Create Security-Specific Alerts: Set up alerts for suspicious activity. Think multiple failed login attempts, unauthorized API calls, or changes to critical security groups.
    3. Establish Incident Response Dashboards: Build a single pane of glass for security incidents. This helps your team quickly assess what's happening and respond effectively.

    This proactive monitoring proves to auditors that you have real-time controls in place to detect and handle potential security issues. This is absolutely critical, especially since misconfigured controls are a massive source of security failures. In fact, a Gartner analysis found that a staggering 93% of cloud breaches come from these kinds of misconfigurations, showing just how vital robust, automated monitoring really is. You can learn more by reviewing best practices for continuous monitoring.

    Implementing Least Privilege with RBAC

    The principle of least privilege is a cornerstone of the SOC 2 Security criterion. The idea is simple: grant users only the access they absolutely need to do their jobs, and nothing more. In modern cloud and Kubernetes environments, Role-Based Access Control (RBAC) is how you make this happen.

    For example, in Kubernetes, you can create specific Roles and ClusterRoles that grant permissions only to the necessary resources. A developer might be allowed to view pods in a development namespace but be completely blocked from touching production secrets.

    By managing these RBAC policies as code and checking them into Git, you create yet another auditable record. It proves your access controls are intentional, reviewed, and consistently enforced.

    Your Technical SOC 2 Readiness Checklist

    Getting started with a SOC 2 audit can feel like a huge undertaking, especially for an engineering team. The key is to think of it less like chasing a certificate and more like systematically building and proving a culture of security. With a clear roadmap, the whole process transforms from a daunting obstacle into a manageable project with a real finish line.

    And this isn't just an internal exercise anymore. The demand for this level of security assurance is fast becoming table stakes. Globally, 65% of organizations say their buyers and partners are flat-out asking for SOC 2 attestation as proof of solid security. You can find more stats on this trend over at marksparksolutions.com. This shift makes a structured readiness plan a must-have to stay competitive.

    Phase 1: Scoping and Planning

    This first phase is all about laying the groundwork. Getting this right from the jump saves a ton of headaches, scope creep, and wasted effort down the road.

    • Define Audit Boundaries: First things first, you need to draw a line around what's "in-scope." This means identifying every single system, app, database, and piece of infrastructure that touches customer data.
    • Select Trust Services Criteria (TSCs): Figure out which TSCs actually matter to your business and your customer commitments. The Security criterion is mandatory, but don't just pile on others like Processing Integrity if it doesn't apply to what you do.
    • Perform a Gap Analysis: Now, take a hard look at your current controls and measure them against the TSCs you've chosen. This initial pass will quickly shine a light on any missing policies, insecure setups, or gaps in your process that need attention.

    A big piece of this phase also involves proactive technical debt management. If you let that stuff fester, it can seriously undermine the security and reliability you're trying to prove.

    Phase 2: Control Implementation and Remediation

    Once you know where the gaps are, it's time to close them. This is where your engineering team rolls up their sleeves and turns policy into actual, tangible technical fixes.

    This is where the real work happens. It’s not about writing documents; it’s about shipping secure code, hardening infrastructure, and creating the automated guardrails that make compliance a default state, not a manual effort.

    • Remediate Security Gaps: Start knocking out the issues you found in the gap analysis. This could mean finally rolling out multi-factor authentication (MFA) everywhere, patching those vulnerable libraries you've been putting off, or hardening your container images.
    • Document Everything: Create clear, straightforward documentation for every control. Think architectural diagrams, process write-ups, and incident response runbooks. Make it easy for an auditor (and your future self) to understand what you've built.
    • Conduct Internal Testing: Before the real auditors show up, be your own toughest critic. Run your own vulnerability scans and review access logs to make sure the controls are actually working as you expect. Our own production readiness checklist is a great place to start for this kind of internal validation.

    Phase 3: Continuous Monitoring and Audit Preparation

    With your controls in place, the focus shifts from one-off fixes to ongoing maintenance and evidence gathering. Now you have to prove that your controls have been working effectively over a period of time.

    • Automate Evidence Collection: Don't do this manually. Set up automated jobs to constantly pull logs, configuration snapshots, and other pieces of evidence. Shove it all into a secure, organized place where you can find it easily.
    • Schedule Regular Reviews: Put recurring reviews on the calendar for things like access rights, firewall rules, and security policies. This ensures they stay effective and don't get stale.
    • Engage Your Auditor: Start a conversation with your chosen audit firm early. You can provide them with your system descriptions and some initial evidence to get their feedback. It’s a great way to streamline the formal audit and avoid any last-minute surprises.

    Got Questions About SOC 2 Requirements? We've Got Answers.

    When you're trying to square SOC 2 compliance goals with the technical reality of building and running software, a lot of questions pop up. It’s totally normal. Here are some of the most common ones we hear from engineering and leadership teams.

    How Long Does a SOC 2 Audit Actually Take?

    This is the big one, and the honest answer is: it depends. The timeline for a SOC 2 audit can vary wildly based on where you're at and which type of report you're going for.

    A Type I audit is just a snapshot in time. Once you’re prepped and ready, the assessment itself can often be wrapped up in a few weeks. It's the quicker option, for sure.

    But a Type II audit is a different beast altogether. This one needs an observation period, usually lasting anywhere from three to twelve months, to prove your controls are actually working day-in and day-out. After that period closes, tack on another four to eight weeks for the auditor to do their thing—testing, documenting, and finally generating the report. Your team's readiness and the complexity of your stack are the biggest swing factors here.

    So, is SOC 2 a Certification?

    Nope. And this is a really important distinction to understand. SOC 2 is an attestation report, not a certification.

    A certification usually means you’ve ticked the boxes on a rigid, one-size-fits-all checklist. An attestation, however, is a formal opinion from an independent CPA firm. They're verifying that your specific controls meet the Trust Services Criteria you've chosen. It's a much more nuanced evaluation of your unique security posture.

    Think of it like this: a certification is like passing a multiple-choice exam. A SOC 2 attestation is more like defending a thesis—it’s a deep, comprehensive evaluation of your specific environment, not just a pass/fail grade against a generic list.

    Is a SOC 2 Report Enough Anymore?

    While SOC 2 is still the gold standard for many, it's increasingly seen as the foundation, not the finish line. The compliance landscape is getting more crowded, and as threats get more sophisticated, just having a SOC 2 report might not be enough to satisfy every customer.

    Organizations are now layering multiple frameworks to build deeper trust. In fact, some recent data shows that 92% of organizations now juggle at least two different compliance audits or assessments each year, with a whopping 58% tackling four or more. You can dig into the full story in A-LIGN’s latest benchmark report on compliance standards in 2025. The takeaway is clear: we're moving toward a multi-framework world.


    Getting SOC 2 right requires a ton of DevOps and cloud security know-how. OpsMoon brings the engineering talent and strategic guidance to weave compliance right into your daily workflows, turning what feels like a roadblock into a real competitive edge. Let's map out your compliance journey with a free work planning session.

  • Best Guide: microservices vs monolithic architecture for developers

    Best Guide: microservices vs monolithic architecture for developers

    At its core, the microservices vs. monolithic architecture debate is a fundamental engineering trade-off: a monolithic architecture collocates all application components into a single, deployable unit with in-process communication, while a microservices architecture decomposes the application into a collection of independently deployable, network-connected services. It's a choice between the initial development velocity of a monolith and the long-term scalability and organizational agility of microservices.

    Choosing Your Architectural Foundation

    Selecting between a monolithic and a microservices architecture is one of the most consequential decisions in the software development lifecycle. It's not a superficial choice; it dictates your application's deployment topology, team structure, CI/CD pipeline complexity, and long-term scalability profile. This isn't about choosing one large executable versus many small ones—it's about committing to a specific operational model and development culture.

    To make an informed decision, you must have a firm grasp of software architecture fundamentals.

    A seesaw balancing a single large 'Monolith' cube against many small 'Microservices' cubes, illustrating their difference.

    A monolithic application is a single, self-contained unit where the user interface, business logic, and data access layer are tightly coupled within a single codebase and deployed as one artifact (e.g., a WAR, JAR, or executable). For greenfield projects, particularly for startups launching a Minimum Viable Product (MVP), the simplicity of a single codebase, a unified build process, and a straightforward deployment strategy offers a significant time-to-market advantage.

    Conversely, a microservices architecture structures an application as a suite of loosely coupled, fine-grained services. Each service is organized around a specific business capability, encapsulates its own data persistence, and can be developed, deployed, and scaled independently. This model is foundational to modern cloud-native application development, delivering the resilience, technological heterogeneity, and granular scalability required for complex systems.

    The core trade-off is this: monoliths offer low initial complexity and high development velocity, while microservices provide long-term operational flexibility, fault isolation, and independent scalability at the cost of increased infrastructural and cognitive overhead. Understanding this distinction is the first step toward selecting the optimal architecture for your technical and business context.

    Quick Comparison Monolithic vs Microservices Architecture

    To establish a baseline for a more technical analysis, this table outlines the key architectural differences and their practical implications.

    Criterion Monolithic Architecture Microservices Architecture
    Codebase Structure Single, unified codebase (monorepo). Components are modules or packages. Multiple, independent codebases, typically one per service.
    Deployment Unit The entire application is deployed as a single artifact. Each service is an independently deployable artifact.
    Scalability Scaled vertically (more resources per node) or horizontally by replicating the entire monolith. Services are scaled independently based on specific resource demands (e.g., CPU, memory).
    Technology Stack Homogeneous; a single technology stack (e.g., Spring Boot, Ruby on Rails) is used across the application. Heterogeneous; services can be implemented in different languages and frameworks (polyglot persistence).
    Team Structure Often managed by a single, large development team, leading to coordination overhead (Conway's Law). Suited for smaller, autonomous teams aligned with specific business domains.
    Initial Complexity Low; simpler to set up local environments, IDEs, and initial CI/CD pipelines. High; requires service discovery, API gateways, and complex inter-service communication protocols.
    Fault Isolation Low; an uncaught exception or resource leak in one module can degrade or crash the entire application. High; failure in one service is isolated and can be handled with patterns like circuit breakers.

    While this table provides a high-level overview, the real impact is in the implementation details. Each of these points has profound consequences for your operational budget, developer productivity, and ability to innovate.

    Anatomy Of The Monolithic Architecture

    A monolithic architecture is implemented as a single, large-scale application where all functional components are tightly coupled within a single process. Think of it as a self-contained system where every part—from the front-end UI rendering to the back-end business logic and the data persistence layer—is compiled, packaged, and deployed as a single unit. This unified model is the traditional and often default choice for new applications due to its straightforward development and deployment model.

    A hand-sketched diagram illustrating a layered software architecture: Presentation, Business Logic, Data Access, interacting with a codebase.

    This structure provides tangible operational benefits, particularly for smaller engineering teams. With a single codebase, onboarding new developers is streamlined, and debugging is often less complex. Tracing a request from the UI to the database involves following a single call stack within a single process, eliminating the need for complex distributed tracing tools required by microservices.

    The Three-Tier Internal Structure

    Most monolithic applications adhere to a classic three-tier architectural pattern to enforce logical separation of concerns. While these layers are logically distinct, they remain physically collocated within the same deployment artifact.

    • Presentation Layer: This is the top-most layer, responsible for handling HTTP requests and rendering the user interface. In a web application, this layer contains UI components (e.g., Servlets, JSPs, or controllers in an MVC framework) that generate the HTML, CSS, and JavaScript sent to the client's browser.
    • Business Logic Layer: This is the core of the application where domain logic is executed. It processes user inputs, orchestrates data access, enforces business rules, and implements the application's primary functions. For an e-commerce monolith, this layer would contain the logic for inventory management, order processing, and payment validation.
    • Data Access Layer (DAL): This layer acts as an abstraction between the business logic and the physical database. It encapsulates the logic for all Create, Read, Update, and Delete (CRUD) operations, often using an Object-Relational Mapping (ORM) framework like Hibernate or Entity Framework.

    This layered structure provides a clear separation of concerns initially, but as the application grows, the boundaries between these layers often erode, leading to a "big ball of mud"—a system with high coupling and low cohesion.

    Operational Benefits And Scaling Challenges

    The initial advantages of a monolith are clear, but the trade-offs become severe as the application scales. While the infrastructure is simple to manage at first (a single application server and a database), growing code complexity can dramatically slow down development cycles. A small change in one module can have unintended consequences across the system, necessitating extensive regression testing and increasing the risk of deployment failures.

    Key Takeaway: The primary challenge with a monolith is not its initial simplicity but its escalating complexity over time. As the codebase grows, technological lock-in becomes a significant risk, and refactoring or adopting new technologies without disrupting the entire application becomes nearly impossible.

    This scaling friction is where the microservices vs monolithic architecture debate intensifies. Empirical data reveals a pragmatic industry trend: many organizations begin with a monolith and only migrate when scale or team size dictates. Monoliths accelerate initial deployment, but their efficiency diminishes as development teams exceed 10 to 15 engineers. While microservices are superior for scaling teams, they increase operational complexity by 3 to 5 times and require 5 to 10 times more sophisticated infrastructure. You can read more about the pragmatic trade-offs between monoliths and microservices.

    Ultimately, the anatomy of a monolith is one of unified strength that can evolve into a single point of failure and a significant bottleneck to innovation. Understanding these structural limitations is key to recognizing when to evolve beyond this architecture.

    Deconstructing The Microservices Architecture

    In stark contrast to a monolith's integrated design, a microservices architecture decomposes an application into a collection of independently deployable services. Each service is designed around a specific business capability, maintains its own codebase and data store, and can be developed, tested, deployed, and scaled autonomously.

    This architecture is fundamentally decentralized and promotes loose coupling, providing engineering teams with significant flexibility and autonomy.

    A hand-drawn microservices architecture diagram showing various interconnected components and data flows.

    This represents a paradigm shift from the monolithic model. Instead of a single application handling all functionality, you have discrete services for user authentication, payment processing, inventory management, and shipping. These services communicate with each other over the network, typically via APIs, forming a distributed system that is both powerful and inherently complex. To manage this complexity, several critical infrastructure components are required.

    Core Components And Communication Patterns

    At the heart of any microservices architecture is the need for robust and reliable inter-service communication. This introduces essential infrastructure that is absent in a monolithic world.

    • API Gateway: This component acts as a single entry point for all client requests. The gateway routes requests to the appropriate downstream microservice, abstracting the internal service topology from clients. It is also the ideal location to implement cross-cutting concerns such as SSL termination, authentication, rate limiting, and caching.
    • Service Discovery: In a dynamic environment where service instances are ephemeral and scale up or down, a mechanism is needed for services to locate each other. A service discovery component (e.g., Consul, Eureka) acts as a dynamic registry, maintaining the network locations of all service instances.
    • Inter-service Communication: Services must communicate over the network. This typically occurs via two primary patterns: synchronous communication using protocols like REST over HTTP or gRPC for direct request-response interactions, or asynchronous communication using message brokers (e.g., RabbitMQ, Apache Kafka) for event-driven workflows where services publish and subscribe to events.

    With numerous moving parts, defining clear API contracts (e.g., using OpenAPI or Protocol Buffers) and adhering to solid API development best practices is non-negotiable. This structured communication is what enables the distributed system to function cohesively.

    The real power of microservices lies in independent scalability and fault isolation. If the payment service experiences a surge in traffic, you can scale only that service horizontally without affecting other services. Similarly, if a non-critical service fails, the system can degrade gracefully without a catastrophic failure of the entire application.

    Benefits And Emerging Realities

    The promise of enhanced modularity and scalability has driven widespread adoption, with up to 85% of large organizations adopting microservices. However, it is not a panacea. The operational reality, particularly challenges with network latency and distributed system complexity, has led some prominent companies, like Amazon Prime Video, to reconsider and move certain components back to a monolithic structure.

    This has fueled interest in the "modular monolith"—a single deployable application with strong, well-enforced internal boundaries—as a more pragmatic alternative. This trend underscores that the architectural choice is highly context-dependent, hinging on scale, team structure, and business objectives.

    Another significant benefit is technology heterogeneity, which allows teams to select the optimal technology stack for each service. You can delve deeper into this in our comprehensive guide to microservices architecture design patterns.

    While this architecture supports massive scale and parallel development, it introduces the inherent complexity of distributed systems, which we will now explore in detail.

    Technical Trade-Offs In Development And Operations

    When evaluating microservices vs. monolithic architecture from an engineering perspective, the most significant differences manifest in the day-to-day development and operational workflows. This architectural choice is not a one-time decision; it fundamentally shapes how teams write code, build and test software, and manage production systems. Each approach presents a distinct set of technical trade-offs that impact everything from developer productivity to system reliability.

    For any engineering leader, a deep understanding of these granular details is critical. An architecture that appears elegant on a whiteboard can introduce immense friction if it misaligns with the team's skillset, operational maturity, or the product's long-term roadmap. Let's dissect the key areas where these two architectures diverge.

    Development Workflow And Team Structure

    In a monolith, development is centralized. The entire team works within a single large codebase, which simplifies cross-cutting changes. A developer can modify a database schema, update the business logic that consumes it, and adjust the UI in a single atomic commit.

    This integrated structure is highly effective for small, collocated teams where informal communication is sufficient for coordination. However, as the team and codebase grow, this advantage erodes. Merge conflicts become frequent, build times extend from minutes to hours, and onboarding new engineers becomes a formidable task, as they must comprehend the entire system's complexity.

    Microservices champion decentralized development. Each service is owned by a small, autonomous team. This structure enables teams to develop, test, and deploy in parallel with minimal cross-team dependencies, dramatically increasing feature velocity for large organizations. A team can iterate on its service, run its isolated test suite, and deploy to production independently.

    Key Consideration: The fundamental trade-off is between coordination simplicity and development velocity. Monoliths simplify coordination for small teams at the cost of potential future bottlenecks. Microservices enable parallel, high-velocity development for larger organizations but introduce the overhead of formal inter-team communication and API contract management.

    CI/CD Pipelines And Deployment Complexity

    Deployment is perhaps the most starkly contrasting aspect. With a monolith, the process is conceptually simple: build the entire application into a single artifact, execute a comprehensive test suite, and deploy the unit. While straightforward, this process is brittle and slow. A minor change in a single module requires a full redeployment of the entire application, introducing risk and creating a release train that can block critical updates.

    Microservices, conversely, necessitate a sophisticated Continuous Integration and Continuous Delivery (CI/CD) model. Each service has its own independent deployment pipeline, allowing it to be built, tested, and deployed without impacting other services. This enables rapid, incremental updates and significantly reduces the blast radius of a failed deployment.

    However, this independence introduces significant operational challenges:

    • Pipeline Sprawl: Managing and maintaining dozens or hundreds of separate CI/CD pipelines requires substantial automation and tooling.
    • Version Management: Tracking dependencies between services and ensuring compatibility between different service versions (e.g., using consumer-driven contract testing) is a complex problem.
    • Orchestration: Container orchestration platforms like Kubernetes become essential for managing the deployment, scaling, networking, and health of a fleet of distributed services.

    Scalability And Performance Characteristics

    A monolith is typically scaled horizontally by deploying multiple instances of the entire application behind a load balancer. This approach is effective but often inefficient. If only a single, computationally intensive feature (e.g., video transcoding) is experiencing high load, the entire application must be scaled, wasting resources on idle components.

    Microservices provide granular scalability, a key advantage. If the user authentication service is under heavy load, only that service needs to be scaled by increasing its instance count. This targeted scaling is highly resource-efficient and cost-effective, allowing for precise allocation of infrastructure resources.

    The trade-off is performance overhead. Every inter-service call is a network request, which introduces latency and is inherently less reliable than an in-process method call within a monolith. This network latency can accumulate in complex call chains, and poorly designed service interactions can create performance bottlenecks and cascading failures that are difficult to debug.

    Data Management And Fault Tolerance

    In a monolith, data management is simplified by a single, shared database that guarantees strong transactional consistency (ACID properties). This makes it easy to implement operations that span multiple domain entities while ensuring data integrity.

    Microservices advocate for decentralized data management, where each service owns its own private database. This grants teams autonomy and prevents the database from becoming a performance bottleneck or a single point of failure. However, it introduces significant new challenges:

    • Data Consistency: Maintaining data consistency across multiple distributed databases requires implementing complex patterns like the Saga pattern to manage eventual consistency.
    • Distributed Transactions: Implementing atomic transactions that span multiple services is extremely difficult and often discouraged in favor of idempotent, compensating actions.
    • Complex Queries: Joining data across different services requires building API composition layers or implementing data aggregation patterns like Command Query Responsibility Segregation (CQRS).

    This division also impacts fault tolerance. A critical failure in a monolith, such as a database connection pool exhaustion, can bring the entire application down. A well-designed microservices system, however, provides superior fault isolation. If a non-essential service (e.g., a recommendation engine) fails, the core application can continue to function, enabling graceful degradation rather than a total outage.

    Detailed Technical Trade-Offs Monolith vs Microservices

    Technical Aspect Monolithic Approach Microservices Approach Key Consideration
    Codebase Management Single, large repository. Easier for small teams to coordinate. Multiple repositories, one per service. Promotes team autonomy. Merge conflicts and build times increase with team size in a monolith.
    Development Velocity Slower over time as complexity grows; changes are coupled. Faster for individual teams; parallel development is possible. Requires strong API contracts and communication to avoid integration chaos.
    CI/CD Pipeline Single, complex pipeline. A failure blocks the entire release. Independent pipeline per service. Enables rapid, isolated deployments. Operational overhead of managing many pipelines is significant.
    Scalability Scaled as a single unit. Often inefficient and costly. Granular scaling of individual services. Highly efficient. Network latency between services can become a performance bottleneck.
    Data Consistency Strong consistency (ACID) via a shared database. Simple. Eventual consistency is the norm. Requires complex patterns. Business requirements for transactional integrity are a critical factor.
    Fault Isolation Low. A failure in one module can crash the entire application. High. Failure of one service won't bring down others. Requires robust resiliency patterns like circuit breakers and retries.
    Onboarding Difficult. New developers must understand the entire system. Easier. A developer only needs to learn a single service's context. Understanding the overall system architecture becomes more abstract.
    Technology Stack One standardized stack for the entire application. Polyglot. Teams can choose the best tech for their service. Managing and securing multiple technology stacks adds complexity.

    This table underscores that there is no universally "correct" answer. The optimal choice is deeply contextual, depending on your team's size and expertise, your operational capabilities, and the specific technical challenges you aim to solve.

    Making The Right Architectural Choice

    So, how do you translate these technical trade-offs into a definitive decision for your project? The process must be pragmatic and grounded in an honest assessment of your organization's current capabilities and future needs. The "right" architecture is the one that aligns with your team size, product complexity, scalability targets, and operational maturity.

    Adopting microservices before your team and infrastructure are ready can lead to a distributed monolith—a worst-of-both-worlds scenario. Conversely, sticking with a monolith for too long can stifle growth and innovation. Making an informed decision requires asking critical, context-specific questions.

    A Practical Decision Checklist

    Before committing to an architectural path, use this checklist to evaluate your specific situation. The answers will guide you toward either the operational simplicity of a monolith or the granular control of microservices.

    • Team Size and Structure: What is the current and projected size of your engineering team? Are you a single, co-located team, or distributed autonomous squads? (Conway's Law)
    • Domain Complexity: Is your application's business domain relatively simple and cohesive, or is it composed of multiple complex, loosely related subdomains?
    • Scalability Requirements: Do you anticipate uniform load across the application, or will specific functionalities require independent, elastic scaling to handle load spikes?
    • Operational Maturity: Does your team have deep expertise in CI/CD, container orchestration (like Kubernetes), distributed monitoring, and infrastructure-as-code?
    • Speed to Market: Is the primary business driver to ship an MVP as quickly as possible to validate a market, or are you building a long-term, highly scalable platform?

    This flowchart illustrates how a single factor—team size—can heavily influence the decision.

    Architecture decision tree flowchart comparing monolithic and microservices based on small or large team size.

    This visualizes a core principle: smaller teams benefit from a monolith's reduced cognitive and operational load, while larger organizations can leverage microservices to minimize coordination overhead and maximize parallel development.

    When To Choose A Monolith

    Despite the industry's focus on distributed systems, a monolithic architecture remains the most pragmatic choice for many scenarios. Its low initial complexity and minimal operational overhead are decisive advantages under the right conditions.

    A monolith is often your best bet for:

    • Startups and MVPs: When time-to-market is critical, a monolith enables a small team to build and deploy a functional product rapidly, without the distraction of managing a complex distributed system.
    • Simple Applications: For applications with a limited and well-defined scope (e.g., a departmental CRUD application or a simple content management system), the overhead of microservices is unjustifiable.
    • Small, Co-located Teams: If your entire engineering team can easily coordinate and has a shared understanding of the codebase, the simplicity of a single repository and deployment process is highly efficient.

    A monolith isn’t a legacy choice; it’s a strategic one. For an early-stage product, it is often the most capital-efficient path to market validation, preserving engineering resources for when scaling challenges become a reality.

    When To Justify Microservices

    The significant investment in infrastructure, tooling, and specialized expertise required by microservices is only justified when the problems they solve—such as scaling bottlenecks, slow development velocity, and organizational complexity—are more costly than the complexity they introduce.

    Consider microservices for:

    • Large-Scale Platforms: For applications with high traffic volumes and complex user interactions (e.g., e-commerce platforms, streaming services), the ability to independently scale and deploy components is a necessity.
    • Complex Business Domains: When an application comprises multiple distinct and complex business capabilities, microservices help manage this complexity by enforcing strong boundaries and allowing for specialized implementations.
    • Large Engineering Organizations: Microservices align with organizational structures that feature multiple autonomous teams, enabling them to work on different parts of the application in parallel, thereby accelerating development velocity at scale.

    The Middle Ground: A Modular Monolith

    For teams caught between these two architectural poles, the Modular Monolith offers a compelling hybrid solution. This approach involves building a single, deployable application while enforcing strict, logical boundaries between different modules within the codebase, often using language-level constructs like Java modules or .NET assemblies.

    Each module is designed as if it were a separate service, with well-defined public APIs and no direct dependencies on the internal implementation of other modules. This model provides many of the benefits of microservices—such as improved code organization and clear separation of concerns—without the significant operational overhead of a distributed system. It also provides a clear and low-risk migration path for the future; well-encapsulated modules are far easier to extract into independent microservices when the need arises.

    Migrating From Monolith To Microservices

    Migrating from a monolith to a microservices architecture is a major undertaking that requires a meticulous and strategic approach. A "big bang" rewrite, where the entire application is rebuilt from scratch, is a high-risk strategy that rarely succeeds due to its long development timeline, delayed value delivery, and the immense challenge of keeping the new system in sync with the evolving legacy one.

    An incremental migration is the only viable path. This involves gradually decomposing the monolith by extracting functionality into new, independent microservices. This iterative approach allows for continuous value delivery, reduces risk, and keeps the existing application operational throughout the process.

    Adopting The Strangler Fig Pattern

    The Strangler Fig Pattern is a widely adopted, battle-tested strategy for incremental migration. The pattern involves building a new system around the edges of the old one, gradually intercepting and replacing its functionality until the old system is "strangled" and can be decommissioned.

    The process begins by placing a reverse proxy or an API gateway in front of the monolith, which initially routes all traffic to the legacy application. Next, you identify a specific, well-bounded piece of functionality to extract—for example, user authentication. You then build this functionality as a new, independent microservice.

    Once the new service is developed and tested, you configure the gateway to route all authentication-related requests to the new microservice instead of the monolith. This process is repeated for other functionalities, one service at a time, until the monolith's responsibilities have been fully taken over by the new microservices.

    The primary benefit of the Strangler Fig Pattern is risk mitigation. It allows you to validate each new service in a production environment independently, without the immense pressure of a single, high-stakes cutover. This transforms a daunting migration into a series of manageable, iterative steps.

    Key Technical Challenges In Migration

    A successful migration requires addressing several complex technical challenges head-on. Failure to do so can result in a "distributed monolith"—an anti-pattern that combines the distributed systems complexity of microservices with the tight coupling of a monolith.

    Key challenges include:

    • Identifying Service Boundaries: Defining the correct boundaries for each microservice is critical. This process should be driven by business domains, not just technical considerations. Domain-Driven Design (DDD) is the standard methodology here, helping to identify "bounded contexts" that map cleanly to independent services with high cohesion and loose coupling.
    • Managing Data Consistency: Extracting a service often means disentangling its data from a large, shared monolithic database. This immediately introduces challenges with data consistency across distributed systems. You will need to implement patterns like event-driven architectures, change data capture (CDC), or the Saga pattern to manage transactions that now span multiple services and databases.
    • Infrastructure and Observability: You are not just building services; you are building a platform to run them. This requires an API gateway for traffic management, a service discovery mechanism, and a robust observability stack. Centralized logging (e.g., ELK stack), distributed tracing (e.g., Jaeger, OpenTelemetry), and comprehensive monitoring and alerting are non-negotiable for debugging and operating a complex distributed system effectively.

    This process shares many similarities with other large-scale modernization efforts. For a deeper technical dive into planning and execution, see our guide on legacy system modernisation. Addressing these challenges proactively is what distinguishes a successful migration from a costly failure.

    Got Questions? We've Got Answers

    Choosing an architecture invariably raises numerous practical questions. Here are answers to the most common technical queries from teams deliberating the microservices vs monolithic architecture trade-off.

    When Is A Monolith Actually Better Than Microservices?

    A monolith is technically superior for early-stage projects, MVPs, and small teams where development velocity and simplicity are paramount. Its single-process architecture eliminates the network latency and distributed systems complexity inherent in microservices, resulting in simpler debugging, testing, and deployment workflows.

    If your application domain is not overly complex and does not have disparate scaling requirements for its features, the operational simplicity of a monolith provides a significant advantage. The reduced cognitive overhead and lower infrastructure costs make it a more efficient and pragmatic starting point.

    What's The Single Biggest Hurdle In Adopting Microservices?

    From a technical standpoint, the single biggest hurdle is managing the immense increase in operational complexity. You are no longer managing a single application; you are operating a complex distributed system. This requires deep expertise in service discovery, API gateways, distributed tracing, centralized logging, container orchestration, and sophisticated CI/CD pipelines.

    The core challenge is not just adopting new tools but fostering a DevOps culture. Your team must be prepared for the significant overhead of monitoring, debugging, and maintaining a fleet of independent services, which requires a fundamentally different skillset and mindset compared to managing a single monolithic application.

    Can You Mix and Match Architectures?

    Absolutely. A hybrid architecture is not only feasible but often the most pragmatic long-term strategy. Starting with a monolith allows for rapid initial development. As the application and team grow, you can strategically decompose the monolith by extracting specific functionalities into microservices using a controlled approach like the Strangler Fig Pattern.

    This allows you to isolate high-load, frequently changing, or business-critical features into their own services, reaping the benefits of microservices where they provide the most value. Meanwhile, the stable, less-volatile core of the application can remain as a monolith. This iterative approach balances innovation speed with operational stability, avoiding the high risk of a "big bang" rewrite.


    Ready to build a rock-solid DevOps strategy for whichever path you choose? OpsMoon will connect you with elite remote engineers who live and breathe scalable systems. Book a free work planning session to map out your infrastructure and find the exact talent you need to move faster.

  • A Technical Guide to Selecting a DevOps Consulting Company

    A Technical Guide to Selecting a DevOps Consulting Company

    A DevOps consulting company provides specialized engineering teams to architect, implement, and optimize your software delivery lifecycle and cloud infrastructure. They act as strategic partners, applying automation, cloud-native principles, and site reliability engineering (SRE) practices to a single goal: accelerating your software delivery velocity while improving system stability and security. Their core function is to solve complex technical challenges related to infrastructure, CI/CD, and operations.

    Why Your Business Needs a DevOps Consulting Company

    In a competitive market, internal teams are often constrained by the operational overhead of complex toolchains, mounting technical debt, and inefficient release processes. This friction leads to slower feature delivery, developer burnout, and increased risk of production failures. A specialized DevOps consulting company addresses these technical bottlenecks directly. They don't just recommend tools; they implement and integrate them, driving fundamental improvements to your engineering workflows.

    Illustration showing Dev and Ops hands collaborating with a cloud, representing DevOps principles.

    This need for deep technical expertise is reflected in market data. The global DevOps consulting sector is projected to expand from approximately $8.6 billion in 2025 to $16.9 billion by 2033. This growth is driven by the clear technical and business advantages of a mature DevOps practice.

    Before evaluating potential partners, it's crucial to understand the specific technical domains where they deliver value. Their services are typically segmented into key areas, each targeting a distinct part of the software development and operational lifecycle.

    Core Services Offered by a DevOps Consulting Company

    Here is a technical breakdown of the primary service domains. Use this to identify specific gaps in your current engineering capabilities.

    Service Category Key Activities & Tools Technical Impact
    CI/CD Pipeline & Automation Architecting multi-stage, YAML-based pipelines in tools like Jenkins (declarative), GitLab CI, or GitHub Actions. Implementing build caching, parallel job execution, and artifact management. Reduces lead time for changes by automating build, test, and deployment workflows. Enforces quality gates and minimizes human error in release processes.
    Cloud Infrastructure & IaC Provisioning and managing immutable infrastructure using declarative tools like Terraform or imperative SDKs like Pulumi. Structuring code with modules for reusability and managing state remotely. Creates reproducible, version-controlled cloud environments. Enables automated scaling, disaster recovery, and eliminates configuration drift between dev, staging, and prod.
    DevSecOps & Security Integrating SAST (e.g., SonarQube), DAST (e.g., OWASP ZAP), and SCA (e.g., Snyk) scanners into CI pipelines as blocking quality gates. Managing secrets with Vault or cloud-native services. Shifts security left, identifying vulnerabilities in code and dependencies before they reach production. Reduces the attack surface and minimizes the cost of remediation.
    Observability & Monitoring Implementing the three pillars of observability: metrics (e.g., Prometheus), logs (e.g., ELK Stack, Loki), and traces (e.g., Jaeger). Building actionable dashboards in Grafana. Provides deep, real-time insight into system performance and application behavior. Enables rapid root cause analysis and proactive issue detection based on service-level objectives (SLOs).
    Kubernetes & Containerization Designing and managing production-grade Kubernetes clusters (e.g., EKS, GKE, AKS). Writing Helm charts, implementing GitOps with ArgoCD, and configuring service meshes (e.g., Istio). Decouples applications from underlying infrastructure, improving portability and resource efficiency. Simplifies management of complex microservices architectures.

    Understanding these technical functions allows you to engage potential partners with a precise problem statement, whether it's reducing pipeline execution time or implementing a cost-effective multi-tenant Kubernetes architecture.

    Accelerate Your Time to Market

    A primary technical objective is to reduce the "commit-to-deploy" time. Consultants achieve this by architecting efficient Continuous Integration and Continuous Deployment (CI/CD) pipelines.

    Instead of a manual release process involving SSH, shell scripts, and manual verification, they implement fully automated, declarative pipelines. For example, a consultant might replace a multi-day manual release with a GitLab CI pipeline that automatically builds a container, runs unit and integration tests in parallel jobs, scans the image for vulnerabilities, and performs a canary deployment to Kubernetes in under 15 minutes. This drastically shortens the feedback loop for developers and accelerates feature velocity.

    Embed Security into the Lifecycle

    DevSecOps is the practice of integrating automated security controls directly into the CI/CD pipeline, making security a shared responsibility. An experienced consultant implements this by adding specific stages to your pipeline.

    A consultant’s value isn't just in the tools they implement, but in the cultural shift they catalyze. They are external change agents who can bridge the developer-operator divide and foster a shared sense of ownership over the entire delivery process.

    This technical implementation typically includes:

    • Static Application Security Testing (SAST): Scans source code for vulnerabilities (e.g., SQL injection, XSS) using tools like SonarQube, integrated as a blocking step in a merge request pipeline.
    • Dynamic Application Security Testing (DAST): Tests the running application in a staging environment to find runtime vulnerabilities by simulating attacks.
    • Software Composition Analysis (SCA): Uses tools like Snyk or Trivy to scan package manifests (package.json, requirements.txt) for known CVEs in third-party libraries.

    By embedding these checks as automated quality gates, security becomes a proactive, preventative measure, not a reactive bottleneck.

    Build a Scalable Cloud Native Foundation

    As services scale, the underlying infrastructure must scale elastically without manual intervention. DevOps consultants design cloud-native architectures using technologies like Kubernetes, serverless functions, and Infrastructure as Code (IaC). Using Terraform, they define all infrastructure components—from VPCs and subnets to Kubernetes clusters and IAM roles—in version-controlled code.

    This IaC approach ensures environments are identical and reproducible, eliminating "it works on my machine" issues. Furthermore, documenting this infrastructure via code is a core tenet and complements the benefits of a knowledge management system. This practice prevents knowledge silos and streamlines the onboarding of new engineers by providing a single source of truth for the entire system architecture.

    How to Vet Your Ideal DevOps Partner

    Selecting the right DevOps consulting company requires moving beyond marketing collateral and conducting a rigorous technical evaluation. Your goal is to probe their real-world, hands-on expertise by asking specific, scenario-based questions that reveal their problem-solving methodology and depth of knowledge.

    Hand-drawn DevOps checklist featuring Terraform, Kubernetes, and Git, with some items checked.

    The vetting process should feel like a system design interview. You need a partner who can architect solutions for your specific technical challenges, not just recite generic DevOps principles.

    Probing Their Infrastructure as Code Expertise

    Proficiency in Infrastructure as Code (IaC) is non-negotiable. A simple "Do you use Terraform?" is insufficient. You must validate the sophistication of their approach.

    Begin by asking how they structure Terraform code for multi-environment deployments (dev, staging, production). A competent response will involve strategies like using Terragrunt for DRY configurations, a directory-based module structure (/modules, /environments), or Terraform workspaces. They should be able to articulate how they manage environment-specific variables and prevent configuration drift.

    A true sign of an experienced DevOps firm is how they handle failure. Ask them to walk you through a time a tricky terraform apply went sideways and how they fixed it. Their story will tell you everything you need to know about their troubleshooting chops and whether they prioritize safe, incremental changes.

    Drill down on their state management strategy. Ask how they handle remote state. The correct answer involves using a remote backend like Amazon S3 coupled with a locking mechanism like DynamoDB to prevent concurrent state modifications and corruption. This is a fundamental best practice that separates amateurs from professionals.

    Evaluating Their Container Orchestration and CI/CD Philosophy

    Containerization with Docker and orchestration with Kubernetes are central to modern cloud-native systems. Your partner must demonstrate deep, practical experience.

    Ask them to describe a complex Kubernetes deployment they've managed. Probe for details on their approach to ingress controllers, service mesh implementation for mTLS, or strategies for managing persistent storage with StorageClasses and PersistentVolumeClaims. Discuss specifics like network policies for pod-to-pod communication or RBAC configuration for securing the Kubernetes API. A competent team will provide detailed anecdotes.

    Then, pivot to their CI/CD methodology. "We use Jenkins" is not an answer. Go deeper with technical questions:

    • How do you optimize pipeline performance for both speed and resource usage? Look for answers involving multi-stage Docker builds, caching dependencies (e.g., Maven/.npm directories), and running test suites in parallel jobs.
    • How do you secure secrets within a CI/CD pipeline? A strong answer will involve fetching credentials at runtime from a secret manager like HashiCorp Vault or AWS Secrets Manager, rather than storing them as environment variables in the CI tool.
    • Describe a scenario where you would choose GitHub Actions over GitLab CI, and vice versa. A seasoned consultant will discuss trade-offs related to ecosystem integration, runner management, and feature sets (e.g., GitLab's integrated container registry and security scanning).

    A rigid, "one-tool-fits-all" mindset is a major red flag. True experts tailor their toolchain recommendations to the client's existing stack, team skills, and specific technical requirements. For more on what separates the best from the rest, check out our detailed guide on leading DevOps consulting companies.

    Uncovering Technical and Strategic Red Flags

    During these technical discussions, be vigilant for indicators of shallow expertise. Vague answers or an inability to substantiate claims with specific examples are warning signs.

    Here are three critical red flags:

    1. Buzzwords Without Implementation Details: If they use terms like "shift left" but cannot detail how they would integrate a SAST tool into a GitLab merge request pipeline to act as a quality gate, they lack practical experience. Challenge them to describe a specific vulnerability class they've mitigated with an automated security control.
    2. Ignorance of DORA Metrics: Elite DevOps consultants are data-driven. If they cannot hold a detailed conversation about measuring and improving the four key DORA metrics—Deployment Frequency, Lead Time for Changes, Mean Time to Recovery, and Change Failure Rate—they are likely focused on completing tasks, not delivering measurable outcomes.
    3. Inability to Discuss Technical Trade-offs: Every engineering decision involves compromises. Ask why they might choose Pulumi (using general-purpose code) over Terraform (using HCL), or an event-driven serverless architecture over a Kubernetes-based one for a specific workload. A partner who cannot articulate the pros and cons of different technologies lacks the deep expertise required for complex system design.

    Understanding Engagement Models and Pricing Structures

    To avoid scope creep and budget overruns, you must understand the contractual and financial frameworks used by consulting firms. The engagement model directly influences risk, flexibility, and total cost of ownership (TCO). Misalignment here often leads to friction and missed technical objectives.

    The optimal model depends on your technical goals. Are you executing a well-defined migration project? Do you need ongoing operational support for a production system? Or are you looking to embed a specialist to upskill your team? Each scenario has distinct financial and technical implications.

    Project-Based Engagements

    This is a fixed-scope, fixed-price model centered on a specific, time-bound deliverable. The scope of work (SOW), timeline, and total cost are agreed upon upfront.

    • Technical scenario: A company needs to build a CI/CD pipeline for a microservice. The deliverable is a production-ready GitLab CI pipeline that builds a Docker image, runs tests, and deploys to an Amazon EKS cluster via a Helm chart. The engagement concludes upon successful deployment and delivery of documentation.
    • The upside: High budget predictability. The cost is known, simplifying financial planning.
    • The downside: Inflexibility. If new technical requirements emerge mid-project, a formal change order is required, leading to renegotiation, delays, and increased costs.

    The success of a project-based engagement is entirely dependent on the technical specificity of the Statement of Work (SOW). Scrutinize it for precise definitions of "done," explicit deliverables (e.g., "Terraform modules for the VPC, subnets, NAT Gateways, and EKS cluster"), and payment milestones tied to concrete technical achievements. An ambiguous SOW is a recipe for conflict.

    Retainers and Managed Services

    For continuous operational support, a retainer or managed services model is more appropriate. This model is effectively outsourcing the day-to-day management of your DevOps functions.

    This is the core of DevOps as a Service. It provides ongoing access to a team of experts for tasks like pipeline maintenance, cloud cost optimization, security patching, and incident response, without the overhead of hiring additional full-time engineers.

    • Technical scenario: An established SaaS company requires 24/7 SRE support for its production Kubernetes environment. This includes proactive monitoring with Prometheus/Alertmanager, managing SLOs/SLIs, responding to incidents, and performing regular cluster upgrades and security patching. A managed services agreement guarantees expert availability.
    • The upside: Predictable monthly operational expenditure (OpEx) and guaranteed access to specialized skills for maintaining system reliability and security.
    • The downside: Can be more costly than a project-based model if your needs are intermittent. You are paying for guaranteed availability, not just hours worked.

    Staff Augmentation

    Staff augmentation involves embedding one or more consultants directly into your engineering team. They operate under your direct management to fill a specific skill gap or provide additional bandwidth for a critical project.

    This is not outsourcing a function, but rather acquiring specialized technical talent on a temporary basis. The consultant joins your daily stand-ups, participates in sprint planning, and commits code to your repositories just like a full-time employee.

    • Technical scenario: Your platform team is adopting a service mesh but lacks deep expertise in Istio. You bring in a consultant to lead the implementation of mTLS and traffic shifting policies, and, crucially, to pair-program with and mentor your internal team on Istio's configuration and operational management.
    • The upside: Maximum flexibility and deep integration. You get the precise skills needed and retain full control over the consultant's day-to-day priorities.
    • The downside: Typically the highest hourly cost. It also requires significant management overhead from your engineering leads to direct their work and integrate them effectively.

    How to Measure Success: Metrics and SLAs That Actually Matter

    Vague goals like "improved efficiency" are insufficient to justify the investment in a DevOps consulting company. To measure ROI, you must use quantifiable technical metrics and enforce them with a stringent Service Level Agreement (SLA). This data-driven approach transforms ambiguous objectives into trackable outcomes.

    The market demand for such measurable results is intense; the global DevOps market is projected to grow from $18.11 billion in 2025 to $175.53 billion by 2035, a surge fueled by organizations demanding tangible performance improvements.

    First, Get a Baseline with DORA Metrics

    Before any implementation begins, a baseline of your current performance is essential. The industry standard for measuring software delivery performance is the set of four DORA (DevOps Research and Assessment) metrics.

    Any credible consultant will begin by establishing these baseline measurements:

    • Deployment Frequency: How often does code get successfully deployed to production? Elite performers deploy on-demand, multiple times a day.
    • Lead Time for Changes: What is the median time from a code commit to it running in production? This is a key indicator of pipeline efficiency.
    • Mean Time to Recovery (MTTR): How long does it take to restore service after a production failure? This directly measures system resilience.
    • Change Failure Rate: What percentage of deployments to production result in a degradation of service and require remediation? This measures release quality and stability.

    Tracking these metrics provides objective evidence of whether the consultant's interventions are improving engineering velocity and system stability.

    Go Beyond DORA to Business-Focused KPIs

    While DORA metrics are crucial for engineering health, success also means linking technical improvements to business outcomes. The engagement agreement should include specific targets for KPIs that impact the bottom line.

    A great SLA isn't just a safety net for when things go wrong; it's a shared roadmap for what success looks like. It aligns your business goals with the consultant's technical work, making sure everyone is rowing in the same direction.

    Here are some examples of technical KPIs with business impact:

    • Infrastructure Cost Reduction: Set a quantitative target, such as "Reduce monthly AWS compute costs by 15%" by implementing EC2 Spot Instances for stateless workloads, rightsizing instances, and enforcing resource tagging for cost allocation.
    • Build and Deployment Times: Define a specific performance target for the CI/CD pipeline, such as "Reduce the average p95 build-to-deploy time from 20 minutes to under 8 minutes."
    • System Uptime and Availability: Define availability targets with precision, such as "Achieve 99.95% uptime for the customer-facing API gateway," measured by an external monitoring tool and excluding scheduled maintenance windows.

    Crafting an SLA That Has Teeth

    The SLA is the contractual instrument that formalizes these metrics. It must be specific, measurable, and unambiguous. For uptime and disaster recovery, this includes implementing robust technical solutions, such as strategies for multi-provider failover reliability.

    A strong, technical SLA should define:

    1. Response Times: Time to acknowledge an alert, tied to severity. A "Severity 1" (production outage) incident should mandate a response within 15 minutes.
    2. Resolution Times: Time to resolve an issue, also tied to severity.
    3. Availability Guarantees: The specific uptime percentage (e.g., 99.9%) and a clear, technical definition of "downtime" (e.g., 5xx error rate > 1% over a 5-minute window).
    4. Severity Level Definitions: Precise, technical criteria for what constitutes a Sev-1, Sev-2, or Sev-3 incident.
    5. Reporting and Communication: Mandated frequency of reporting (e.g., weekly DORA metric dashboards) and defined communication protocols (e.g., a dedicated Slack channel).

    These metrics are foundational to Site Reliability Engineering. To explore how SRE principles can enhance system resilience, see our guide on service reliability engineering.

    Your First 90 Days with a DevOps Consultant

    The initial three months of an engagement are critical for setting the trajectory of the partnership. A structured, technical onboarding process is essential for achieving rapid, tangible results. This involves a methodical progression from system discovery and access provisioning to implementing foundational automation and delivering measurable improvements.

    This focus on rapid, iterative impact is a key driver of the DevOps market, which saw growth from an estimated $10.46 billion to $15.06 billion in a single year. These trends are explored in-depth in Baytech Consulting's analysis of the state of DevOps in 2025.

    A successful 90-day plan should follow a logical, phased approach: Baseline, Implement, and Optimize.

    Timeline illustrating three stages: Baseline, Implement, and Optimize, for measuring DevOps success.

    This structured methodology ensures that solutions are built upon a thorough understanding of the existing environment, preventing misguided efforts and rework.

    Kicking Things Off: The Discovery Phase

    The first two weeks are dedicated to deep technical discovery. The objectives are to provision secure access, conduct knowledge transfer sessions, and perform a comprehensive audit of existing systems and workflows.

    Your onboarding checklist must include:

    • Scoped Access Control: Grant initial read-only access using dedicated IAM roles. This includes code repositories (GitHub, GitLab), cloud provider consoles (AWS, GCP, Azure), and CI/CD systems. Adherence to the principle of least privilege is non-negotiable; never grant broad administrative access on day one.
    • Architecture Review Sessions: Schedule technical deep-dives where your engineers walk the consultants through system architecture diagrams, data flow, network topology, and current deployment processes.
    • Toolchain and Dependency Mapping: The consultants should perform an audit to map all tools, libraries, and service dependencies to identify bottlenecks, security vulnerabilities, and single points of failure.
    • DORA Metrics Baseline: Establish the initial measurements for Deployment Frequency, Lead Time for Changes, Mean Time to Recovery (MTTR), and Change Failure Rate to serve as the benchmark for future improvements.

    One of the biggest mistakes I see teams make is holding back information during onboarding. Be brutally honest about your technical debt and past failures. The more your consultants know about the skeletons in the closet, the faster they can build solutions that actually fit your reality, not just some generic template.

    The implementation roadmap will vary significantly based on your company's maturity. A startup requires foundational infrastructure, while an enterprise often needs to modernize legacy systems.

    Sample Roadmap for a Startup

    For a startup, the first 90 days are focused on establishing a scalable, automated foundation to support rapid product development. The goal is to evolve from manual processes to a robust CI/CD pipeline.

    Here is a practical, phased 90-day plan for a startup:

    Phase Timeline Key Technical Objectives Success Metrics
    Foundation (IaC) Weeks 1-2 – Audit existing cloud resources
    – Codify core network infrastructure (VPC, subnets, security groups) using Terraform modules
    – Establish a Git repository with protected branches for IaC
    100% of core infrastructure managed via version-controlled code
    – Ability to provision a new environment from scratch in < 1 hour
    CI Implementation Weeks 3-4 – Configure self-hosted or cloud-based CI runners (GitHub Actions, etc.)
    – Implement a CI pipeline that triggers on every commit to main, automating build and unit tests
    – Integrate SAST and linting as blocking jobs
    – Build success rate >95% on main
    – Average CI pipeline execution time < 10 minutes
    Staging Deployments Weeks 5-8 – Write a multi-stage Dockerfile for the primary application
    – Provision a separate staging environment using the Terraform modules
    – Create a CD pipeline to automatically deploy successful builds from main to staging
    – Fully automated, zero-touch deployment to staging
    – Staging environment accurately reflects production configuration
    Production & Observability Weeks 9-12 – Implement a Blue/Green or canary deployment strategy for production releases
    – Instrument the application and infrastructure with Prometheus metrics
    – Set up a Grafana dashboard for key SLIs (latency, error rate, saturation)
    – Zero-downtime production deployments executed via pipeline
    – Actionable alerts configured for production anomalies

    This roadmap provides a clear technical path from manual operations to an automated, observable, and scalable platform.

    Sample Roadmap for an Enterprise

    For an enterprise, the challenge is typically modernizing a legacy monolithic application by containerizing it and deploying it to a modern orchestration platform.

    Weeks 1-4: Kubernetes Foundation and Application Assessment
    The initial phase involves provisioning a production-grade Kubernetes cluster (e.g., EKS, GKE) using Terraform. Concurrently, consultants perform a detailed analysis of the legacy application to identify dependencies, configuration parameters, and stateful components, creating a containerization strategy.

    Weeks 5-8: Containerization and CI Pipeline Integration
    The team develops a Dockerfile to containerize the legacy application, externalizing configuration and handling stateful data. They then build a CI pipeline in a tool like Jenkins or GitLab CI that compiles the code, builds the Docker image, and pushes the versioned artifact to a container registry (e.g., ECR, GCR). This pipeline must include SCA scanning of the final image for known CVEs.

    Weeks 9-12: Staging Deployment and DevSecOps Integration
    With a container image available, the team writes Kubernetes manifests (Deployments, Services, ConfigMaps, Secrets) or a Helm chart to deploy the application into a staging namespace on the Kubernetes cluster. The CD pipeline is extended to automate this deployment. Crucially, this stage integrates Dynamic Application Security Testing (DAST) against the running application in staging as a final quality gate before a manual promotion to production can occur.

    Your Questions, Answered

    When evaluating a DevOps consulting firm, several key questions consistently arise regarding cost, security, and knowledge transfer. Here are direct, technical answers.

    How Much Does a DevOps Consulting Company Cost?

    Pricing is determined by the engagement model, scope complexity, and the seniority of the consultants. Here are typical cost structures:

    • Hourly Rates: Ranging from $150 to over $350 per hour. This model is suitable for staff augmentation or advisory roles where the scope is fluid.
    • Project-Based Pricing: For a defined outcome, such as a complete Terraform-based AWS infrastructure build-out, expect a fixed price between $20,000 and $100,000+. The cost scales with complexity (e.g., multi-region, high availability, compliance requirements).
    • Retainer/Managed Services: For ongoing SRE and operational support, monthly retainers typically range from $5,000 to $25,000+, depending on the scope of services (e.g., 24/7 incident response vs. business hours support) and the size of the infrastructure.

    A critical mistake is optimizing solely for the lowest hourly rate. A senior consultant at a higher rate who correctly architects and automates your infrastructure in one month provides far greater value than a junior consultant who takes three months and introduces technical debt. Evaluate based on total cost of ownership and project velocity.

    How Do You Handle Security and Access to Our Systems?

    Security must be paramount. A request for root or administrative credentials on day one is a major red flag. A professional firm will adhere strictly to the principle of least privilege.

    A secure access protocol involves:

    1. Dedicated IAM Roles: The consultant will provide specifications for you to create custom IAM (Identity and Access Management) roles with narrowly scoped permissions. Initial access is often read-only, with permissions escalated as needed for specific tasks.
    2. No Shared Credentials, Ever: Each consultant must be provisioned with a unique, named account tied to their identity. This is fundamental for accountability and auditability.
    3. Secure Secret Management: They will advocate for and use a dedicated secrets management solution like HashiCorp Vault or a cloud-native service (e.g., AWS Secrets Manager). Credentials, API keys, and certificates must never be hardcoded or stored in Git.

    What Happens After the Engagement Ends?

    A primary objective of a top-tier DevOps consultant is to make themselves redundant. The goal is to build robust systems and upskill your team, not to create a long-term dependency.

    A professional offboarding process must include:

    • Thorough Documentation: While Infrastructure as Code (Terraform, etc.) is largely self-documenting, the consultant must also provide high-level architecture diagrams, decision logs, and operational runbooks for incident response and routine maintenance.
    • Knowledge Transfer Sessions: The consultants should conduct technical walkthroughs and pair-programming sessions with your engineers. The objective is to transfer not just the "how" (operational procedures) but also the "why" (the architectural reasoning behind key decisions).
    • Ongoing Support Options: Many firms offer a post-engagement retainer for a block of hours. This provides a valuable safety net for ad-hoc support as your team assumes full ownership.

    This focus on empowerment is what distinguishes a true strategic partner from a temporary contractor. The ultimate success is when your internal team can confidently operate, maintain, and evolve the systems the consultants helped build.


    Ready to accelerate your software delivery with proven expertise? At OpsMoon, we connect you with the top 0.7% of global DevOps talent. Start with a free work planning session to map your roadmap to success. Find your expert today.

  • 10 Actionable GitOps Best Practices for 2025

    10 Actionable GitOps Best Practices for 2025

    GitOps has evolved from a novel concept to a foundational methodology for modern software delivery. By establishing Git as the single source of truth for declarative infrastructure and applications, teams can achieve unprecedented velocity, reliability, and security. However, adopting GitOps effectively requires more than just connecting a Git repository to a Kubernetes cluster. It demands a disciplined, engineering-focused approach grounded in proven principles and robust operational patterns. Transitioning to a fully realized GitOps workflow involves a significant shift in how teams manage configuration, security, and deployment lifecycles.

    This guide moves beyond the basics to provide a thorough, actionable roundup of GitOps best practices. Each point is designed to help you build a resilient, scalable, and secure operational framework that stands up to production demands. We will dive deep into specific implementation details, covering everything from advanced Git branching strategies and secrets management to automated reconciliation and progressive delivery techniques.

    You will learn how to:

    • Structure your repositories for complex, multi-environment deployments.
    • Integrate security and policy-as-code directly into your Git workflow.
    • Implement comprehensive observability to monitor system state and detect drift.
    • Securely manage secrets without compromising the declarative model.

    Whether you're a startup CTO designing a greenfield platform or an enterprise SRE refining a complex system, mastering these practices is crucial for unlocking the full potential of GitOps. This listicle provides the technical depth and practical examples needed to transform your theoretical understanding into a high-performing reality, ensuring your infrastructure is as auditable, versioned, and reliable as your application code.

    1. Version Control as the Single Source of Truth

    At the core of GitOps is the non-negotiable principle that your Git repository serves as the definitive, authoritative source for all infrastructure and application configurations. This means the entire desired state of your system, from Kubernetes manifests and Helm charts to Terraform modules and Ansible playbooks, lives declaratively within version control. Every modification, from a container image tag update to a change in network policy, must be represented as a commit to Git.

    This approach transforms your infrastructure into a version-controlled, auditable, and reproducible asset. Instead of making direct, imperative changes to a running environment via kubectl apply -f or manual cloud console clicks, developers and operators commit declarative configuration files. A GitOps agent, such as Argo CD or Flux, continuously monitors the repository and automatically synchronizes the live environment to match the state defined in Git. This creates a powerful, self-healing closed-loop system where git push becomes the universal deployment trigger.

    Why This is a Core GitOps Practice

    Adopting Git as the single source of truth (SSoT) provides immense operational benefits. It eliminates configuration drift, where the actual state of your infrastructure diverges from its intended configuration over time. This principle is fundamental to achieving high levels of automation and reliability. Major tech companies like Adobe and Intuit have built their robust CI/CD pipelines around this very concept, using tools like Argo CD to manage complex application deployments across numerous clusters, all driven from Git.

    Actionable Implementation Tips

    • Segregate Environments with Branches: Use a Git branching strategy to manage different environments. For example, a develop branch for staging, a release branch for pre-production, and the main branch for production. A change is promoted by opening a pull request from develop to release.
    • Implement Branch Protection: Protect your main or production branches with rules that require pull request reviews and passing status checks from CI jobs (e.g., linting, static analysis). In GitHub, this can be configured under Settings > Branches > Branch protection rules.
    • Maintain a Clear Directory Structure: Organize your repository logically. A common pattern is to structure directories by environment, application, or service. A monorepo for manifests might look like: apps/production/app-one/deployment.yaml.
    • Audit Your Git History: Regularly review the commit history. It serves as a perfect audit log, showing who changed what, when, and why. Use git log --graph --oneline to visualize the history. This is invaluable for compliance and incident post-mortems. A deep understanding of Git is crucial here; for a deeper dive into managing repositories effectively, a good Git Integration Guide can provide foundational knowledge for your team.

    For teams looking to refine their repository management, you can learn more about version control best practices to ensure your Git strategy is robust and scalable.

    2. Declarative Infrastructure and Application Configuration

    GitOps shifts the paradigm from imperative commands to declarative configurations. Instead of manually running commands like kubectl create deployment or aws ec2 run-instances, you define the desired state of your system in configuration files. These files, typically written in formats like YAML for Kubernetes, HCL for Terraform, or JSON, describe what the final state should look like, not how to get there.

    Hand-drawn diagram showing a workflow with YAML, Declaraiak, and a final document with directional arrows.

    A GitOps agent continuously compares this declared state in Git with the actual state of the live environment. If a discrepancy, or "drift," is detected, the agent's controller loop automatically takes action to reconcile the system, ensuring it always converges to the configuration committed in the repository. This declarative approach makes your system state predictable, repeatable, and transparent, as the entire configuration is codified and versioned.

    Why This is a Core GitOps Practice

    The declarative model is fundamental to automation and consistency at scale. It eliminates manual, error-prone changes and provides a clear, auditable trail of every modification to your system's desired state. Companies leveraging Kubernetes heavily rely on declarative manifests to manage complex microservices architectures. Similarly, using Terraform with HCL to define cloud infrastructure declaratively ensures that environments can be provisioned and replicated with perfect consistency, a key goal for any robust GitOps workflow.

    Actionable Implementation Tips

    • Use Templating to Reduce Duplication: Employ tools like Helm or Kustomize for Kubernetes. For example, with Kustomize, you can define a base configuration and then apply environment-specific overlays that patch the base, keeping your codebase DRY (Don't Repeat Yourself).
    • Validate Configurations Pre-Merge: Integrate static analysis and validation tools like kubeval or conftest into your CI pipeline. A GitHub Actions step could be: run: kubeval my-app/*.yaml. This ensures that pull requests are checked for syntactical correctness and policy compliance before they are ever merged into a target branch.
    • Document Intent in Commit Messages: Your commit messages should clearly explain the why behind a configuration change, not just the what. Follow a convention like Conventional Commits (e.g., feat(api): increase deployment replicas to 3 for HA).
    • Enforce Standards with Policy-as-Code: Use tools like Open Policy Agent (OPA) or Kyverno to enforce organizational standards (e.g., all deployments must have owner labels) and security policies (e.g., disallow containers running as root) directly on your declarative configurations.

    To effectively implement declarative infrastructure and application configuration within a GitOps framework, adhering to established principles is critical. You can explore a detailed guide that outlines 10 Infrastructure as Code Best Practices to build a solid foundation.

    For more information on declarative approaches, you can learn more about Infrastructure as Code best practices to further strengthen your GitOps implementation.

    3. Automated Continuous Deployment via Pull Requests

    In a GitOps workflow, the pull request (PR) or merge request (MR) is elevated from a simple code review mechanism to the central gateway for all system changes. This practice treats every modification, from an application update to an infrastructure tweak, as a proposal that must be reviewed, validated, and approved before it can impact a live environment. Once a PR is merged into the designated environment branch (e.g., main), an automated process triggers the deployment, synchronizing the live state with the new desired state in Git.

    This model creates a robust, auditable, and collaborative change management process. Instead of manual handoffs or direct environment access, changes are proposed declaratively and vetted through a transparent, automated pipeline. A GitOps operator like Flux or Argo CD observes the merge event and orchestrates the deployment, ensuring that the only path to production is through a peer-reviewed and automatically verified pull request. The flow is: PR -> CI Checks Pass -> Review/Approval -> Merge -> GitOps Sync.

    Why This is a Core GitOps Practice

    Automating deployments via pull requests is a cornerstone of effective GitOps because it codifies the change control process directly into the development workflow. It enforces peer review, automated testing, and policy checks before any change is accepted, dramatically reducing the risk of human error and configuration drift. This approach is heavily promoted by platforms like GitHub and GitLab, where merge request pipelines are integral to their CI/CD offerings, enabling teams to build secure and efficient delivery cycles. The entire process becomes a self-documenting log of every change made to the system.

    Actionable Implementation Tips

    • Implement Branch Protection Rules: Secure your environment branches (e.g., main, staging) by requiring status checks to pass and at least one approving review before a PR can be merged. This is a critical security and stability measure configurable in your Git provider.
    • Use PR Templates and CODEOWNERS: Create standardized pull request templates (.github/pull_request_template.md) to ensure every change proposal includes context, like a summary and rollback plan. Use a .github/CODEOWNERS file to automatically assign relevant teams or individuals as reviewers based on the files changed.
    • Establish Clear PR Review SLAs: Define and communicate Service Level Agreements (SLAs) for PR review and merge times. This prevents pull requests from becoming bottlenecks and maintains deployment velocity. A common SLA is a 4-hour review window during business hours.
    • Leverage Semantic PR Titles: Adopt a convention for PR titles (e.g., feat:, fix:, chore:) to enable automated changelog generation and provide a clear, scannable history of deployments. Tools like semantic-release can leverage this.

    For teams aiming to perfect this flow, understanding how it fits into the larger delivery system is key. You can discover more by exploring advanced CI/CD pipeline best practices to fully optimize your automated workflows.

    4. Continuous Reconciliation and Drift Detection

    A core tenet of GitOps is that your live environment must perpetually mirror the desired state defined in your Git repository. Continuous reconciliation is the automated process that enforces this principle. A GitOps operator, or agent, runs a control loop that constantly compares the actual state of your running infrastructure against the declarative configurations in Git. When a discrepancy, known as "drift," is detected, the agent automatically takes corrective action to realign the live state with the source of truth.

    This self-healing loop is what makes GitOps so resilient. If an engineer makes a manual, out-of-band change using kubectl edit deployment or a cloud console, the GitOps operator identifies this deviation. It can then either revert the change automatically or alert the team to the unauthorized modification. This mechanism is crucial for preventing the slow, silent accumulation of unmanaged changes that can lead to system instability and security vulnerabilities.

    Hand-drawn diagram illustrating a continuous reconciliation process between cloud and an on-premise application.

    Why This is a Core GitOps Practice

    Continuous reconciliation is the enforcement engine of GitOps. Without it, the "single source of truth" in Git is merely a suggestion, not a guarantee. This automated oversight prevents configuration drift, ensuring system predictability and reliability. Tools like Flux CD and Argo CD have popularized this model, with Argo CD's OutOfSync status providing immediate visual feedback when drift occurs. This practice turns your infrastructure management from a reactive, manual task into a proactive, automated one, which is a key element of modern GitOps best practices.

    Actionable Implementation Tips

    • Configure Reconciliation Intervals: Tune the sync frequency based on environment criticality. For Argo CD, this is the timeout.reconciliation setting, which defaults to 180 seconds. A production environment might require a check every 3 minutes, while a development cluster could be set to 15 minutes.
    • Implement Drift Detection Alerts: Don't rely solely on auto-remediation. Configure your GitOps tool to send alerts to Slack or PagerDuty the moment drift is detected. Argo CD Notifications and Flux Notification Controller can be configured to trigger alerts when a resource's health status changes to OutOfSync.
    • Use Sync Windows for Critical Changes: For sensitive applications, you can configure sync windows to ensure that automated reconciliations only occur during specific, low-impact maintenance periods, preventing unexpected changes during peak business hours.
    • Audit and Document Manual Overrides: If a manual change is ever necessary for an emergency fix (the "break-glass" procedure), it must be temporary. The process must require opening a high-priority pull request to reflect that change in Git, thus restoring the declarative state and closing the loop.

    5. Git Branch Strategy and Environment Management

    A robust Git branching strategy is the backbone of a successful GitOps workflow, providing a structured and predictable path for promoting changes across different environments. Instead of a single, chaotic repository, this practice dictates using distinct branches to represent the desired state of each environment, such as development, staging, and production. This segregation ensures that experimental changes in a development environment do not accidentally impact the stability of production.

    The promotion process becomes a deliberate, version-controlled action. To move a feature from staging to production, you create a pull request to merge the changes from the staging branch into the production branch. This triggers code reviews, automated tests, and policy checks, creating a secure and auditable promotion pipeline. This "environment-per-branch" model is a foundational pattern in GitOps.

    Why This is a Core GitOps Practice

    This practice brings order and safety to the continuous delivery process, preventing the common pitfall of configuration mismatches between environments. By formalizing the promotion workflow through Git, you create an explicit, reviewable, and reversible process for every change. Major organizations, including those advocating for Trunk-Based Development like Google, rely on disciplined branch management (or feature flags) to maintain high velocity without sacrificing stability. This structured approach is critical for managing system complexity as applications and teams scale.

    Actionable Implementation Tips

    • Choose a Suitable Model: Select a branching strategy that fits your team's workflow. GitFlow is excellent for projects with scheduled releases. Trunk-Based Development is ideal for high-velocity teams, often using feature flags within the configuration itself to control rollouts.
    • Use Kustomize Overlays or Helm Values: Manage environment-specific configurations without duplicating code. Use tools like Kustomize with overlays for each environment (/base, /overlays/staging, /overlays/production) or Helm with different values.yaml files (values-staging.yaml, values-prod.yaml) to handle variations in replicas, resource limits, or endpoints.
    • Automate Environment Sync: Configure your GitOps agent (e.g., Argo CD, Flux) to track specific branches for each environment. An Argo CD Application manifest for production would specify targetRevision: main, while the staging Application would point to targetRevision: staging.
    • Establish Clear Promotion Criteria: Document the exact requirements for merging between environment branches. This should include mandatory peer reviews, passing all automated tests (integration, E2E), and satisfying security scans. Automate these checks as status requirements for your PRs.

    6. Secrets Management and Security

    A core challenge in GitOps is managing sensitive data like API keys, database credentials, and certificates. Since the Git repository is the single source of truth for all configurations, storing secrets in plaintext is a critical security vulnerability. Therefore, a robust secrets management strategy is not just a recommendation; it is an absolute requirement. The principle is to commit encrypted secrets (or references to secrets) to Git, and decrypt them only within the target cluster where they are needed.

    Hand-drawn illustration of organized documents on a clipboard and an abstract block object.

    This approach ensures that your version-controlled configurations remain comprehensive without exposing credentials. The "sealed secrets" pattern maintains the declarative model while upholding strict security boundaries. Developers can define the intent of a secret (its name and keys) without ever accessing the unencrypted values, which are managed by a separate, more secure process or system.

    Why This is a Core GitOps Practice

    Integrating secure secrets management directly into the GitOps workflow prevents security anti-patterns and data breaches. Storing encrypted secrets alongside their corresponding application configurations keeps the entire system state declarative and auditable. Tools like Bitnami's Sealed Secrets and Mozilla's SOPS were created specifically to address this challenge in a Kubernetes-native way. By encrypting secrets before they are ever committed, organizations can safely use Git as the source of truth for everything, including sensitive information, without compromising security.

    Actionable Implementation Tips

    • Implement a Sealed Secrets Pattern: Use a tool like Sealed Secrets, which encrypts a standard Kubernetes Secret into a SealedSecret custom resource. This encrypted resource is safe to commit to Git, and only the controller running in your cluster can decrypt it using a private key.
    • Leverage External Secret Managers: Integrate with a dedicated secrets management solution using an operator like External Secrets Operator (ESO). Your declarative manifests in Git contain a reference (ExternalSecret resource) to a secret stored in HashiCorp Vault, AWS Secrets Manager, or Azure Key Vault. ESO fetches the secret at runtime and creates a native Kubernetes Secret.
    • Use File-Level Encryption: Employ a tool like Mozilla SOPS (Secrets OPerationS) to encrypt values within YAML or JSON files. This allows you to commit configuration files where only the sensitive fields are encrypted, making pull requests easier to review. SOPS integrates with KMS providers like AWS KMS or GCP KMS for key management.
    • Scan for Leaked Secrets: Integrate automated secret scanning tools like git-secrets or TruffleHog into your CI pipeline as a pre-merge check. These tools will fail a build if they detect any unencrypted secrets being committed, acting as a crucial security gate.

    7. Automated Testing and Validation in CI/CD Pipeline

    A GitOps workflow is only as reliable as the quality of the code committed to the repository. Therefore, integrating automated testing and validation directly into the CI/CD pipeline is a critical practice. This principle mandates that before any configuration change is merged, it must pass a rigorous gauntlet of automated checks. These checks ensure that the configuration is not only syntactically correct but also compliant with security policies, operational standards, and functional requirements.

    This process shifts quality control left, catching potential issues like misconfigurations, security vulnerabilities, or policy violations early. When a developer opens a pull request with a change to a Kubernetes manifest or a Terraform file, the CI pipeline automatically triggers a series of validation jobs. For example, terraform validate and a policy check with conftest. Only if all checks pass can the change be merged and subsequently synchronized by the GitOps agent.

    Why This is a Core GitOps Practice

    Automated validation is the safety net that makes GitOps a trustworthy and scalable operational model. It builds confidence in the automation process by systematically preventing human error and enforcing organizational standards. This practice is a cornerstone of the DevSecOps movement, embedding security and compliance directly into the delivery pipeline. For example, organizations use tools like Conftest to test structured configuration data against custom policies written in Rego, ensuring every change adheres to specific business rules before deployment.

    Actionable Implementation Tips

    • Implement Multiple Validation Layers: Create a multi-stage validation process in CI. Start with basic linting (helm lint), then schema validation (kubeval), followed by security scanning on container images (Trivy), and finally, policy-as-code checks (conftest against Rego policies).
    • Fail Fast with Pre-Commit Hooks: Empower developers to catch errors locally before pushing code. Use pre-commit hooks (managed via the pre-commit framework) to run lightweight linters and formatters, providing immediate feedback and reducing CI pipeline load.
    • Keep Validation Rules in Git: Store your validation policies (e.g., Rego policies for Conftest) in a dedicated Git repository. This treats your policies as code, making them version-controlled, auditable, and easily reusable across different pipelines.
    • Generate terraform plan in CI: For infrastructure changes, always run terraform validate and terraform plan within the pull request automation. Use tools like infracost to estimate cost changes and post the plan's output and cost estimate as a comment on the PR for thorough peer review.

    8. Observability and Monitoring of GitOps Systems

    To fully trust an automated GitOps workflow, you need deep visibility into its operations. Observability is not an afterthought but a critical component that provides insight into the health, performance, and history of your automated processes. This involves actively monitoring the reconciliation status of your GitOps agent, tracking deployment history, alerting on synchronization failures, and maintaining a clear view of what changes were deployed, when, and by whom.

    This practice extends beyond simple pass/fail metrics. It involves creating a rich, contextualized view of the entire delivery pipeline. GitOps tools like Argo CD and Flux CD are designed with observability in mind, exposing detailed Prometheus metrics about reconciliation loops (flux_reconcile_duration_seconds, argocd_app_sync_total), sync statuses, and deployment health. This data is the foundation for building a trustworthy, automated system.

    Why This is a Core GitOps Practice

    Without robust monitoring, a GitOps system is a black box. You cannot confidently delegate control to an automated agent if you cannot verify its actions or diagnose failures. Comprehensive observability builds trust, speeds up incident response, and provides the data needed to optimize deployment frequency and stability. Companies operating at scale rely on this visibility to manage fleets of clusters; a GitOps agent's Prometheus metrics can feed into a centralized Grafana dashboard, giving operations teams a single pane of glass to monitor deployments across the entire organization.

    Actionable Implementation Tips

    • Expose and Scrape Agent Metrics: Configure your GitOps agent (e.g., Flux or Argo CD) to expose its built-in Prometheus metrics. Use a Prometheus ServiceMonitor to automatically discover and scrape these endpoints.
    • Create GitOps-Specific Dashboards: Build dedicated dashboards in Grafana. Visualize key performance indicators (KPIs) like deployment frequency, lead time for changes, and mean time to recovery (MTTR). Track the health of Flux Kustomizations or Argo CD Applications over time.
    • Implement Proactive Alerting: Set up alerts in Alertmanager for critical failure conditions. A key alert is for a persistent OutOfSync status, which can be queried with PromQL: argocd_app_info{sync_status="OutOfSync"} == 1. Also, alert on failed reconciliation attempts.
    • Correlate Deployments with Application Metrics: Integrate your GitOps monitoring with application performance monitoring (APM) tools. Use Grafana annotations to mark deployment events (triggered by a Git commit) on graphs showing application error rates or latency, drastically reducing the time it takes to identify the root cause of an issue.

    9. Multi-Tenancy and Access Control

    As GitOps adoption scales across an organization, managing deployments for multiple teams, projects, or customers within a shared infrastructure becomes a critical challenge. A robust multi-tenancy and access control strategy ensures that tenants operate in isolated, secure environments. This involves partitioning both the Git repositories and the Kubernetes clusters to enforce strict boundaries using Role-Based Access Control (RBAC).

    The core idea is to map organizational structures to technical controls. In this model, each team has designated areas within Git and the cluster where they have permission to operate. A GitOps agent, configured for multi-tenancy, respects these boundaries. For example, Argo CD's AppProject custom resource allows administrators to define which repositories a team can deploy from, which cluster destinations are permitted, and what types of resources they are allowed to create, effectively sandboxing their operations.

    Why This is a Core GitOps Practice

    Implementing strong multi-tenancy is fundamental for scaling GitOps securely in an enterprise context. It prevents configuration conflicts, unauthorized access, and resource contention. This practice enables platform teams to offer a self-service deployment experience while maintaining centralized governance and control, a key reason why it is one of the most important gitops best practices for larger organizations. Companies managing complex microservices architectures rely on this to empower dozens of developer teams to deploy independently and safely.

    Actionable Implementation Tips

    • Define Clear Tenant Boundaries: Use Kubernetes namespaces as the primary isolation mechanism for each team or application. This provides a scope for naming, policies, and ResourceQuotas.
    • Implement Least Privilege with RBAC: Create a specific Kubernetes ServiceAccount for each team's GitOps agent instance (e.g., an Argo CD Application or a Flux Kustomization). Bind this ServiceAccount to a Role (not a ClusterRole) that grants permissions only within the team's designated namespace.
    • Segregate Repositories or Paths: Structure your Git repositories to reflect your tenancy model. You can either provide each team with its own repository or assign them specific directories within a shared monorepo. Use .github/CODEOWNERS files to restrict who can approve changes for specific paths.
    • Leverage GitOps Tooling Features: Use tenant-aware features like Argo CD's AppProject or Flux CD's multi-tenancy configurations with ServiceAccount impersonation. These tools are designed to enforce access control policies, ensuring that a team's agent cannot deploy applications outside of its authorized scope.
    • Conduct Regular Access Audits: Periodically review both your Git repository permissions and your Kubernetes RBAC policies using tools like rbac-lookup or krane. This ensures that permissions have not become overly permissive over time.

    10. Progressive Delivery and Deployment Strategies

    GitOps provides the perfect foundation for advanced, risk-mitigating deployment techniques. Instead of traditional "big bang" releases, progressive delivery strategies roll out changes to a small subset of users or infrastructure first. This approach minimizes the blast radius of potential issues, allowing teams to validate new versions in a live production environment with real traffic before a full-scale deployment.

    The declarative nature of GitOps is key to this process. A change to a deployment strategy, such as initiating a canary release, is simply a commit to a Git repository. A GitOps-aware controller like Argo Rollouts or Flagger detects this change and orchestrates the complex steps involved, such as provisioning the new version, gradually shifting traffic via a service mesh or ingress controller, and analyzing metrics. This automates what was once a highly manual and error-prone process.

    Why This is a Core GitOps Practice

    This practice transforms deployments from a source of anxiety into a controlled, observable, and data-driven process. By automatically analyzing key performance indicators (KPIs) like error rates and latency during a rollout, the system can autonomously decide whether to proceed or automatically roll back. This powerful automation is central to the GitOps philosophy of a reliable, self-healing system. The Argo Rollouts and Flagger projects have been instrumental in popularizing these advanced deployment controllers within the Kubernetes ecosystem.

    Actionable Implementation Tips

    • Define Clear Success Metrics: Before a canary deployment, define what success looks like as Service Level Objectives (SLOs) in your rollout manifest. This involves setting thresholds for metrics like request success rate (>99%) or P99 latency (<500ms). Flagger and Argo Rollouts can query Prometheus to validate these metrics automatically.
    • Start with a Small Blast Radius: Begin canary releases by shifting a very small percentage of traffic, such as 1% or 5%, to the new version. In an Argo Rollouts manifest, this is configured in the steps array (e.g., { setWeight: 5 }).
    • Automate Rollback Decisions: Configure your deployment tool to automatically roll back if the defined success metrics are not met. This removes human delay from the incident response process and is a critical component of a robust progressive delivery pipeline.
    • Integrate with a Service Mesh: For fine-grained traffic control, integrate your progressive delivery controller with a service mesh like Istio or Linkerd. The controller can manipulate the mesh's traffic routing resources (e.g., Istio VirtualService) to precisely shift traffic and perform advanced rollouts based on HTTP headers.

    10-Point GitOps Best Practices Comparison

    Item Implementation complexity Resource requirements Expected outcomes Ideal use cases Key advantages
    Version Control as the Single Source of Truth Medium–High: repo design and process discipline Git hosting, CI hooks, access controls Reproducible, auditable system state; easy rollback Teams needing auditability, reproducibility, disaster recovery Full visibility, rollback, collaboration via Git workflows
    Declarative Infrastructure and Application Configuration Medium: learn declarative syntax and templates IaC tools (Terraform, Helm, Kustomize), template libraries Consistent, declarable desired state; reduced drift Infrastructure-as-Code, multi-environment parity Predictable changes, reviewable configs, automated reconciliation
    Automated Continuous Deployment via Pull Requests Medium: PR workflows and CI/CD integration CI pipelines, code review tools, branch protection Reviewed, tested deployments triggered by merges Controlled change delivery with audit trail Mandatory human review, documented rationale, automation on merge
    Continuous Reconciliation and Drift Detection Medium: operator setup and tuning GitOps operators (Argo/Flux), monitoring, alerting Self-healing clusters, immediate detection and correction of drift Environments susceptible to manual changes or drift Automatic drift correction, improved state consistency
    Git Branch Strategy and Environment Management Medium: policy definition and branch hygiene Branching workflows, overlays (Kustomize/Helm), CI pipelines Clear promotion paths and environment isolation Multi-env deployments requiring staged promotion Prevents accidental prod changes, simplifies rollbacks per env
    Secrets Management and Security High: secure tooling, policies and operational practices Secret managers (Vault, SOPS), encryption, RBAC Encrypted secrets, compliance readiness, reduced leakage risk Any system handling credentials or sensitive data Centralized secrets, auditability, reduced accidental exposure
    Automated Testing and Validation in CI/CD Pipeline Medium–High: test matrix and ongoing maintenance Linters, scanners (Trivy), policy tools, test runners Fewer configuration errors, enforced standards before deploy High-risk or regulated deployments, security-conscious teams Early error/security detection, standardized validation gates
    Observability and Monitoring of GitOps Systems Medium: metrics, dashboards and alert tuning Monitoring stack (Prometheus/Grafana), logging, alerting Visibility into sync status, faster issue detection, audit trail Ops teams tracking reconciliation and deployment health Correlates Git changes with system behavior; faster troubleshooting
    Multi-Tenancy and Access Control High: RBAC design and tenant isolation planning Namespace/repo segregation, RBAC, AppProject or equivalent Scoped deployments per team, safer multi-team operations Large organizations, SaaS platforms, managed clusters Least-privilege access, tenant separation, auditability
    Progressive Delivery and Deployment Strategies High: orchestration, metrics and traffic control Rollout tools (Argo Rollouts, Flagger), service mesh, metrics Gradual rollouts with automated rollback on failure Risk-averse releases, large-scale user-facing services Reduced blast radius, controlled rollouts, metric-driven rollback

    From Principles to Practice: Your GitOps Roadmap

    Adopting GitOps is more than a technical upgrade; it's a fundamental shift in how development and operations teams collaborate to deliver software. Throughout this guide, we've explored ten critical GitOps best practices that form the pillars of a modern, automated, and resilient delivery pipeline. From establishing Git as the immutable single source of truth to implementing sophisticated progressive delivery strategies, each practice builds upon the last, creating a powerful, interconnected system for managing infrastructure and applications.

    The journey begins with the core principles: using declarative configurations to define your desired state and leveraging pull requests as the exclusive mechanism for change. This simple yet profound workflow immediately introduces a level of auditability, version control, and collaboration that is impossible to achieve with traditional, imperative methods. Mastering your Git branching strategy, such as GitFlow or environment-per-branch models, directly translates these principles into a tangible, multi-environment reality, allowing teams to manage development, staging, and production with clarity and confidence.

    Synthesizing Your GitOps Strategy

    As you move beyond the basics, the true power of GitOps becomes apparent. Integrating robust secrets management with tools like HashiCorp Vault or Sealed Secrets ensures that sensitive data is never exposed in your Git repository. Similarly, embedding automated testing, static analysis, and policy-as-code checks directly into your CI pipeline acts as a crucial quality gate, preventing flawed or non-compliant configurations from ever reaching your clusters. These security and validation layers are not optional add-ons; they are essential components of a mature GitOps practice.

    The operational aspects are just as critical. A GitOps system without comprehensive observability is a black box. Implementing robust monitoring and alerting for your GitOps agents (like Argo CD or Flux), control planes, and application health provides the necessary feedback loop to diagnose issues and validate the success of deployments. This constant reconciliation and drift detection, managed by the GitOps operator, is the engine that guarantees your live environment consistently mirrors the desired state defined in Git, providing an unparalleled level of stability and predictability.

    Actionable Next Steps on Your GitOps Journey

    To turn these principles into practice, your team should focus on an incremental adoption roadmap. Don't attempt to implement all ten best practices at once. Instead, create a phased approach that delivers tangible value at each stage.

    1. Establish the Foundation (Weeks 1-4):

      • Select your GitOps tool: Choose between Argo CD or Flux based on your ecosystem and team preferences.
      • Structure your repositories: Define a clear layout for your application manifests and infrastructure configurations. A common pattern is a monorepo with apps/, clusters/, and infra/ directories.
      • Automate your first application: Start with a single, non-critical application. Configure your CI pipeline to build an image and update a manifest using a tool like kustomize edit set image, and configure your GitOps agent to sync it to a development cluster. This initial success will build crucial momentum.
    2. Enhance Security and Quality (Weeks 5-8):

      • Integrate a secrets management solution: Abstract your secrets away from your Git repository using a tool like the External Secrets Operator.
      • Implement policy-as-code: Introduce OPA Gatekeeper or Kyverno to enforce basic policies, such as requiring resource labels or disallowing privileged containers.
      • Add automated validation: Integrate manifest validation tools like kubeval or conftest into your CI pipeline to catch errors before they are merged.
    3. Scale and Optimize (Weeks 9-12+):

      • Implement progressive delivery: Use a tool like Argo Rollouts or Flagger to introduce canary or blue-green deployment strategies for critical applications.
      • Refine observability: Build dashboards in Grafana or your observability platform of choice to monitor sync status, reconciliation latency, and application health metrics tied directly to deployments.
      • Define RBAC and multi-tenancy models: Solidify access control to ensure different teams can operate safely within shared clusters, aligning permissions with your Git repository's access controls.

    Mastering these GitOps best practices transforms your delivery process from a series of manual, error-prone tasks into a streamlined, automated, and secure workflow. It empowers developers with self-service capabilities while providing operations with the control and visibility needed to maintain stability at scale. The result is a more resilient, efficient, and innovative engineering organization.


    Navigating the complexities of GitOps adoption, from tool selection to advanced security implementation, requires specialized expertise. OpsMoon connects you with a global network of elite, pre-vetted DevOps and SRE freelancers who are masters of these best practices. Start with a free work planning session to build a precise roadmap and get matched with the perfect expert to accelerate your GitOps journey today.

    Build Your World-Class GitOps Practice with an OpsMoon Expert

  • A Developer’s Guide to Software Deployment Strategies

    A Developer’s Guide to Software Deployment Strategies

    Software deployment strategies are frameworks for releasing new code into a production environment. The primary objective is to deliver new features and bug fixes to end-users with minimal disruption and risk. These methodologies range from monolithic, "big bang" updates to sophisticated, gradual rollouts, each presenting a different balance between release velocity and system stability.

    From Code Commit to Customer Value

    The methodology chosen for software deployment directly impacts application reliability, team velocity, and end-user experience. It is the final, critical step in the CI/CD pipeline that transforms version-controlled code into tangible value for the customer.

    A well-executed strategy results in minimal downtime, a reduced blast radius for bugs, and increased developer confidence. This process is a cornerstone of the software release life cycle and is fundamental to establishing a high-performing engineering culture.

    This guide provides a technical deep-dive into modern deployment patterns, focusing on the mechanics, architectural prerequisites, and operational trade-offs of each. These strategies are not rigid prescriptions but rather a toolkit of engineering patterns, each suited for specific technical and business contexts.

    First, let's establish a high-level overview.

    A simple hand-drawn diagram illustrating a software deployment process flow with a document, a growing plant, a cloud, and a user.

    Quick Guide to Modern Deployment Strategies

    This table serves as a technical cheat sheet for common deployment strategies. It outlines the core mechanism, ideal technical use case, and associated risk profile for each. Use this as a reference before we dissect the implementation details of each method.

    Strategy Core Mechanic Ideal Use Case Risk Profile
    Blue-Green Two identical, isolated production environments; traffic is atomically switched from the old ("blue") to the new ("green") via a router or load balancer. Critical applications with zero tolerance for downtime and requiring instantaneous, full-stack rollback. Low
    Rolling The new version incrementally replaces old instances, one by one or in batches, until the entire service is updated. Stateful applications or monolithic systems where duplicating infrastructure is cost-prohibitive. Medium
    Canary The new version is exposed to a small subset of production traffic; if key SLIs/SLOs are met, traffic is gradually increased. Validating new features or performance characteristics with real-world traffic before a full rollout. Low
    A/B Testing Multiple versions (variants) are deployed simultaneously; traffic is routed to variants based on specific attributes (e.g., HTTP headers, user ID) to compare business metrics. Data-driven validation of features by measuring user behavior and business outcomes (e.g., conversion rate). Low
    Feature Flag New code is deployed "dark" (inactive) within the application logic and can be dynamically enabled/disabled for specific user segments without a redeployment. Decoupling code deployment from feature release, enabling trunk-based development and progressive delivery. Very Low

    This provides a foundational understanding. Now, let's examine the technical implementation of each strategy.

    Mastering Foundational Deployment Strategies

    To effectively manage a release process, a deep understanding of the mechanics of foundational software deployment strategies is essential. These patterns are the building blocks for nearly all modern, complex release workflows. We will now analyze the technical implementation, advantages, and disadvantages of four core strategies.

    Diagram illustrating four core software deployment models: Blue Green, Rolling, Canary, and A/B testing.

    Blue-Green Deployment: The Instant Switch

    In a Blue-Green deployment, two identical but separate production environments are maintained: "Blue" (the current version) and "Green" (the new version). Live traffic is initially directed entirely to the Blue environment. The new version of the application is deployed and fully tested in the Green environment, which is isolated from live user traffic but connected to the same production databases and downstream services.

    Once the Green environment passes all automated health checks and QA validation, the router or load balancer is reconfigured to atomically switch 100% of traffic from Blue to Green. The Blue environment is kept on standby as an immediate rollback target.

    Technical Implementation Example (Pseudo-code for a load balancer config):

    # Initial State
    backend blue_servers { server host1:80; server host2:80; }
    backend green_servers { server host3:80; server host4:80; }
    frontend main_app { bind *:80; default_backend blue_servers; }
    
    # After successful Green deployment & testing
    # Change one line to switch traffic
    frontend main_app { bind *:80; default_backend green_servers; }
    

    Key Takeaway: The Blue-Green strategy minimizes downtime and provides a near-instantaneous rollback mechanism. If post-release monitoring detects issues in Green, traffic is simply rerouted back to the stable Blue environment, which was never taken offline.

    Pros of Blue-Green:

    • Near-Zero Downtime: The traffic cutover is an atomic operation, making the transition seamless for users.
    • Instant Rollback: The old, stable Blue environment remains active, enabling immediate reversion by reconfiguring the router.
    • Reduced Risk: The Green environment can undergo a full suite of integration and smoke tests against production data sources before receiving live traffic.

    Cons of Blue-Green:

    • Infrastructure Cost: Requires maintaining double the production capacity, which can be expensive in terms of hardware or cloud resource consumption.
    • Database Schema Management: This is a major challenge. Database migrations must be backward-compatible so that both the Blue and Green versions can operate against the same schema during the transition. Alternatively, a more complex data replication and synchronization strategy is needed.

    We explore solutions to these challenges in our guide to zero downtime deployment strategies.

    Rolling Deployment: The Gradual Update

    A rolling deployment strategy updates an application by incrementally replacing instances of the old version with the new version. This is done in batches (e.g., 20% of instances at a time) or one by one. During the process, a mix of old and new versions will be running simultaneously and serving production traffic.

    For example, in a Kubernetes cluster with 10 pods running v1 of an application, a rolling update might terminate two v1 pods and create two v2 pods. The orchestrator waits for the new v2 pods to become healthy (pass readiness probes) before proceeding to the next batch. This continues until all 10 pods are running v2.

    This is the default deployment strategy in orchestrators like Kubernetes (strategy: type: RollingUpdate).

    Pros of Rolling Deployments:

    • Cost-Effective: It does not require duplicating infrastructure, as instances are replaced in-place, making it resource-efficient.
    • Simple Implementation: Natively supported by most modern orchestrators and CI/CD tools, making it the easiest strategy to implement initially.

    Cons of Rolling Deployments:

    • Slower Rollback: If a critical bug is found mid-deployment, rolling back requires initiating another rolling update to deploy the previous version, which is not instantaneous.
    • State Management: The co-existence of old and new versions can introduce compatibility issues, especially if the new version requires a different data schema or API contract from downstream services. The application must be designed to handle this state.
    • No Clean Cutover: The transition period is extended, which can complicate monitoring and debugging as traffic is served by a heterogeneous set of application versions.

    Canary Deployment: The Early Warning System

    Canary deployments follow a principle of gradual exposure. The new version of the software is initially released to a very small subset of users (the "canaries"). For example, a service mesh or ingress controller could be configured to route just 1% of production traffic to the new version (v2), while the remaining 99% continues to be served by the stable version (v1).

    Key performance indicators (KPIs) and service level indicators (SLIs)—such as error rates, latency, and resource utilization—are closely monitored for the canary cohort. If these metrics remain within acceptable thresholds (SLOs), the traffic percentage routed to the new version is incrementally increased, from 1% to 10%, then 50%, and finally to 100%. If any metric degrades, traffic is immediately routed back to the stable version, minimizing the "blast radius" of the potential issue.

    Pros of Canary Deployments:

    • Minimal Blast Radius: Issues are detected early and impact a very small, controlled percentage of the user base.
    • Real-World Testing: Validates the new version against actual production traffic patterns and user behavior, which is impossible to fully replicate in staging.
    • Data-Driven Decisions: Promotion of the new version is based on quantitative performance metrics, not just successful test suite execution.

    Cons of Canary Deployments:

    • Complex Implementation: Requires sophisticated traffic-shaping capabilities from a service mesh like Istio or Linkerd, or an advanced ingress controller.
    • Observability is Critical: Requires a robust monitoring and alerting platform capable of segmenting metrics by application version. Without granular observability, the strategy is ineffective.

    A/B Testing: The Scientific Approach

    While often confused with Canary, A/B testing is a deployment strategy focused on comparing business outcomes, not just technical stability. It is essentially a controlled experiment conducted in production.

    In this model, two or more variants of a feature (e.g., version A with a blue button, version B with a green button) are deployed simultaneously. The router or application logic segments users based on specific criteria (e.g., geolocation, user-agent, a specific HTTP header) and directs them to a specific variant.

    The objective is not just to ensure stability, but to measure which variant performs better against a predefined business metric, such as conversion rate, click-through rate, or average session duration. The statistically significant "winner" is then rolled out to 100% of users.

    Pros of A/B Testing:

    • Data-Backed Decisions: Allows teams to validate product hypotheses with quantitative data, removing guesswork from feature development.
    • Feature Validation: Measures the actual business impact of a new feature before a full, costly launch.

    Cons of A/B Testing:

    • Engineering Overhead: Requires maintaining multiple versions of a feature in the codebase and infrastructure, which increases complexity.
    • Analytics Requirement: Demands a robust analytics pipeline to accurately track user behavior, segment data by variant, and perform statistical analysis.

    Moving Beyond the Basics: Advanced Deployment Patterns

    As architectures evolve towards microservices and cloud-native systems, foundational strategies may prove insufficient. Advanced patterns provide more granular control and enable safer testing of complex changes under real-world conditions. These techniques are standard practice for high-maturity engineering organizations.

    Feature Flag Driven Deployments

    Instead of controlling a release at the infrastructure level (via a load balancer), feature flags (or feature toggles) control it at the application code level. New code paths are wrapped in a conditional block that is controlled by a remote configuration service.

    // Example of a feature flag in code
    if (featureFlagClient.isFeatureEnabled("new-checkout-flow", userContext)) {
      // Execute the new, refactored code path
      return newCheckoutService.process(order);
    } else {
      // Execute the old, stable code path
      return legacyCheckoutService.process(order);
    }
    

    This code can be deployed to production with the flag turned "off," rendering the new logic dormant. This decouples the act of code deployment from feature release.

    Key Takeaway: Feature flags transfer release control from the CI/CD pipeline to a management dashboard, often accessible by product managers or engineers. This enables real-time toggling of features for specific user segments (e.g., beta users, users in a specific region) without requiring a new deployment.

    This transforms a release from a high-stakes deployment event into a low-risk business decision. For a detailed exploration, see our guide on feature toggle management.

    Here is an example of a feature flag management dashboard, the new control plane for releases.

    From such an interface, teams can define targeting rules, enable or disable features, and manage progressive rollouts entirely independently of the deployment schedule.

    Immutable Infrastructure

    This pattern mandates that infrastructure components (servers, containers) are never modified after they are deployed. This is often summarized by the "cattle, not pets" analogy.

    In the traditional "pets" model, a server (web-server-01) that requires an update is modified in-place via SSH, configuration management tools, or manual patching. With Immutable Infrastructure, if an update is needed, a new server image (e.g., an AMI or Docker image) is created from a base image with the new application version or patch already baked in. A new set of servers is then provisioned from this new image, and the old servers are terminated. The running infrastructure is never altered. This is a core principle behind container orchestrators like Docker and Kubernetes. Acquiring Kubernetes expertise is crucial for implementing this pattern effectively.

    Why is this so powerful?

    • Eliminates Configuration Drift: By preventing manual, ad-hoc changes to production servers, it guarantees that every environment is consistent and reproducible.
    • Simplifies Rollbacks: A rollback is not a complex "undo" operation. It is simply the act of deploying new instances from the last known-good image version.
    • High-Fidelity Testing: Since every server is an identical clone from a versioned image, testing environments are much more representative of production, reducing "works on my machine" issues.

    Shadow Deployments

    A shadow deployment, also known as traffic mirroring, involves forking production traffic to a new version of a service without impacting the live user. A service mesh or a specialized proxy duplicates incoming requests: one copy is sent to the stable, live service, and a second copy is sent to the new "shadow" version.

    The end user only ever receives the response from the stable version. The response from the shadow version is discarded or logged for analysis. This technique allows you to test the new version's performance and behavior under the full load of production traffic without any risk to the user experience. You can compare latency, resource consumption, and output correctness between the old and new versions side-by-side.

    This pattern is invaluable for:

    1. Performance Baselining: Directly compare the CPU, memory, and latency profiles of the new version against the old under identical real-world load.
    2. Validating Correctness: For critical refactors, such as a new payment processing algorithm, you can run the shadow version to ensure its results perfectly match the production version's for every single request before going live.

    Dark Launches

    A dark launch is the practice of deploying new backend functionality to production but keeping it completely inaccessible to end-users. The new code is live and executing in the production environment "in the dark," often processing real data or handling internal requests.

    For example, when replacing a recommendation engine, the new engine can be deployed to run in parallel with the old one. Both engines might process user activity data and generate recommendations, but only the old engine's results are ever surfaced in the UI. This provides the ultimate "test in production" scenario, allowing you to validate the new engine's performance, stability, and accuracy at production scale before a single user is affected. It is ideal for non-UI components like databases, caching layers, APIs, or complex backend services.

    The industry's shift towards these cloud-native deployment patterns is significant. Cloud deployments now account for 71.5% of software industry revenues and are projected to grow at a CAGR of 13.8% through 2030. This expansion is driven by the demand for scalable, resilient, and safe release methodologies. More details are available in the full software development market report.

    How to Choose Your Deployment Strategy

    Selecting an appropriate software deployment strategy is an exercise in managing trade-offs between release velocity, risk, and operational cost. The optimal choice depends on a careful analysis of your application's architecture, business requirements, and team capabilities.

    A decision matrix is a useful tool to formalize this process, forcing a systematic evaluation of each strategy against key constraints rather than relying on intuition.

    Evaluating Key Technical and Business Constraints

    A rigorous decision process begins with asking the right questions. Here are five critical criteria for evaluation:

    • Risk Tolerance: What is the business impact of a failed deployment? A bug in an internal admin tool is an inconvenience; an outage in a financial transaction processing system is a crisis. High-risk systems demand strategies with lower blast radii and faster rollback capabilities.
    • Infrastructure Cost: What is the budget for cloud or on-premise resources? Strategies like Blue-Green, which require duplicating the entire production stack, have a high operational cost compared to a resource-efficient Rolling update.
    • Rollback Complexity: What is the Mean Time To Recovery (MTTR) requirement? A Blue-Green deployment offers an MTTR of seconds via a router configuration change. A Rolling update requires a full redeployment of the old version, resulting in a much higher MTTR.
    • Observability Requirements: What is the maturity of your monitoring and alerting systems? Canary deployments are entirely dependent on granular, real-time metrics to detect performance degradations in a small user subset. Without sufficient observability, the strategy is not viable.
    • Team Maturity: Does the team possess the skills and tooling to manage advanced deployment patterns? Strategies involving service meshes, feature flagging platforms, and extensive automation require a mature DevOps culture and specialized expertise.

    If navigating these trade-offs is challenging, engaging a software engineering consultant can provide strategic guidance and technical expertise.

    This decision tree offers a simplified model for selecting a basic pattern.

    Flowchart illustrating software deployment patterns based on need for control and zero-downtime.

    As the diagram illustrates, a requirement for granular user-level control points towards feature flags, while a strict zero-downtime mandate often necessitates a Blue-Green approach.

    Making a Data-Driven Choice

    Consider a practical example: a high-frequency trading platform where seconds of downtime can result in significant financial loss. Here, the high infrastructure cost of a Blue-Green deployment is a necessary business expense to guarantee instant rollback.

    Conversely, an early-stage startup with a monolithic application and limited budget will likely find a standard Rolling update to be the most pragmatic and cost-effective choice.

    The global software market, valued at approximately USD 824 billion, shows how these choices play out at scale. On-premises deployments, which still hold the largest market share in sectors like government and finance, often favor more conservative, risk-averse deployment strategies due to security and compliance constraints.

    Key Insight: Your deployment strategy is a technical implementation of your business priorities. Select a strategy because it aligns with your specific risk profile, budget, and operational capabilities, not because of industry trends.

    Deployment Strategy Decision Matrix

    This matrix provides a structured comparison of the most common strategies against the key evaluation criteria.

    Criterion Blue-Green Rolling Canary Feature Flag
    Risk Tolerance Low (Instant rollback) Medium (Slower rollback) Very Low (Controlled exposure) Very Low (Instant off switch)
    Infra Cost High (Requires duplicate env) Low (Reuses existing nodes) Medium (Needs subset infra) Low (Code-level change)
    Rollback Complexity Very Low (Traffic switch) High (Requires redeployment) Low (Route traffic back) Very Low (Toggle off)
    Observability Medium (Compare envs) Medium (Aggregate metrics) Very High (Needs granular data) High (Needs user segmentation)
    Team Maturity Medium (Requires infra automation) Low (Basic CI/CD is enough) High (Needs advanced monitoring) Very High (Needs robust framework)

    Use this matrix to guide technical discussions and ensure that the chosen strategy is a deliberate and well-justified decision for your specific context.

    Essential Metrics for Safe Deployments

    Deploying code without robust observability is deploying blind. An effective deployment strategy is not just about the mechanics of pushing code but about verifying that the new code improves the system's health and delivers value. A tight feedback loop, driven by metrics, transforms a high-risk release into a controlled, data-informed process.

    Technical Performance Metrics

    These metrics provide an immediate signal of application and infrastructure health. They are the earliest indicators of a regression and are critical for triggering automated rollbacks.

    Your monitoring dashboards must prioritize these four signals:

    • Application Error Rates: A sudden increase in the rate of HTTP 5xx server errors or uncaught exceptions post-deployment is a primary indicator of a critical bug.
    • Request Latency: Monitor the p95 and p99 latency distributions. A regression here, even if the average latency looks stable, indicates that the slowest 5% or 1% of user requests are now slower, which directly impacts user experience.
    • Resource Utilization: Track CPU and memory usage. A gradual increase might indicate a memory leak or an inefficient algorithm, leading to performance degradation, system instability, and increased cloud costs over time.
    • Container Health: In orchestrated environments like Kubernetes, monitor container restart counts and the status of liveness and readiness probes. A high restart count is a clear sign that the new application version is unstable and repeatedly crashing.

    Establishing a clear performance baseline is non-negotiable. Automated quality gates in the CI/CD pipeline should compare post-deployment metrics against this baseline. Any significant deviation should trigger an alert or an automatic rollback.

    Business Impact Metrics

    While technical metrics confirm the system is running, business metrics confirm it is delivering value. A deployment can be technically flawless but commercially disastrous if it negatively impacts user behavior.

    Focus on metrics that reflect user interaction and business goals:

    • Conversion Rates: For an e-commerce platform, this is the percentage of sessions that result in a purchase. For a SaaS application, it could be the trial-to-paid conversion rate. A drop here signals a direct revenue impact.
    • User Engagement: Track metrics like session duration, daily active users (DAU), or the completion rate of key user journeys. A decline suggests the new changes may have introduced usability issues.
    • Abandonment Rates: In transactional flows, monitor metrics like shopping cart abandonment. A sudden spike after deploying a new checkout process is a strong indicator of a problem.

    With the global SaaS market projected to reach USD 300 billion with an annual growth rate of 19–20%, the financial stakes of each deployment are higher than ever. More details on these trends can be found in this analysis of SaaS market trends on amraandelma.com.

    Tooling for a Crucial Feedback Loop

    Effective monitoring requires a dedicated toolchain. Platforms like Prometheus for time-series metric collection, Grafana for visualization and dashboards, and Datadog for comprehensive observability are industry standards.

    These tools are not just for visualization; they form the backbone of an automated feedback loop. When integrated into a CI/CD pipeline, they enable automated quality gates that can programmatically halt a faulty deployment before it impacts the entire user base.

    Integrating Deployments into Your CI/CD Pipeline

    A deployment strategy's effectiveness is directly proportional to its level of automation. Manual execution of Canary or Blue-Green deployments is inefficient, error-prone, and negates many of the benefits. Integrating the chosen strategy into a CI/CD pipeline transforms the release process into a reliable, repeatable, and safe workflow. The pipeline acts as the automated assembly line, with the deployment strategy serving as the final, rigorous quality control station.

    A hand-drawn CI/CD pipeline checklist showing stages for software deployment strategies.

    Core Stages of a Modern CI/CD Pipeline

    A robust pipeline capable of executing advanced deployment strategies is composed of distinct, automated stages, each serving as a quality gate.

    1. Build: Source code is checked out from version control (e.g., Git), dependencies are resolved, and the code is compiled into a deployable artifact, typically a versioned Docker container image.
    2. Unit & Integration Test: A comprehensive suite of automated tests is executed against the newly built artifact in an isolated environment to catch functional bugs early.
    3. Deploy to Staging: The artifact is deployed to a staging environment that mirrors the production configuration as closely as possible.
    4. Automated Health Checks: Post-deployment to staging, a battery of automated tests (smoke tests, API contract tests, synthetic user monitoring) is executed to validate core functionality and check for performance regressions.
    5. Controlled Production Deploy: This is where the chosen deployment strategy is executed. The pipeline orchestrates the traffic shifting for a Canary, provisioning of a Green environment, or the incremental rollout of a Rolling update.
    6. Promote or Rollback: Based on real-time monitoring against pre-defined Service Level Objectives (SLOs), the pipeline makes an automated decision. If SLIs (e.g., error rate, p99 latency) remain within their SLOs, the deployment is promoted. If any SLO is breached, an automated rollback is triggered.

    A Canary Deployment Checklist in Kubernetes

    Here is a technical blueprint for implementing a Canary deployment using Kubernetes and a CI/CD tool like GitLab CI. This provides a concrete recipe for automating this strategy.

    Key Insight: This process automates risk analysis and decision-making by integrating deployment mechanics with real-time performance monitoring. This is the core principle of a modern Canary deployment.

    Here is the implementation structure:

    • Containerize the Application: Package the application into a Docker image, tagged with an immutable identifier like the Git commit SHA (image: my-app:${CI_COMMIT_SHA}).
    • Create Kubernetes Manifests: Define two separate Kubernetes Deployment resources: one for the stable version and one for the canary version. The canary manifest will reference the new container image. Additionally, define a single Service that selects pods from both deployments.
    • Configure the Ingress Controller/Service Mesh: Use a tool like NGINX Ingress or a service mesh (Istio) to manage traffic splitting. Configure the Ingress resource with annotations or a dedicated TrafficSplit object to route a small percentage of traffic (e.g., 5%) to the canary service based on weight.
    • Define Pipeline Jobs in .gitlab-ci.yml:
      • build job: Builds and pushes the Docker image to a container registry.
      • test job: Runs unit and integration tests.
      • deploy_canary job: Uses kubectl apply to deploy the canary manifest. This job can be set as when: manual for initial deployments to require human approval.
      • promote job: A timed or manually triggered job that, after a validation period (e.g., 15 minutes), updates the Ingress/TrafficSplit resource to shift 100% of traffic to the new version. It then scales down the old deployment.
      • rollback job: A manual or automated job that immediately reverts the Ingress/TrafficSplit configuration and scales down the canary deployment if issues are detected.
    • Set Up Monitoring Dashboards: Use tools like Prometheus and Grafana to create a dedicated "Canary Analysis" dashboard. This dashboard must display key SLIs (error rates, latency, saturation) filtered by service and version labels to compare the canary's performance directly against the stable version's baseline.
    • Automate Go/No-Go Decisions: The promote job should be more than a simple timer. It must begin by executing a script that queries the monitoring system (e.g., Prometheus via its API). If the canary's error rate is below the defined SLO and p99 latency is within an acceptable range, the script exits successfully, allowing the promotion to proceed. Otherwise, it fails, triggering the pipeline's rollback logic.

    Answering Your Deployment Questions

    In practice, the distinctions and applications of these strategies can be nuanced. Let's address some common technical questions that arise during implementation.

    What's the Real Difference Between Blue-Green and Canary?

    The core difference lies in the unit of change and the nature of the transition.

    A Blue-Green deployment operates at the environment level. It is a "hot swap" of the entire application stack. Once the new "green" environment is verified, the load balancer re-routes 100% of traffic in a single, atomic operation. The transition is instantaneous and total. The primary benefit is a simple and immediate rollback by reverting the routing rule.

    A Canary deployment operates at the request level or session level. It is a gradual, incremental transition. The new version is exposed to a small, controlled percentage of production traffic, and this percentage is increased over time based on performance metrics. The rollback is also immediate (by shifting 100% of traffic back to the old version), but the blast radius of any potential issue is much smaller from the outset.

    How Do Feature Flags Fit into All This?

    Feature flags operate at the application logic level, providing a finer-grained control mechanism that is orthogonal to infrastructure-level deployment strategies. They decouple code deployment from feature release.

    Key Takeaway: You can use a standard Rolling deployment to ship new code to 100% of your servers, but with the associated feature flag turned "off." The new code path is present but not executed. This is a "dark launch."

    From a management dashboard, the feature can then be enabled for specific user segments (e.g., internal employees, beta testers, users in a certain geography). This allows you to perform a Canary-style release or an A/B test at the feature level, controlled by application logic rather than by infrastructure routing rules.

    Can You Mix and Match These Strategies?

    Yes, and combining strategies is a common practice in mature organizations to create highly resilient and flexible release processes.

    A powerful hybrid approach is to combine Blue-Green with Canary. In this model, you use the Blue-Green pattern to provision a complete, isolated "green" environment containing the new application version. However, instead of performing an atomic 100% traffic switch, you use Canary techniques to gradually bleed traffic from the "blue" environment to the "green" one.

    This hybrid model offers the advantages of both:

    • The safety and isolation of a completely separate, pre-warmed production environment from the Blue-Green pattern.
    • The risk mitigation of a gradual, metrics-driven rollout from the Canary pattern, which minimizes the blast radius if an issue is discovered in the new environment.

    At OpsMoon, we architect and implement these deployment strategies daily. Our DevOps engineers specialize in building the robust CI/CD pipelines and automation required to ship code faster and more safely. Book a free work planning session and let us help you design a deployment strategy that fits your technical and business needs.

  • A Practical Guide to Running Postgres on Kubernetes

    A Practical Guide to Running Postgres on Kubernetes

    Running Postgres on Kubernetes means deploying and managing your PostgreSQL database cluster within a Kubernetes-native control plane. This approach transforms a traditionally static, stateful database into a dynamic, resilient component of a modern cloud-native architecture. You are effectively integrating the world's most advanced open-source relational database with the industry-standard container orchestration platform.

    The Case for Postgres on Kubernetes

    Historically, running stateful applications like databases on Kubernetes was considered an anti-pattern. Kubernetes was designed for stateless services—ephemeral workloads that could be created, destroyed, and replaced without impacting application state. Databases, requiring stable network identities and persistent storage, seemed antithetical to this model.

    So, why has this combination become a standard for modern infrastructure?

    The paradigm shifted as Kubernetes evolved. Core features were developed specifically for stateful workloads, enabling engineering teams to consolidate their entire operational model. Instead of managing stateless applications on Kubernetes and databases on separate VMs or managed services (DBaaS), everything can now be managed declaratively on a single, consistent platform.

    This unified approach delivers significant technical and operational advantages:

    • Infrastructure Portability: Your entire application stack, database included, becomes a single, portable artifact. You can deploy it consistently across any conformant Kubernetes cluster—public cloud, private data center, or edge locations—without modification.
    • Workload Consolidation: Co-locating database instances alongside your applications on the same cluster improves resource utilization and efficiency. It reduces infrastructure costs by eliminating dedicated, often underutilized, database servers.
    • Unified Operations: Your team can leverage a single set of tools and workflows (kubectl, GitOps, CI/CD pipelines) for the entire stack. This simplifies operations, streamlines automation, and reduces the cognitive load of context-switching between disparate systems.

    A Modern Approach to Data Management

    A key driver for moving databases to Kubernetes is the ability to achieve a single source of truth for your data, which is fundamental for data consistency and reliability. With Kubernetes adoption becoming ubiquitous, it is the de facto standard for container orchestration. By 2025, over 60% of enterprises have adopted it, with some surveys showing adoption as high as 96%. You can explore this data further and learn more about Kubernetes statistics.

    By treating your database as a declarative component, you empower the Kubernetes control plane to manage its lifecycle. Kubernetes handles complex operations—automated provisioning, self-healing from node failures, and scaling—transforming what were once manual, error-prone DBA tasks into a reliable, automated workflow.

    Ultimately, running Postgres on Kubernetes is not merely about containerizing a database. It's about adopting a true cloud-native operational model for your data layer. This unlocks the automation, resilience, and operational efficiency required to build and maintain modern, scalable applications. The following sections provide a technical deep dive into how to implement this.

    Choosing Your Postgres Deployment Architecture

    When deploying Postgres on Kubernetes, the first critical decision is the deployment methodology. This architectural choice fundamentally shapes your operational model, dictating the balance between granular control and automated management. The two primary paths are a manual implementation using a StatefulSet or leveraging a dedicated Kubernetes Operator.

    The optimal choice depends on your team's Kubernetes expertise, your application's Service Level Objectives (SLOs), and the degree of operational complexity you are prepared to manage.

    This decision tree frames the initial architectural choice.

    Flowchart illustrating the decision to use PostgreSQL on Kubernetes for scale and portability.

    As the chart indicates, the primary drivers for this architecture are the requirements for a database that can scale dynamically and be deployed portably—core capabilities offered by running Postgres on Kubernetes.

    The Manual Route: StatefulSets

    A StatefulSet is a native Kubernetes API object designed for stateful applications. It provides foundational guarantees, such as stable, predictable network identifiers (e.g., postgres-0.service-name, postgres-1.service-name) and persistent storage volumes that remain bound to specific pod identities. When you choose this path, you are responsible for building all database management logic from the ground up using fundamental Kubernetes primitives.

    This approach offers maximum control. You define every component: the container image, storage provisioning, initialization scripts, and network configuration. For teams with deep Kubernetes and database administration expertise, this allows for a highly customized solution tailored to specific, non-standard requirements.

    However, this control comes with significant operational overhead. A basic StatefulSet only manages pod lifecycle; it has no intrinsic knowledge of PostgreSQL's internal state.

    • Manual Failover: If the primary database pod fails, Kubernetes will restart it. However, it will not automatically promote a replica to become the new primary. This critical failover logic must be scripted, tested, and managed entirely by your team.
    • Complex Upgrades: A major version upgrade (e.g., from Postgres 15 to 16) is a complex, multi-step manual procedure involving potential downtime and significant risk of data inconsistency if not executed perfectly.
    • Backup and Restore: You are solely responsible for implementing, testing, and verifying a robust backup and recovery strategy. This is a non-trivial engineering task in a distributed system.

    The Automated Path: Kubernetes Operators

    A Kubernetes Operator is a custom controller that extends the Kubernetes API to manage complex applications. It acts as an automated, domain-specific site reliability engineer (SRE) that lives inside your cluster.

    An Operator encodes expert operational knowledge into software. It automates the entire lifecycle of a Postgres cluster, from initial deployment and configuration to complex day-2 operations like high availability, backups, and version upgrades.

    Instead of manipulating low-level resources like Pods and PersistentVolumeClaims, you interact with a high-level Custom Resource Definition (CRD), such as a PostgresCluster object. You declaratively specify the desired state—"I require a three-node cluster running Postgres 16 with continuous archiving to S3"—and the Operator's reconciliation loop works continuously to achieve and maintain that state. This declarative model simplifies management and minimizes human error.

    The Operator pattern is the primary catalyst that has made running stateful workloads like Postgres on Kubernetes a mainstream, production-ready practice. A leading example is EDB's CloudNativePG, a CNCF Sandbox project. It manages failover, scaling, and the entire database lifecycle through a simple, declarative API, abstracting away the complexities of manual management.

    Comparing Deployment Methods: StatefulSet vs Operator

    To make an informed architectural decision, it's crucial to compare these two methods directly. The table below outlines the key differences.

    Feature Manual StatefulSet Kubernetes Operator
    Initial Deployment High complexity; requires deep Kubernetes & Postgres knowledge. Low complexity; a declarative YAML file defines the entire cluster.
    High Availability Entirely manual; you must build and maintain all the failover logic yourself. Automated; handles leader election and promotes replicas for you.
    Backups & Recovery Requires custom scripting and integrating external tools. Built-in, declarative policies for scheduled backups & Point-in-Time Recovery (PITR).
    Upgrades Complex, high-risk manual process for major versions. Automated, managed process with configurable strategies to minimize downtime.
    Scaling Manual process of adjusting replica counts and storage. Often automated through simple updates to the custom resource. To learn more, check out our guide on autoscaling in Kubernetes.
    Operational Overhead Very High; your team is on the hook for every single "day-2" task. Low; the Operator takes care of most routine and complex tasks automatically.
    Best For Learning environments or unique edge cases where you need extreme, low-level customization. Production workloads, large database fleets, and any team that wants to focus on building features, not managing infrastructure.

    This comparison makes the trade-offs clear. While the manual StatefulSet approach offers ultimate control, the Operator path provides the automation, reliability, and reduced operational burden required for most production systems.

    Mastering Storage and Data Persistence

    The fundamental requirement for any database is the ability to reliably persist data. When you run Postgres on Kubernetes, you are placing a stateful workload into an ecosystem designed for stateless, ephemeral containers. A robust storage strategy is therefore non-negotiable.

    The primary goal is to decouple the data's lifecycle from the pod's lifecycle. Kubernetes provides a powerful abstraction layer for this through three core API objects: PersistentVolumes (PVs), PersistentVolumeClaims (PVCs), and StorageClasses.

    Hand-drawn technical diagram showing data flow with PV, storage class, SSD, CubeCore, and cloud components.

    Think of a Pod as an ephemeral compute resource. When it is terminated, its local filesystem is destroyed. The data, however, must persist. This is achieved by mounting an external, persistent storage volume into the pod's filesystem, typically at the PGDATA directory location.

    Understanding Core Storage Concepts

    A PersistentVolume (PV) is a piece of storage in the cluster that has been provisioned by an administrator or dynamically provisioned using a StorageClass. It is a cluster resource, just like a CPU or memory, that represents a physical storage medium like a cloud provider's block storage volume (e.g., AWS EBS, GCE Persistent Disk) or an on-premises NFS share.

    A PersistentVolumeClaim (PVC) is a request for storage by a user or application. It is analogous to a Pod requesting CPU and memory; a PVC requests a specific size and access mode from a PV. Your Postgres pod's manifest will include a PVC to claim a durable volume for its data directory.

    This separation of concerns between PVs and PVCs is a key design principle. It allows application developers to request storage resources without needing to know the underlying infrastructure details.

    The most critical component enabling full automation is the StorageClass. A StorageClass provides a way for administrators to describe the "classes" of storage they offer. Different classes might map to different quality-of-service levels, backup policies, or arbitrary policies determined by the cluster administrator. When a PVC requests a specific storageClassName, Kubernetes uses the corresponding provisioner to dynamically create a matching PV.

    Choosing the Right StorageClass

    The storageClassName field in your PVC manifest is one of the most impactful configuration decisions you will make. It directly determines the performance, resilience, and cost of your database's storage backend.

    Key considerations when selecting or defining a StorageClass:

    • Performance Profile: For a high-transaction OLTP database, select a StorageClass backed by high-IOPS SSD storage. For development, staging, or analytical workloads, a more cost-effective standard disk tier may be sufficient.
    • Dynamic Provisioning: This is a mandatory requirement for any serious deployment. Your StorageClass must be configured with a provisioner that can create volumes on-demand. Manual PV provisioning is not scalable and defeats the purpose of a cloud-native architecture.
    • Volume Expansion: Your data volume will inevitably grow. Ensure your chosen StorageClass and its underlying CSI (Container Storage Interface) driver support online volume expansion (allowVolumeExpansion: true). This allows you to increase disk capacity without database downtime.
    • Data Locality: For optimal performance, use a storage provisioner that is topology-aware. This ensures that the physical storage is provisioned in the same availability zone (or locality) as the node where your Postgres pod is scheduled, minimizing network latency for I/O operations.

    Below is a typical PVC manifest. It requests 10Gi of storage from the fast-ssd StorageClass.

    apiVersion: v1
    kind: PersistentVolumeClaim
    metadata:
      name: postgres-pvc
    spec:
      storageClassName: fast-ssd
      accessModes:
        - ReadWriteOnce
      resources:
        requests:
          storage: 10Gi
    

    Understanding Access Modes

    The accessModes field is a critical safety mechanism. For a standard single-primary PostgreSQL instance, ReadWriteOnce (RWO) is the only safe and valid option.

    RWO ensures that the volume can be mounted as read-write by only a single node at a time. This prevents a catastrophic "split-brain" scenario where two different Postgres pods on different nodes attempt to write to the same data files simultaneously, which would lead to immediate and unrecoverable data corruption.

    While other modes like ReadWriteMany (RWX) exist, they are designed for distributed file systems (like NFS) and are not suitable for the data directory of a block-based transactional database like PostgreSQL. Always use RWO.

    Implementing High Availability and Disaster Recovery

    For any production database, ensuring high availability (HA) to withstand localized failures and disaster recovery (DR) to survive large-scale outages is paramount. When running Postgres on Kubernetes, you can architect a highly resilient system by combining PostgreSQL's native replication capabilities with Kubernetes' self-healing infrastructure.

    The core of Postgres HA is the primary-replica architecture. A single primary node handles all write operations, while one or more read-only replicas maintain a synchronized copy of the data. The key to HA is the ability to detect a primary failure and automatically promote a replica to become the new primary with minimal downtime. A well-designed Kubernetes Operator excels at orchestrating this process.

    A hand-drawn diagram illustrating a system architecture with primary, Arsdware, Pol, and ZMQ components, showing data flow and automated processes.

    Building a Resilient Primary-Replica Architecture

    PostgreSQL's native streaming replication is the foundation for this architecture. It functions by streaming Write-Ahead Log (WAL) records from the primary to its replicas in near real-time. There are two primary modes of replication, each with distinct trade-offs.

    Asynchronous Replication: This is the default and most common mode. The primary commits a transaction as soon as the WAL record is written to its local disk, without waiting for acknowledgment from any replicas.

    • Pro: Delivers the highest performance and lowest write latency.
    • Con: Introduces a small window for potential data loss. If the primary fails before a committed transaction's WAL record is transmitted to a replica, that transaction will be lost (Recovery Point Objective > 0).

    Synchronous Replication: In this mode, the primary waits for at least one replica to confirm that it has received and durably written the WAL record before reporting a successful commit to the client.

    • Pro: Guarantees zero data loss (RPO=0) for successfully committed transactions.
    • Con: Increases write latency, as each transaction now incurs a network round-trip to a replica.

    The choice between asynchronous and synchronous replication is a critical business decision, balancing performance requirements against data loss tolerance. Financial systems typically require synchronous replication, whereas for many other applications, the performance benefits of asynchronous replication outweigh the minimal risk of data loss.

    The Kubernetes Role in Automated Failover

    While Kubernetes is not inherently aware of database roles, it provides the necessary primitives for an Operator to build a robust automated failover system.

    The objective of automated failover is to detect primary failure, elect a new leader from the available replicas, promote it to primary, and seamlessly reroute all database traffic—all within seconds, without human intervention.

    Several Kubernetes features are orchestrated to achieve this:

    • Liveness Probes: Kubernetes uses probes to determine pod health. An intelligent Operator configures a liveness probe that performs a deep check on the database's role. If a primary pod fails its health check, Kubernetes will terminate and restart it, triggering the failover process.
    • Leader Election: This is the core of the failover mechanism. Operators typically implement a leader election algorithm using Kubernetes primitives like a ConfigMap or a Lease object as a distributed lock. Only the pod holding the lock can assume the primary role. If the primary fails, replicas will contend to acquire the lock.
    • Pod Anti-Affinity: This is a non-negotiable scheduling rule. It instructs the Kubernetes scheduler to avoid co-locating multiple Postgres pods from the same cluster on the same physical node. This ensures that a single node failure cannot take down your entire database cluster.

    Planning for Disaster Recovery

    High availability protects against failures within a single cluster or availability zone. Disaster recovery addresses the loss of an entire data center or region. This requires a strategy centered around off-site backups.

    The industry-standard strategy for PostgreSQL DR is continuous archiving using tools like pg_basebackup combined with a WAL archiving tool such as WAL-G or pgBackRest. This methodology consists of two components:

    1. Full Base Backup: A complete physical copy of the database, taken periodically (e.g., daily).
    2. Continuous WAL Archiving: As WAL segments are generated by the primary, they are immediately streamed to a durable, remote object storage service (e.g., AWS S3, Google Cloud Storage, Azure Blob Storage).

    This combination enables Point-in-Time Recovery (PITR). In a disaster scenario, you can restore the most recent full backup and then replay the archived WAL files to recover the database state to any specific moment, minimizing data loss.

    PostgreSQL's immense popularity is driven by its powerful and extensible feature set. As of 2025, it commands 16.85% of the relational database market, serving as the data backbone for organizations like Spotify and NASA. Its advanced capabilities, from JSONB and PostGIS to vector support for AI/ML applications, fuel its growing adoption. More details on this trend are available in the rising popularity of PostgreSQL on experience.percona.com. For a system this critical running on Kubernetes, a well-architected DR plan is not optional.

    Securing Your Database With Essential Networking Patterns

    Securing your postgres on kubernetes deployment requires a multi-layered, defense-in-depth strategy. In a dynamic environment where pods are ephemeral, traditional network security models based on static IP addresses are insufficient. You must adopt a cloud-native approach that combines network policies with strict access control.

    The first step is controlling network exposure of the database. Kubernetes provides several Service types for this purpose, each serving a distinct use case.

    A hand-drawn diagram illustrating a shield with a padlock protecting secrets, showing inputs and outputs.

    Controlling Database Exposure

    The most secure and recommended method for exposing Postgres is using a ClusterIP service. This is the default service type, which assigns a stable virtual IP address that is only routable from within the Kubernetes cluster. This effectively isolates the database from any external network traffic. For the vast majority of use cases, where only in-cluster applications need to connect to the database, this is the correct choice.

    If external access is an absolute requirement, you can use a LoadBalancer service. This provisions an external load balancer from your cloud provider (e.g., an AWS ELB or a Google Cloud Load Balancer) that routes traffic to your Postgres service. This approach should be used with extreme caution, as it exposes the database directly to the public internet. If you use it, you must implement strict firewall rules (security groups) and enforce mandatory TLS encryption for all connections.

    Enforcing Zero-Trust With NetworkPolicies

    By default, Kubernetes has a flat network model where any pod can communicate with any other pod. A zero-trust security model assumes no implicit trust and requires explicit policies to allow communication. This is implemented using NetworkPolicy resources. A NetworkPolicy acts as a micro-firewall for your pods, allowing you to define granular ingress and egress rules.

    A well-defined NetworkPolicy is your most effective tool for preventing lateral movement by an attacker. If an application pod is compromised, a strict policy can prevent it from connecting to the database, thus containing the breach.

    For instance, you can create a policy that only allows ingress traffic to your Postgres pod on port 5432 from pods with the label app: my-api. All other connection attempts will be blocked at the network level. This "principle of least privilege" is a cornerstone of modern security architecture.

    For a comprehensive overview, refer to our guide on Kubernetes security best practices.

    Managing Secrets And Access Control

    Hardcoding database credentials in application code, configuration files, or container images is a severe security vulnerability. The correct method for managing sensitive information is using Kubernetes Secrets. A Secret is an API object designed to hold confidential data, which can then be securely mounted into application pods as environment variables or files in a volume.

    However, network security is only one part of the equation. Application-level vulnerabilities must also be addressed. A primary threat to databases is preventing SQL injection attacks, which can bypass network controls entirely.

    Finally, access to both the database itself and the Kubernetes resources that manage it must be tightly controlled.

    • Role-Based Access Control (RBAC): Use Kubernetes RBAC to enforce the principle of least privilege, controlling which users or service accounts can interact with your database pods, services, and secrets.
    • Postgres Roles: Within the database, create specific user roles with the minimum set of privileges required for each application. The superuser account should never be used for routine application connections.
    • Transport Layer Security (TLS): Enforce TLS encryption for all connections between your applications and the Postgres database. This prevents man-in-the-middle attacks and ensures data confidentiality in transit.

    Implementing Robust Monitoring and Performance Tuning

    Operating a database without comprehensive monitoring is untenable. When running Postgres on Kubernetes, the dynamic nature of the environment makes robust observability a critical requirement. The goal is not just to detect failures but to proactively identify performance bottlenecks and resource constraints. The de facto standard monitoring stack in the cloud-native ecosystem is Prometheus for metrics collection and Grafana for visualization.

    To integrate Prometheus with PostgreSQL, a metrics exporter is required. The postgres_exporter is a widely used tool that runs as a sidecar container alongside your database pod. It queries PostgreSQL's internal statistics views (e.g., pg_stat_database, pg_stat_activity) and exposes the metrics in a format that Prometheus can scrape.

    Key Postgres Metrics to Track

    Effective monitoring requires focusing on key performance indicators (KPIs) that provide actionable insights into the health and performance of your database.

    Here are the essential metrics to monitor:

    • Transaction Throughput: pg_stat_database_xact_commit (commits) and pg_stat_database_xact_rollback (rollbacks). These metrics indicate the database workload. A sudden increase in rollbacks often signals application-level errors.
    • Replication Lag: For HA clusters, monitoring the lag between the primary and replica nodes is critical. A consistently growing lag indicates that replicas are unable to keep up with the primary's write volume, jeopardizing your RPO and RTO for failover.
    • Cache Hit Ratio: This metric indicates the percentage of data blocks read from PostgreSQL's shared buffer cache versus from disk. A cache hit ratio consistently below 99% suggests that the database is memory-constrained and may benefit from a larger shared_buffers allocation.
    • Index Efficiency: Monitor the ratio of index scans (idx_scan) to sequential scans (seq_scan) from the pg_stat_user_tables view. A high number of sequential scans on large tables is a strong indicator of missing or inefficient indexes.

    Monitoring is the process of translating raw data into actionable insights. By focusing on these core metrics, you can shift from a reactive, "fire-fighting" operational posture to a proactive, performance-tuning one. Learn more about implementing this in our guide on Prometheus service monitoring.

    Tuning Performance in a Kubernetes Context

    Performance tuning in Kubernetes involves both traditional database tuning and configuring the pod's interaction with the cluster's resource scheduler.

    The most critical pod specification settings are resource requests and limits.

    • Requests: The amount of CPU and memory that Kubernetes guarantees to your pod. This is a reservation that ensures your database has the minimum resources required to function properly.
    • Limits: The maximum amount of CPU and memory the pod is allowed to consume. Setting a memory limit is crucial to prevent a memory-intensive query from consuming all available memory on a node, which could lead to an Out-of-Memory (OOM) kill and instability across the node.

    For a stateful workload like a database, it is best practice to set resource requests and limits to the same value. This places the pod in the Guaranteed Quality of Service (QoS) class. Guaranteed QoS pods have the highest scheduling priority and are the last to be evicted during periods of node resource pressure, providing maximum stability for your database.

    Postgres on Kubernetes: Your Questions Answered

    Deploying a stateful system like PostgreSQL on an ephemeral platform like Kubernetes naturally raises questions. Addressing these concerns with clear, technical answers is crucial for building a reliable and supportable database architecture.

    Is This Really a Good Idea for Production?

    Yes, unequivocally. Running production databases on Kubernetes has evolved from an experimental concept to a mature, industry-standard practice, provided it is implemented correctly. The platform's native constructs, such as StatefulSets and the Persistent Storage subsystem, provide the necessary foundation. When combined with a production-grade database Operator, the architecture becomes robust and reliable.

    The key is to move beyond simply containerizing Postgres. An Operator provides automated management for critical day-2 operations: high-availability failover, point-in-time recovery, and controlled version upgrades. This level of automation significantly reduces the risk of human error, which is a leading cause of outages in manually managed database systems.

    What's the Single Biggest Mistake to Avoid?

    The most common mistake is underestimating the operational complexity of a manual deployment. It is deceptively easy to create a basic StatefulSet and a PVC, but this initial simplicity ignores the long-term operational burden.

    A manual setup without a rigorously tested, automated plan for backups, failover, and upgrades is not a production solution; it is a future outage waiting to happen.

    This is precisely why leveraging a mature Kubernetes Operator is the recommended approach for production workloads. It encapsulates years of operational best practices into a reliable, automated system, allowing your team to focus on application development rather than infrastructure management.

    How Should We Handle Connection Pooling?

    Connection pooling is not optional; it is a mandatory component for any high-performance Postgres deployment on Kubernetes. PostgreSQL's process-per-connection model can be resource-intensive, and the dynamic nature of a containerized environment can lead to a high rate of connection churn.

    The standard pattern is to deploy a dedicated connection pooler like PgBouncer between your applications and the database. There are two primary deployment models for this:

    • Sidecar Container: Deploy PgBouncer as a container within the same pod as your application. This isolates the connection pool to each application replica.
    • Standalone Service: Deploy PgBouncer as a separate, centralized service that all application replicas connect to. This model is often simpler to manage and monitor at scale.

    Many Kubernetes Operators can automate the deployment and configuration of PgBouncer, ensuring that your database is protected from connection storms and can scale efficiently.


    At OpsMoon, we specialize in designing, building, and managing robust, scalable infrastructure on Kubernetes. Our DevOps experts can architect a production-ready Postgres on Kubernetes solution tailored to your specific performance and availability requirements. Let's build your roadmap together—start with a free work planning session.

  • The Difference Between Docker and Kubernetes: A Technical Deep-Dive

    The Difference Between Docker and Kubernetes: A Technical Deep-Dive

    Engineers often frame the discussion as "Docker vs. Kubernetes," which is a fundamental misunderstanding. They are not competitors; they are complementary technologies that solve distinct problems within the containerization lifecycle. The real conversation is about how they integrate to form a modern, cloud-native stack.

    In short: Docker is a container runtime and toolset for building and running individual OCI-compliant containers, while Kubernetes is a container orchestration platform for automating the deployment, scaling, and management of containerized applications across a cluster of nodes. Docker creates the standardized unit of deployment—the container image—and Kubernetes manages those units in a distributed production environment.

    Defining Roles: Docker vs. Kubernetes

    Pitting them against each other misses their distinct scopes. Docker operates at the micro-level of a single host. Its primary function is to package an application with its dependencies—code, runtime, system tools, system libraries—into a lightweight, portable container image. This standardized artifact solves the classic "it works on my machine" problem by ensuring environmental consistency from development to production.

    Kubernetes (K8s) operates at the macro-level of a cluster. Once you have built your container images, Kubernetes takes over to run them across a fleet of machines (nodes). It abstracts away the underlying infrastructure and handles the complex operational challenges of running distributed systems in production.

    These challenges include:

    • Automated Scaling: Dynamically adjusting the number of running containers (replicas) based on real-time metrics like CPU or memory utilization.
    • Self-Healing: Automatically restarting crashed containers, replacing failed containers, and rescheduling workloads from failed nodes to healthy ones.
    • Service Discovery & Load Balancing: Providing stable network endpoints (Services) for ephemeral containers (Pods) and distributing traffic among them.
    • Automated Rollouts & Rollbacks: Managing versioned deployments, allowing for zero-downtime updates and immediate rollbacks if issues arise.

    To use a technical analogy: Docker provides the chroot jail with process isolation via namespaces and resource limiting via cgroups. Kubernetes is the distributed operating system that schedules these isolated processes across a cluster, managing their state, networking, and storage.

    Key Distinctions at a Glance

    To be precise, this table breaks down the core technical and operational differences. Understanding these distinctions is the first step toward architecting a modern, scalable system.

    Aspect Docker Kubernetes
    Primary Function Building OCI-compliant container images and running containers on a single host. Automating deployment, scaling, and management of containerized applications across a cluster.
    Scope Single host/node. The unit of management is an individual container. A cluster of multiple hosts/nodes. The unit of management is a Pod (one or more containers).
    Core Use Case Application packaging (Dockerfile), local development environments, and CI/CD build agents. Production-grade deployment, high availability, fault tolerance, and declarative autoscaling.
    Complexity Relatively low. The Docker CLI and docker-compose.yml are intuitive for single-host operations. High. A steep learning curve due to its distributed architecture and declarative API model.

    They fill two distinct but complementary roles. Docker is the de facto standard for containerization, with an 83.18% market share. Kubernetes has become the industry standard for container orchestration, with over 60% of enterprises adopting it for production workloads.

    To gain a practical understanding of the containerization layer, this detailed Docker setup guide is an excellent starting point. It provides hands-on experience with the tooling that creates the artifacts Kubernetes is designed to manage.

    Comparing Core Architectural Models

    Hand-drawn diagram showing a Control Planer with Docker Engine and REST API CLI connecting to Kubernetes components.

    To grasp the fundamental separation between Docker and Kubernetes, one must analyze their architectural designs. Docker employs a straightforward client-server model optimized for a single host. In contrast, Kubernetes is a complex, distributed system architected for high availability and fault tolerance across a cluster.

    Understanding these foundational blueprints is key to knowing why one tool builds containers and the other orchestrates them.

    Deconstructing the Docker Engine

    Docker's architecture is self-contained and centered on the Docker Engine, a core component installed on a host machine that manages all container lifecycle operations. Its design is laser-focused on its primary purpose: creating and managing individual containers efficiently on a single node.

    The Docker Engine consists of three main components that form a classic client-server architecture:

    1. The Docker Daemon (dockerd): This is the server-side, persistent background process that listens for Docker API requests. It manages Docker objects such as images, containers, networks, and volumes. It is the brain of the operation on a given host.
    2. The REST API: The API specifies the interfaces that programs can use to communicate with the daemon. It provides a standardized programmatic way to instruct dockerd on actions to perform, from docker build to docker stop.
    3. The Docker CLI (Command Line Interface): When a user types a command like docker run, they are interacting with the CLI client. The client takes the command, formats it into an API request, and sends it to dockerd via the REST API for execution.

    This architecture is extremely effective for development and single-node deployments. Its primary limitation is its scope: it was fundamentally designed to manage resources on one host, not a distributed fleet.

    Analyzing the Kubernetes Distributed System

    Kubernetes introduces a far more intricate, distributed architecture designed for high availability and resilience. It utilizes a cluster model that cleanly separates management tasks (the Control Plane) from application workloads (the Worker Nodes). This architectural separation is precisely what enables Kubernetes to manage applications at massive scale.

    A Kubernetes cluster is divided into two primary parts: the Control Plane and the Worker Nodes.

    The architectural leap from Docker's single-host model to Kubernetes' distributed Control Plane and Worker Nodes is the core technical differentiator. It's the difference between managing a single process and orchestrating a distributed operating system.

    The Kubernetes Control Plane Components

    The Control Plane serves as the cluster's brain. It makes global decisions (e.g., scheduling) and detects and responds to cluster events. It comprises a collection of critical components that can run on a single master node or be replicated across multiple masters for high availability.

    • API Server (kube-apiserver): This is the central hub for all cluster communication and the front-end for the control plane. It exposes the Kubernetes API, processing REST requests, validating them, and updating the cluster's state in etcd.
    • etcd: A consistent and highly-available key-value store used as Kubernetes' backing store for all cluster data. It is the single source of truth, storing the desired and actual state of every object in the cluster.
    • Scheduler (kube-scheduler): This component watches for newly created Pods that have no assigned node and selects a node for them to run on. The scheduling decision is based on resource requirements, affinity/anti-affinity rules, taints and tolerations, and other constraints.
    • Controller Manager (kube-controller-manager): This runs controller processes that regulate the cluster state. Logically, each controller is a separate process, but they are compiled into a single binary for simplicity. Examples include the Node Controller, Replication Controller, and Endpoint Controller.

    This distributed control mechanism ensures that the cluster can maintain the application's desired state even if individual components fail.

    The Kubernetes Worker Node Components

    Worker nodes are the machines (VMs or bare metal) where application containers are executed. Each worker node is managed by the control plane and contains the necessary services to run Pods—the smallest and simplest unit in the Kubernetes object model that you create or deploy.

    • Kubelet: An agent that runs on each node in the cluster. It ensures that containers described in PodSpecs are running and healthy. It communicates with the control plane and the container runtime.
    • Kube-proxy: A network proxy running on each node that maintains network rules. These rules allow network communication to your Pods from network sessions inside or outside of your cluster, implementing the Kubernetes Service concept.
    • Container Runtime: The software responsible for running containers. Kubernetes supports any runtime that implements the Container Runtime Interface (CRI), such as containerd or CRI-O. This component pulls container images from a registry, and starts and stops them.

    This clean separation of concerns—management (Control Plane) vs. execution (Worker Nodes)—is the source of Kubernetes' power. It is an architecture designed from inception to orchestrate complex, distributed workloads.

    Technical Feature Analysis and Comparison

    Beyond high-level architecture, the practical differences between Docker and Kubernetes emerge in their core operational features. Docker, often used with Docker Compose, provides a solid foundation for single-host deployments. Kubernetes adds a layer of automated intelligence designed for distributed systems.

    Let's perform a technical breakdown of how they handle scaling, networking, storage, and resilience.

    To fully appreciate the orchestration layer Kubernetes provides, it is essential to first understand the container layer. This Docker container tutorial for beginners provides the foundational knowledge required.

    Scaling Mechanisms: Manual vs. Automated

    One of the most significant operational divides is the approach to scaling. Docker's approach is imperative and manual, while Kubernetes employs a declarative, automated model.

    With Docker Compose, scaling a service is an explicit command. You directly instruct the Docker daemon to adjust the number of container instances. This is straightforward for predictable, manual adjustments on a single host.

    For instance, to scale a web service to 5 instances using a docker-compose.yml file, you execute:

    docker-compose up --scale web=5 -d
    

    This command instructs the Docker Engine to ensure five containers for the web service are running. However, this is a point-in-time operation. If one container crashes or traffic surges, manual intervention is required to correct the state or scale further.

    Kubernetes introduces the Horizontal Pod Autoscaler (HPA), which automatically adjusts the number of Pods in a ReplicaSet, Deployment, or StatefulSet based on observed metrics like CPU utilization or custom metrics. You declare the desired state, and the Kubernetes control loop works to maintain it.

    A basic HPA manifest is defined in YAML:

    apiVersion: autoscaling/v2
    kind: HorizontalPodAutoscaler
    metadata:
      name: my-app-hpa
    spec:
      scaleTargetRef:
        apiVersion: apps/v1
        kind: Deployment
        name: my-app
      minReplicas: 2
      maxReplicas: 10
      metrics:
      - type: Resource
        resource:
          name: cpu
          target:
            type: Utilization
            averageUtilization: 60
    

    This declarative approach enables true, hands-off autoscaling, a critical requirement for production systems with variable load.

    Key Differentiator: Docker requires imperative, command-driven scaling. Kubernetes provides declarative, policy-driven autoscaling based on real-time application load, which is essential for resilient production systems.

    Service Discovery and Networking

    Container networking is complex, and the approaches of Docker and Kubernetes reflect their different design goals. Docker's networking is host-centric, while Kubernetes provides a flat, cluster-wide networking fabric.

    By default, Docker uses bridge networks, creating a private L2 segment on the host machine. Containers on the same bridge network can resolve each other's IP addresses via container name using Docker's embedded DNS server. This is effective for applications running on a single server but does not natively extend across multiple hosts.

    Kubernetes implements a more abstract and powerful networking model designed for clusters.

    • Cluster-wide DNS: Every Service in Kubernetes gets a stable DNS A/AAAA record (my-svc.my-namespace.svc.cluster-domain.example). This allows Pods to reliably communicate using a consistent name, regardless of the node they are scheduled on or if they are restarted.
    • Service Objects: A Kubernetes Service is an abstraction that defines a logical set of Pods and a policy by which to access them. It provides a stable IP address (ClusterIP) and DNS name, and load balances traffic to the backend Pods. This decouples clients from the ephemeral nature of Pods.

    This means you never directly track individual Pod IP addresses. You communicate with the stable Service endpoint, and Kubernetes handles the routing and load balancing.

    Operational Feature Comparison

    This table provides a technical breakdown of how each platform handles day-to-day operational tasks.

    Feature Docker Approach Kubernetes Approach Key Differentiator
    Scaling Manual, imperative commands (docker-compose --scale). Requires human intervention to respond to load. Automated and declarative via the Horizontal Pod Autoscaler (HPA). Scales based on metrics like CPU/memory. Automation. Kubernetes scales without manual input, reacting to real-time conditions.
    Networking Host-centric bridge networks. Simple DNS for containers on the same host. Multi-host requires extra tooling. Cluster-wide, flat network model. Built-in DNS and Service objects provide stable endpoints and load balancing. Scope. Kubernetes provides a native, resilient networking fabric for distributed systems out of the box.
    Storage Host-coupled Volumes. Data is tied to a specific directory on a specific host machine. Abstracted via PersistentVolumes (PV) and PersistentVolumeClaims (PVC). Storage is a cluster resource. Portability. Kubernetes decouples storage from nodes, allowing stateful pods to move freely across the cluster.
    Health Management Basic container restart policies (restart: always). No automated health checks or workload replacement. Proactive self-healing. Liveness/readiness probes detect failures; controllers replace unhealthy Pods automatically. Resilience. Kubernetes is designed to automatically detect and recover from failures, a core production need.

    This comparison makes it clear: Docker provides the essential tools for running containers on a single host, while Kubernetes builds an automated, resilient platform around those containers for distributed environments.

    Storage Management Abstraction Levels

    Stateful applications require persistent storage, and the two platforms offer different levels of abstraction.

    Docker's solution is Volumes. A Docker Volume maps a directory on the host filesystem into a container. Docker manages this directory, and since it exists outside the container's writable layer, data persists even if the container is removed. This is effective but tightly couples the storage to a specific host.

    Kubernetes introduces a two-part abstraction to decouple storage from specific nodes:

    1. PersistentVolume (PV): A piece of storage in the cluster that has been provisioned by an administrator. It is a cluster resource, just like a node is a cluster resource. PVs have a lifecycle independent of any individual Pod that uses the PV.
    2. PersistentVolumeClaim (PVC): A request for storage by a user. It is similar to a Pod. Pods consume node resources; PVCs consume PV resources.

    A developer defines a PVC in their application manifest, requesting a specific size and access mode (e.g., ReadWriteOnce). Kubernetes dynamically provisions a matching PV (using a StorageClass) or binds the claim to an available pre-provisioned PV. This model allows stateful Pods to be scheduled on any node in the cluster while maintaining access to their data.

    Self-Healing and Resilience

    Finally, the most critical differentiator for production systems is self-healing.

    Docker has no native mechanism for application-level health checking. If a container crashes, it can be restarted based on a configured policy (e.g., restart: always), but if the application inside the container deadlocks or becomes unresponsive, Docker has no way to detect this.

    Self-healing is a core design principle of Kubernetes. The Controller Manager and Kubelet work together to constantly reconcile the cluster's current state with its desired state.

    • Liveness Probes: Kubelet periodically checks if a container is still alive. If the probe fails, Kubelet kills the container, and its controller (e.g., ReplicaSet) creates a replacement.
    • Readiness Probes: Kubelet uses this probe to know when a container is ready to start accepting traffic. Pods that fail readiness probes are removed from Service endpoints.

    This automated failure detection and recovery is what elevates Kubernetes to a production-grade orchestration platform. It's not just about running containers; it's about ensuring the service they provide remains available.

    Choosing the Right Tool for the Job

    The decision between Docker and Kubernetes is not about which is "better," but which is appropriate for the task's scale and complexity. The choice represents a trade-off between operational simplicity and the raw power required for distributed systems.

    Getting this decision right prevents over-engineering simple projects or, more critically, under-equipping complex applications destined for production. A solo developer building a prototype has vastly different requirements than an enterprise operating a distributed microservices architecture.

    This diagram illustrates the core decision point.

    A diagram asking 'Need Scaling?' with arrows pointing to Kubernetes and Docker logos.

    The primary question is whether you require automated scaling, fault tolerance, and multi-node orchestration. If the answer is yes, the path leads directly to Kubernetes.

    When Docker Standalone Is the Superior Choice

    For many scenarios, the operational overhead of a Kubernetes cluster is not only unnecessary but counterproductive. This is where Docker, especially when combined with Docker Compose, excels through its simplicity and speed.

    • Local Development Environments: Docker provides developers with consistent, isolated environments that mirror production. It is unparalleled for building and testing multi-container applications on a local machine without cluster management complexity.
    • CI/CD Build Pipelines: Docker is the ideal tool for creating clean, ephemeral, and reproducible build environments within CI/CD pipelines. It packages the application into an immutable image, ready for subsequent testing and deployment stages.
    • Single-Node Applications: For simple applications or services designed to run on a single host—such as internal tools, small web apps, or background job processors without high-availability requirements—Docker provides sufficient functionality.

    The rule of thumb is: if the primary challenge is application packaging and consistent execution on a single host, use Docker. Introducing an orchestrator at this stage adds unnecessary layers of abstraction and complexity.

    Scenarios That Demand Kubernetes

    As an application's scale and complexity grow, the limitations of a single-host setup become apparent. Kubernetes was designed specifically to solve the operational challenges of managing containerized applications across a fleet of machines.

    • Distributed Microservices Architectures: When an application is decomposed into numerous independent microservices, a system to manage their lifecycle, networking, configuration, and discovery is essential. Kubernetes provides the robust orchestration and service mesh integrations required for such architectures.
    • Stateful Applications Requiring High Availability: For systems like databases or message queues that require persistent state and must remain available during node failures, Kubernetes is critical. Its self-healing capabilities, combined with StatefulSets and PersistentVolumes, ensure data integrity and service uptime.
    • Multi-Cloud and Hybrid Deployments: Kubernetes provides a consistent API and operational model that abstracts the underlying infrastructure, whether on-premises or across multiple cloud providers. This prevents vendor lock-in and enables true workload portability.

    Choosing the right infrastructure is also key. The decision goes beyond orchestration to the underlying compute, such as the trade-offs between cloud server vs. dedicated server models. For a broader view of the landscape, you can explore the best container orchestration tools.

    The pragmatic approach is to start with Docker for development and simple deployments. When the application's requirements for scale, resilience, and operational automation exceed the capabilities of a single node, it is time to adopt the production-grade power of Kubernetes.

    How Docker and Kubernetes Work Together

    The idea of Docker and Kubernetes as competitors is a misconception. They form a symbiotic relationship, representing two essential stages in a modern cloud-native delivery pipeline.

    Docker addresses the "build" phase: it packages an application and its dependencies into a standardized, portable OCI container image. Kubernetes, in turn, addresses the "run" phase: it takes those container images and automates their deployment, management, and scaling in a distributed environment.

    This partnership forms the backbone of a typical DevOps workflow, enabling a seamless transition from a developer's machine to a production cluster.

    Diagram showing Dockerfile build, image push to registry, and deployment to Kubernetes.

    This integrated workflow guarantees environmental consistency from local development through to production, finally solving the "it works on my machine" problem. Each tool has a clearly defined responsibility, handing off the artifact at the appropriate stage.

    The Standard DevOps Workflow Explained

    The process of moving code to a running application in Kubernetes follows a well-defined, automated path that leverages the strengths of both technologies. Docker creates the deployable artifact, and Kubernetes provides the production-grade runtime.

    Here is a step-by-step technical breakdown of this collaboration.

    Step 1: Write the Dockerfile
    The workflow begins with the Dockerfile, a text file containing instructions to assemble a container image. It specifies the base image, source code location, dependencies, and the command to execute when the container starts.

    A simple Dockerfile for a Node.js application:

    # Use an official Node.js runtime as a parent image
    FROM node:18-alpine
    
    # Set the working directory in the container
    WORKDIR /usr/src/app
    
    # Copy package.json and package-lock.json to leverage build cache
    COPY package*.json ./
    
    # Install app dependencies
    RUN npm install
    
    # Bundle app source
    COPY . .
    
    # Expose the application port
    EXPOSE 8080
    
    # Define the command to run the application
    CMD [ "node", "server.js" ]
    

    This file is the declarative blueprint for the application's runtime environment.

    Step 2: Build and Tag the Docker Image
    A developer or a CI/CD server executes the docker build command. Docker reads the Dockerfile, executes each instruction, and produces a layered, immutable container image.

    docker build -t my-username/my-cool-app:v1.0 .
    

    This command creates an image named my-cool-app with the tag v1.0.

    Step 3: Push the Image to a Container Registry
    The built image is pushed to a central container registry, such as Docker Hub, Google Container Registry (GCR), or Amazon Elastic Container Registry (ECR). This makes the image accessible to the Kubernetes cluster.

    docker push my-username/my-cool-app:v1.0
    

    At this stage, Docker's primary role is complete. It has produced a portable, versioned artifact ready for deployment.

    Deploying the Image with Kubernetes

    Kubernetes now takes over to handle orchestration. Kubernetes does not build images; it consumes them. It uses declarative YAML manifests to define the desired state of the running application.

    Step 4: Create a Kubernetes Deployment Manifest
    A Deployment is a Kubernetes API object that manages a set of replicated Pods. The following YAML manifest instructs Kubernetes which container image to run and how many replicas to maintain.

    apiVersion: apps/v1
    kind: Deployment
    metadata:
      name: my-cool-app-deployment
    spec:
      replicas: 3
      selector:
        matchLabels:
          app: my-cool-app
      template:
        metadata:
          labels:
            app: my-cool-app
        spec:
          containers:
          - name: my-app-container
            image: my-username/my-cool-app:v1.0
            ports:
            - containerPort: 8080
    

    The spec.template.spec.containers[0].image field points directly to the image pushed to the registry in the previous step.

    Step 5: Apply the Manifest to the Cluster
    Finally, the kubectl command-line tool is used to submit this manifest to the Kubernetes API server.

    kubectl apply -f deployment.yaml
    

    Kubernetes now takes control. Its controllers read the manifest, schedule Pods onto nodes, instruct the kubelets to pull the specified Docker image from the registry, and continuously work to ensure that three healthy replicas of the application are running.

    This workflow perfectly illustrates the separation of concerns. Docker is the builder, responsible for packaging the application at build time. Kubernetes is the manager, responsible for orchestrating and managing that package at runtime.

    Understanding the Kubernetes Ecosystem

    Kubernetes achieved dominance not just through its technical merits, but through the powerful open-source ecosystem that developed around it. Docker provided the standard for containers; Kubernetes provided the standard for orchestrating them, largely due to its open governance and extensible design.

    Housed within the Cloud Native Computing Foundation (CNCF), Kubernetes benefits from broad industry collaboration, ensuring it remains vendor-neutral. This fosters trust and prevents fragmentation, giving enterprises the confidence to build on a stable, long-lasting foundation.

    The Power of Integrated Tooling

    This open, collaborative model has fostered a rich ecosystem of specialized tools that integrate deeply with the Kubernetes API to solve specific operational problems. These tools elevate Kubernetes from a core orchestrator to a comprehensive application platform.

    A few key examples that have become de facto standards:

    • Prometheus for Monitoring: The standard for metrics-based monitoring and alerting in cloud-native environments, providing deep visibility into cluster and application performance.
    • Helm for Package Management: A package manager for Kubernetes that simplifies the deployment and management of complex applications using versioned, reusable packages called Charts.
    • Istio for Service Mesh: A powerful service mesh that provides traffic management, security (mTLS), and observability at the platform layer, without requiring changes to application code.

    Kubernetes' true strength lies not just in its core functionality, but in its extensibility. Its API-centric design and CNCF stewardship have created a gravitational center, attracting the best tools and talent to build a cohesive, enterprise-grade platform.

    Market Drivers and Explosive Growth

    The enterprise shift to microservices architectures created a demand for a robust orchestration solution, and Kubernetes filled that need perfectly. Its ability to manage complex distributed systems while offering portability across hybrid and multi-cloud environments made it the clear choice for modern infrastructure.

    Market data validates this trend. The Kubernetes market was valued at USD 1.8 billion in 2022 and is projected to reach USD 9.69 billion by 2031, growing at a CAGR of 23.4%. This reflects its central role in any scalable, cloud-native strategy. You can review the analysis in Mordor Intelligence's full report.

    Whether deployed on a major cloud provider or on-premises, its management capabilities are indispensable—a topic explored in our guide to running Kubernetes on bare metal. This surrounding ecosystem provides long-term value and solidifies its position as the industry standard.

    Frequently Asked Questions

    When working with Docker and Kubernetes, several key technical questions consistently arise. Here are clear, practical answers to the most common queries.

    Can You Use Kubernetes Without Docker?

    Yes, absolutely. The belief that Kubernetes requires Docker is a common misconception rooted in its early history. Kubernetes is designed to be runtime-agnostic through the Container Runtime Interface (CRI), a plugin interface that enables kubelet to use a wide variety of container runtimes.

    While Docker Engine was the initial runtime, direct integration via dockershim was deprecated in Kubernetes v1.20 and removed in v1.24. Today, Kubernetes works with any CRI-compliant runtime, such as containerd (the industry-standard core runtime component extracted from the Docker project) or CRI-O. This decoupling is a crucial architectural feature that ensures Kubernetes remains flexible and vendor-neutral.

    Is Docker Swarm a Viable Kubernetes Alternative?

    Docker Swarm is Docker's native orchestration engine. It offers a much simpler user experience and a gentler learning curve, as its concepts and CLI are tightly integrated with the Docker ecosystem. For smaller-scale applications or teams without dedicated platform engineers, it can be a viable choice.

    However, for production-grade, large-scale deployments, Kubernetes operates in a different class. It offers far more powerful and extensible features for networking, storage, security, and observability.

    For enterprise-level requirements, Kubernetes is the undisputed industry standard due to its declarative API, powerful auto-scaling, sophisticated networking model, vast ecosystem, and robust self-healing capabilities. Swarm is simpler, but its feature set and community support are significantly more limited.

    When Should You Use Docker Compose Instead of Kubernetes?

    The rule is straightforward: use Docker Compose for defining and running multi-container applications on a single host. It is the ideal tool for local development environments, automated testing in CI/CD pipelines, and deploying simple applications on a single server. Its strength lies in its simplicity for single-node contexts.

    Use Kubernetes when you need to deploy, manage, and scale that application across a cluster of multiple machines. If your requirements include high availability, zero-downtime deployments, automatic load balancing, self-healing, and dynamic scaling, Kubernetes is the appropriate tool for the job.


    Ready to harness the power of Kubernetes without the operational overhead? OpsMoon connects you with the top 0.7% of DevOps engineers to build, manage, and scale your cloud-native infrastructure. Start with a free work planning session to map your path to production excellence. Learn more at OpsMoon.

  • Istio vs Linkerd: A Technical Guide to Choosing Your Service Mesh

    Istio vs Linkerd: A Technical Guide to Choosing Your Service Mesh

    The core difference between Istio and Linkerd is a trade-off between extensibility and operational simplicity. Linkerd is the optimal choice for teams requiring minimal operational overhead and high performance out-of-the-box, while Istio is designed for large-scale enterprises that need a comprehensive feature set and deep customization capabilities, provided they have the engineering resources to manage its complexity. The decision hinges on whether your organization values a "just works" philosophy or requires a powerful, highly configurable networking toolkit.

    Choosing Your Service Mesh: Istio vs Linkerd

    Selecting a service mesh is a critical architectural decision that directly impacts operational workload, resource consumption, and the overall complexity of your microservices platform. The objective is not to identify the "best" service mesh in an absolute sense, but to align the right tool with your organization's specific scale, technical maturity, and operational context.

    This guide provides a technical breakdown of the differences to enable an informed decision. We will begin with a high-level framework to structure the evaluation process.

    At its heart, this is a classic engineering trade-off: feature-richness versus operational simplicity. Istio provides a massive, extensible toolkit but introduces a steep learning curve and significant operational complexity. Linkerd is laser-focused on delivering core service mesh functionality—observability, reliability, and security—with the smallest possible resource footprint.

    A High-Level Decision Framework

    To understand the trade-offs, one must first examine the core design philosophy of each project. Istio, originating from Google and IBM, was engineered to solve complex networking problems at massive scale. This heritage is evident in its architecture, which is built around the powerful but resource-intensive Envoy proxy.

    Linkerd, developed by Buoyant and a graduated CNCF project, was designed from the ground up for simplicity, performance, and security. It utilizes a lightweight, Rust-based "micro-proxy" that is obsessively optimized for resource efficiency and a minimal attack surface. This fundamental architectural divergence in their data planes is the primary driver behind nearly every other distinction, from performance benchmarks to day-to-day operational complexity.

    The following table provides a concise summary to map your team’s requirements to the appropriate tool. Use this as a starting point before we delve into architecture, performance benchmarks, and specific use cases.

    Istio vs Linkerd High-Level Decision Framework

    Criterion Istio Linkerd
    Primary Goal Comprehensive control, policy enforcement, and extensibility Simplicity, security, and performance
    Ideal User Large enterprises with dedicated platform engineering teams Startups, SMBs, and teams prioritizing velocity and low overhead
    Complexity High; steep learning curve with a large number of CRDs Low; designed for zero-config, out-of-the-box functionality
    Data Plane Proxy Envoy (C++, feature-rich, higher resource utilization) Linkerd2-proxy (Rust, lightweight, memory-safe)
    Resource Overhead High CPU and memory footprint Minimal and highly efficient

    Ultimately, this table frames the core debate. Istio offers a solution for nearly any conceivable edge case but imposes a significant complexity tax. Linkerd handles the 80% use case exceptionally well, making it a pragmatic choice for the majority of teams focused on core service mesh benefits without the associated operational burden.

    To fully appreciate the "Istio vs. Linkerd" debate, one must look beyond feature lists and understand the projects' origins. A service mesh is a foundational component of modern microservices infrastructure. The divergent development paths of Istio and Linkerd reveal their fundamental priorities, which is key to making a strategic architectural choice.

    The corporate backing tells a significant part of the story. Istio emerged in 2017 from a collaboration between Google, IBM, and Lyft—organizations confronting networking challenges at immense scale. This enterprise DNA is embedded in its architecture, which prioritizes comprehensive control and near-infinite extensibility.

    Linkerd, conversely, was created by Buoyant and launched in 2016, making it the original service mesh. It has been guided by a community-centric philosophy within the Cloud Native Computing Foundation (CNCF), where it achieved graduated status in July 2021. This milestone signifies proven stability, maturity, and strong community governance, reflecting a design that prioritizes simplicity and operational ease.

    Understanding Adoption Trends and Growth

    The service mesh market is expanding rapidly as microservices adoption becomes standard practice. The industry is projected to grow from $2.925 billion USD in 2025 to almost $50 billion USD by 2035, illustrating the technology's criticality. For more details, see the service mesh market growth report.

    Within this growing market, adoption data reveals a compelling narrative. Early CNCF surveys from 2020 showed Istio with a significant lead, capturing 27% of deployments compared to Linkerd's 12%. This was largely driven by its prominent corporate backers and initial market momentum.

    However, the landscape has shifted. More recent CNCF survey data indicates a significant change in adoption patterns. Linkerd’s selection rate has surged to 73% among respondents, while Istio has maintained a stable 34%. This trend suggests that Linkerd’s focus on a zero-config, "just works" user experience is resonating strongly with a large segment of the cloud-native community.

    Market Positioning and Long-Term Viability

    This data suggests a market bifurcating into two distinct segments. Istio remains the go-to solution for large enterprises with dedicated platform engineering teams capable of managing its complexity to unlock its powerful, fine-grained controls. Its deep integration with Google Cloud further solidifies its position in that ecosystem.

    Linkerd has established itself as the preferred choice for teams that prioritize developer experience, low operational friction, and rapid time-to-value. Its CNCF graduation and rising adoption rates are strong indicators of its long-term viability, driven by a community that values performance and simplicity.

    As the market matures, this divergence is expected to become more pronounced:

    • Istio will continue to be the leading choice for complex, multi-cluster enterprise deployments requiring custom policy enforcement and sophisticated traffic management protocols.
    • Linkerd will solidify its position as the pragmatic, default choice for most teams—from startups to mid-market companies—that need the core benefits of a service mesh without the operational overhead.

    This context is crucial as we move into the technical specifics of Istio versus Linkerd. The choice is not merely about features; it is about aligning with a core architectural philosophy.

    Comparing Istio and Linkerd Architectures

    The architectural decisions behind Istio and Linkerd are the root of nearly all their differences in performance, complexity, and features. These aren't just implementation details; they represent two fundamentally different philosophies on what a service mesh should be. A technical understanding of these distinctions is the first critical step in any serious Istio vs. Linkerd evaluation.

    Istio’s architecture is engineered for maximum control and features, managed by a central, monolithic control plane component named Istiod. Istiod consolidates functionalities that were previously separate components—Pilot for traffic management, Citadel for security, and Galley for configuration—into a single binary. While this simplifies the initial deployment topology, it also concentrates a significant amount of logic into a single, complex process.

    The data plane in Istio is powered by the Envoy proxy. Originally developed at Lyft, Envoy is a powerful, general-purpose L7 proxy that has become an industry standard. Its extensive feature set, including support for numerous protocols and advanced L7 routing capabilities, enables Istio's sophisticated traffic management features like fault injection and complex canary deployments.

    The Istio Sidecar and Ambient Mesh Models

    The traditional Istio deployment model injects an Envoy proxy as a sidecar container into each application pod. This sidecar intercepts all inbound and outbound network traffic, enforcing policies configured via Istiod.

    This official diagram from Istio illustrates the sidecar model, with the Envoy proxy running alongside the application container within the same pod.

    The key implication is that every pod is burdened with its own powerful—and resource-intensive—proxy, which is the primary contributor to Istio's significant resource overhead.

    To address these concerns, Istio introduced Ambient Mesh, a sidecar-less data plane architecture. This model bifurcates proxy responsibilities:

    • A shared, node-level proxy named ztunnel handles L4 functions like mTLS and authentication. It is a lightweight, Rust-based component that serves all pods on a given node.
    • For services requiring advanced L7 policies, an optional, Envoy-based waypoint proxy can be deployed for that specific service account.

    This model significantly reduces the per-pod resource cost, particularly for services that do not require the full suite of Envoy's L7 capabilities.

    Linkerd’s Minimalist and Purpose-Built Design

    Linkerd’s architecture embodies a "less is more" philosophy. It was designed from the ground up for simplicity, security, and performance, deliberately avoiding feature bloat. This is most evident in its data plane.

    Instead of the general-purpose Envoy, Linkerd employs its own lightweight proxy written in Rust. This "micro-proxy" is purpose-built and obsessively optimized for a single function: being the fastest, most secure service mesh proxy possible. Its memory and CPU footprint are minimal. Because Rust provides memory safety guarantees at compile time, Linkerd's data plane has a significantly smaller attack surface—a critical attribute in modern cloud native application development.

    The choice of proxy is the single most significant architectural differentiator. Istio selected Envoy for its comprehensive feature set, accepting the attendant complexity and resource cost. Linkerd built its own proxy to optimize for speed and security, deliberately limiting its scope to deliver the core value of a service mesh with ruthless efficiency.

    Linkerd's control plane follows the same minimalist principle, comprising several small, focused components, each with a single responsibility. This modularity makes it far easier to understand, debug, and operate than Istio's consolidated Istiod. The installation process is renowned for its simplicity, often taking only minutes to enable core features like automatic mTLS cluster-wide.

    This lean design makes Linkerd exceptionally resource-efficient. Its control plane can operate on as little as 200MB of RAM, a stark contrast to Istio's typical 1-2GB requirement. For teams with constrained resource budgets or large numbers of services, this translates directly to lower infrastructure costs and reduced operational complexity. The trade-offs are clear: Istio provides near-limitless configurability at the cost of complexity, while Linkerd delivers speed and simplicity by focusing on essential functionality.

    Evaluating Performance and Resource Overhead

    Performance is a non-negotiable requirement for production systems. When evaluating Istio vs. Linkerd, the overhead introduced by the mesh directly impacts application latency and infrastructure costs. A data-driven analysis reveals significant differences in how each mesh handles production-level traffic and consumes system resources.

    This image visualizes the architectural contrast—Istio’s more monolithic, feature-rich design versus Linkerd’s lightweight, distributed approach.

    This fundamental difference in philosophy is the primary driver of the performance and resource utilization gaps we will now examine.

    Analyzing Latency Under Production Loads

    In performance analysis, 99th percentile (p99) latency is a critical metric, as it represents the worst-case user experience. Benchmarks demonstrate a clear divergence between Istio and Linkerd, particularly as traffic loads increase to production levels.

    At a low load of 20 requests per second (RPS), both meshes introduce negligible overhead and perform comparably to a no-mesh baseline. However, the performance profile changes dramatically under higher load.

    At 200 RPS, Istio's sidecar model begins to exhibit strain, adding 22.83 milliseconds of latency compared to Linkerd. Even Istio's newer Ambient Mesh model adds 18.5 milliseconds of latency over the baseline. The performance gap widens significantly at a more realistic production load of 2000 RPS.

    At this level, Linkerd's performance remains remarkably stable. It delivers 163 milliseconds less p99 latency than Istio's sidecar model and maintains an 11.2 millisecond advantage over Istio Ambient. These metrics underscore a design optimized for high-throughput, low-latency workloads. For a detailed review, you can examine the methodology behind these performance benchmarks.

    The key takeaway is that under load, Linkerd's purpose-built proxy maintains a stable, low-latency profile. Istio’s feature-rich Envoy proxy, in contrast, introduces a significant performance tax. For latency-sensitive applications, this difference is a critical consideration.

    To provide a clear, actionable comparison, here is a summary of recent benchmark data.

    Latency (p99) and Resource Consumption Benchmark

    This table breaks down the performance and resource overhead at different request rates (RPS), providing a clear picture of expected real-world behavior.

    Metric Load (RPS) Linkerd Istio (Sidecar) Istio (Ambient)
    p99 Latency 200 +2.5ms +25.33ms +21ms
    p99 Latency 2000 +5.3ms +168.3ms +16.5ms
    CPU Usage 2000 125 millicores 275 millicores 225 millicores
    Memory Usage 2000 35 MB 75 MB 60 MB

    As the data shows, Linkerd consistently demonstrates lower latency and consumes significantly fewer resources, especially as load increases. This efficiency directly impacts both application performance and infrastructure costs.

    Comparing CPU and Memory Consumption

    Beyond latency, the resource footprint of a service mesh directly affects cloud expenditure and pod density per node. Here, the architectural differences between Istio and Linkerd are most stark. Linkerd is consistently leaner, typically consuming 40-60% less CPU and memory than Istio in comparable deployments.

    This efficiency is a direct result of its minimalist design and the Rust-based micro-proxy. The practical implications are significant:

    • Linkerd Control Plane: Requires minimal resources, consuming approximately 200-300 megabytes of memory. This makes it ideal for resource-constrained environments or edge deployments.
    • Istio Control Plane: Requires at least 1 gigabyte of memory to start, often scaling to 2 gigabytes or more in production environments. This reflects the overhead of the monolithic istiod binary.

    Operationally, this means you can run more application pods on the same nodes with Linkerd, leading to direct infrastructure cost savings. For organizations managing hundreds or thousands of services, this efficiency represents a major operational advantage. Effective resource management requires robust monitoring; for more on this topic, see our guide to Prometheus service monitoring.

    Practical Impact on Your Infrastructure

    The data leads to a clear decision framework based on your performance budget and operational realities.

    Linkerd's lean footprint and superior latency make it the optimal choice for:

    • Latency-sensitive applications where every millisecond is critical.
    • Environments with tight resource constraints or a need for high-density cluster packing.
    • Teams that value operational simplicity and aim to minimize infrastructure costs.

    Istio's higher resource consumption may be an acceptable trade-off if your organization:

    • Requires its extensive feature set for complex traffic routing and security policies not available in Linkerd.
    • Has a dedicated platform team with the expertise to tune and manage its performance characteristics.
    • Operates in a large enterprise where its advanced capabilities justify the associated overhead.

    Ultimately, the performance data is unambiguous. Linkerd excels in speed and efficiency, providing a production-ready mesh with minimal overhead. Istio offers unparalleled power and flexibility, but at a higher cost in both latency and resource consumption.

    Understanding Operational Complexity and Ease of Use

    Beyond performance benchmarks and architectural diagrams, the most significant differentiator between Istio and Linkerd is the day-to-day operational experience. This encompasses installation, configuration, upgrades, and debugging. The two meshes embody fundamentally different philosophies, and this choice directly impacts your team's workload and time-to-value.

    Istio has a well-deserved reputation for a steep learning curve. Its power derives from a massive and complex configuration surface area, managed through a sprawling set of Custom Resource Definitions (CRDs) such as VirtualService, DestinationRule, and Gateway. While this provides fine-grained control, it demands deep expertise and significant investment in authoring and maintaining complex YAML manifests.

    The Installation and Configuration Experience

    The philosophical divide is apparent from the initial installation. Linkerd's installation is famously simple, often requiring only a few CLI commands to deploy a fully functional mesh with automatic mutual TLS (mTLS) enabled by default.

    # Example: Linkerd CLI installation
    # Step 1: Install the CLI
    curl -sL https://run.linkerd.io/install | sh
    # Step 2: Run pre-installation checks
    linkerd check --pre
    # Step 3: Install the control plane
    linkerd install | kubectl apply -f -
    

    Linkerd's "just works" approach means you can inject the proxy into workloads and immediately gain observability and security benefits without complex configuration.

    Istio, in contrast, requires a more deliberate and configured setup. While the installation process has improved, enabling core features still involves applying multiple YAML manifests. Configuring traffic ingress through an Istio Gateway, for example, requires creating and wiring together several interdependent resources (Gateway, VirtualService). For teams new to service mesh, this presents a significant initial hurdle.

    Linkerd's philosophy is to be secure and functional by default. Istio's philosophy is to be configurable for any use case, which places the onus of ensuring security and functionality squarely on the operator. This distinction is the primary source of operational friction associated with Istio.

    Managing Day-to-Day Operations

    The operational burden extends beyond installation. For ongoing management, Linkerd utilizes Kubernetes annotations for most per-workload configurations. This approach feels natural to Kubernetes operators, as the configuration resides directly with the application it modifies.

    Istio relies on its global CRDs, which decouples configuration from the application. While this offers centralized control, it also introduces a layer of indirection and complexity. Debugging a traffic routing issue may require tracing dependencies across multiple CRDs, which can be challenging. The efficiency of a service mesh is directly tied to its integration with CI/CD; therefore, understanding what a CI/CD pipeline entails is critical for managing this complexity at scale.

    This represents a major decision point for any organization. Istio's complex architecture demands significant expertise, making it powerful but daunting. Linkerd’s streamlined design and simpler feature set make it far more approachable, enabling teams to achieve value faster with a much smaller operational investment. For further reading, see these additional insights on Istio vs Linkerd complexity.

    Observability Out of the Box

    Another key area where operational differences are apparent is observability. Linkerd includes a pre-configured set of Grafana dashboards that provide immediate visibility into the "golden signals" (success rate, requests/second, and latency) for all meshed services. This is a significant advantage for teams needing to diagnose issues quickly without becoming observability experts.

    Istio can integrate with Prometheus and Grafana to provide similar telemetry, but it requires more manual configuration. The operator is responsible for configuring data collection, building dashboards, and ensuring all components are properly integrated.

    Again, this places a heavier operational load on the team, trading immediate value for greater long-term customization. This pragmatic difference often makes Linkerd the preferred choice for teams with limited resources, while Istio appeals to organizations with established platform engineering teams prepared to manage its advanced capabilities.

    Comparing Security and Traffic Management Features

    Beyond architecture, the practical differences between Istio and Linkerd are most evident in their security and traffic management capabilities. Their distinct philosophies directly shape how you secure services and route traffic.

    Istio is the swiss-army knife, offering an exhaustive set of granular controls. Linkerd is purpose-built for secure simplicity, providing the most critical 80% of functionality with 20% of the effort.

    This contrast is not merely academic; it is a core part of the Istio vs. Linkerd decision that dictates your operational model for network policy and control.

    Differentiating Security Models

    Security is non-negotiable. Both meshes provide the cornerstone of a zero-trust network: mutual TLS (mTLS), which encrypts all service-to-service communication. However, their implementation approaches are starkly different.

    Linkerd's model is "secure by default." The moment a workload is injected into the mesh, mTLS is enabled automatically. No configuration files or policies are required. This is a massive operational benefit, as it makes misconfiguration nearly impossible and ensures a secure baseline from the start.

    Istio treats security as a powerful, configurable feature. You must explicitly define PeerAuthentication policies to enable mTLS and then layer AuthorizationPolicy resources on top to define service-to-service communication rules. While this offers incredibly fine-grained control, it places the full responsibility for securing the mesh on the operator. A strong security posture begins with fundamentals, which we cover in our guide on Kubernetes security best practices.

    Linkerd provides robust, out-of-the-box security with zero configuration. Istio delivers a policy-driven security engine that is immensely powerful but requires expertise to configure and manage correctly.

    Advanced Traffic Management and Routing

    In the domain of traffic management, Istio’s extensive feature set, enabled by the Envoy proxy, provides a clear advantage for complex enterprise use cases.

    Using its VirtualService and DestinationRule CRDs, operators can implement sophisticated routing patterns:

    • Precise Traffic Shifting: Execute canary releases by routing exactly 1% of traffic to a new version, with the ability to incrementally increase the percentage.
    • Request-Level Routing: Make routing decisions based on HTTP headers (e.g., User-Agent), cookies, or URL paths, enabling fine-grained A/B testing or routing mobile traffic to a dedicated backend.
    • Fault Injection: Programmatically inject latency or HTTP errors to test service resilience and identify potential cascading failures before they occur in production.

    Linkerd aligns with the Service Mesh Interface (SMI), a standard set of APIs for Kubernetes service meshes. It handles essential use cases like traffic splitting for canary deployments, as well as automatic retries and timeouts, with simplicity and efficiency.

    However, Linkerd deliberately avoids the deep, request-level inspection and fault injection capabilities native to Istio. This is the core trade-off. If your primary requirement is reliable traffic splitting for progressive delivery, Linkerd is a simple and effective choice. If you need to implement complex routing logic based on L7 data or perform rigorous chaos engineering experiments, Istio's advanced toolkit is the superior option.

    How to Make the Right Choice for Your Team

    After analyzing the technical details, performance benchmarks, and operational realities of Istio and Linkerd, the decision framework becomes clear. The goal is not to select a universal winner but to match a service mesh's philosophy to your team's specific requirements and long-term roadmap.

    Linkerd's value proposition is its straightforward delivery of core service mesh essentials—observability, security, and traffic management—with exceptional performance and a minimal operational footprint. It is secure by default and famously easy to install, making it an ideal choice for teams that need to move quickly without incurring technical debt.

    If your primary goal is to implement mTLS, gain visibility into service behavior, and perform basic traffic splitting without a significant learning curve, Linkerd is the pragmatic and efficient choice.

    Ideal Scenarios for Linkerd

    Linkerd excels in the following contexts:

    • Startups and SMBs: For teams without a dedicated platform engineering function, Linkerd's low operational overhead is a critical advantage. It enables smaller teams to adopt a service mesh without requiring a full-time specialist.
    • Performance-Critical Applications: For any service where latency is a primary concern, Linkerd’s Rust-based micro-proxy offers a clear, measurable performance advantage under load.
    • Teams New to Service Mesh: Its "just works" approach provides an excellent on-ramp to service mesh concepts. You realize value almost immediately, which helps build momentum for tackling more advanced networking challenges.

    On the other side, Istio's power lies in its massive feature set and deep customizability. It is designed for complex, heterogeneous environments where granular control over all service-to-service communication is paramount.

    Its advanced policy engine and traffic management features, such as fault injection and header-based routing, are often non-negotiable for large enterprises with stringent compliance requirements or complex multi-cluster topologies.

    When to Invest in Istio

    Choosing Istio is a strategic investment that is justified in these scenarios:

    • Large Enterprises with Dedicated Platform Teams: If you have the engineering resources to manage its complexity, you can leverage its full potential for advanced security and traffic engineering.
    • Complex Compliance and Security Needs: Istio's fine-grained authorization policies are essential for enforcing zero-trust security in highly regulated industries.
    • Multi-Cluster and Hybrid Environments: For distributed infrastructures, Istio's robust multi-cluster support provides a unified control plane for managing traffic and policies across different environments.

    Ultimately, the choice comes down to a critical assessment of your team's needs and capabilities. Do you genuinely require the exhaustive feature set of Istio, and do you have the operational maturity to manage it effectively? Or will Linkerd's focused, high-performance toolkit meet your current and future requirements? A candid evaluation of your team's bandwidth and your application's actual needs is essential before committing to a solution.


    Selecting and implementing the right service mesh is a significant undertaking. OpsMoon specializes in helping teams evaluate, deploy, and manage cloud-native technologies like Istio and Linkerd. Our engineers can guide you through a proof-of-concept, accelerate your path to production, and ensure your service mesh delivers tangible value. Connect with us today to schedule a free work planning session and build a clear path forward.