Sourcing an elite technical consultant doesn't start with firing off job posts. That's a final-stage tactic, not an opening move. The process begins by creating a precise technical blueprint. This is not a glorified job description; it's a detailed specification document that quantifies success within your operational context. Executing this correctly is the primary filter that attracts specialists capable of solving your specific engineering challenges.
Crafting Your Technical Blueprint for the Right Consultant
Forget posting a vague request for a "DevOps Expert." To attract top-tier consultants, you must construct a detailed profile that maps high-level business objectives to tangible, measurable technical requirements. This blueprint, which often becomes the core of a Statement of Work (SOW), is the foundational layer of your entire acquisition process.
Its importance cannot be overstated. It establishes explicit expectations from day one, acting as a high-pass filter to disqualify consultants who lack the specific expertise required. This ensures the engaged expert is aligned with measurable business outcomes from the moment they start.
The primary failure mode in consultant engagements is an ambiguous definition of requirements. Vague goals lead directly to scope creep and make success impossible to measure. The only effective countermeasure is a significant upfront investment in building a rigorous technical and operational profile.
Translate Business Goals into Technical Imperatives
First, you must translate business pain points into the technical work required to resolve them. Abstract goals like "improve system stability" are not actionable. They must be decomposed into specific, quantifiable engineering metrics. This level of clarity provides a consultant with an exact problem statement.
Here are concrete examples of this translation process:
- Business Goal: Reduce customer-facing downtime and improve system reliability.
- Technical Imperative: Increase Service Level Objective (SLO) adherence from 99.9% to 99.95% within two quarters.
- Associated Metric: Reduce Mean Time to Resolution (MTTR) for P1 incidents by 30%, measured against the previous six-month average.
- Business Goal: Accelerate the software delivery lifecycle to increase feature velocity.
- Technical Imperative: Transition from a weekly monolithic deployment schedule to an on-demand, per-service deployment model.
- Associated Metric: Decrease the median CI/CD pipeline execution time from 45 minutes to under 15 minutes.
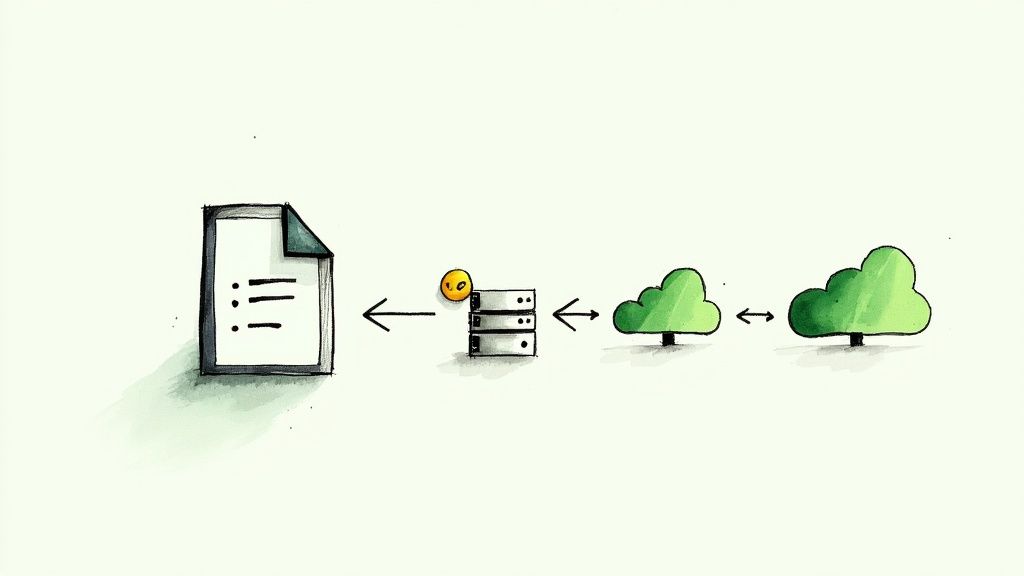
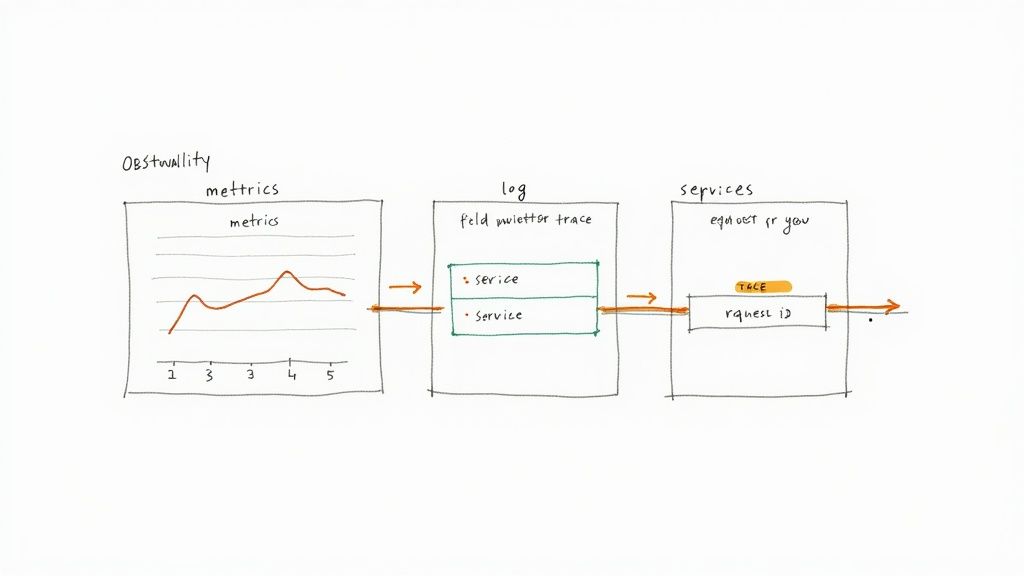
- Business Goal: Enhance system observability to preempt outages.
- Technical Imperative: Implement a comprehensive observability stack leveraging OpenTelemetry.
- Associated Metric: Achieve 95% trace coverage and structured logging for all Tier-1 microservices.
When you frame requirements in the language of metrics, you provide a non-ambiguous "definition of done." A qualified consultant can parse these imperatives and immediately determine if their skill set is a direct match for the technical challenge.
Map Objectives to Specific Tech Stack Skills
With the what and why defined, you must specify the how. This involves mapping your technical imperatives directly to the required competencies for your specific tech stack. This moves the process from high-level objectives to the granular, hands-on expertise you need to source.
For example, if the objective is to improve infrastructure scalability and reliability, the required skills matrix might look like this:
Objective: Automate infrastructure provisioning to handle a 50% spike in user traffic with zero manual intervention.
- Required Skills:
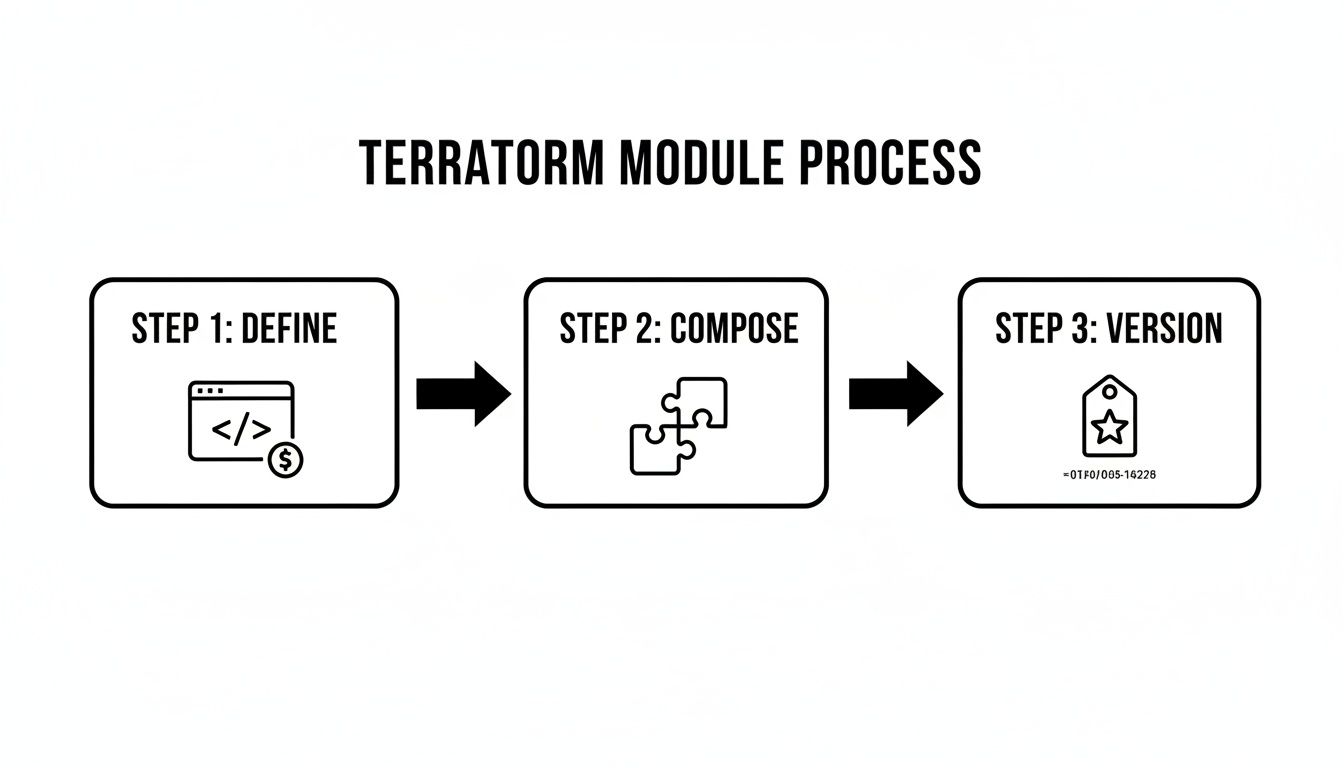
- Infrastructure as Code (IaC): Expert-level proficiency in Terraform is non-negotiable. The candidate must demonstrate experience creating reusable, version-controlled modules and managing complex state files across multiple environments (e.g., dev, staging, prod) using Terragrunt or similar wrappers.
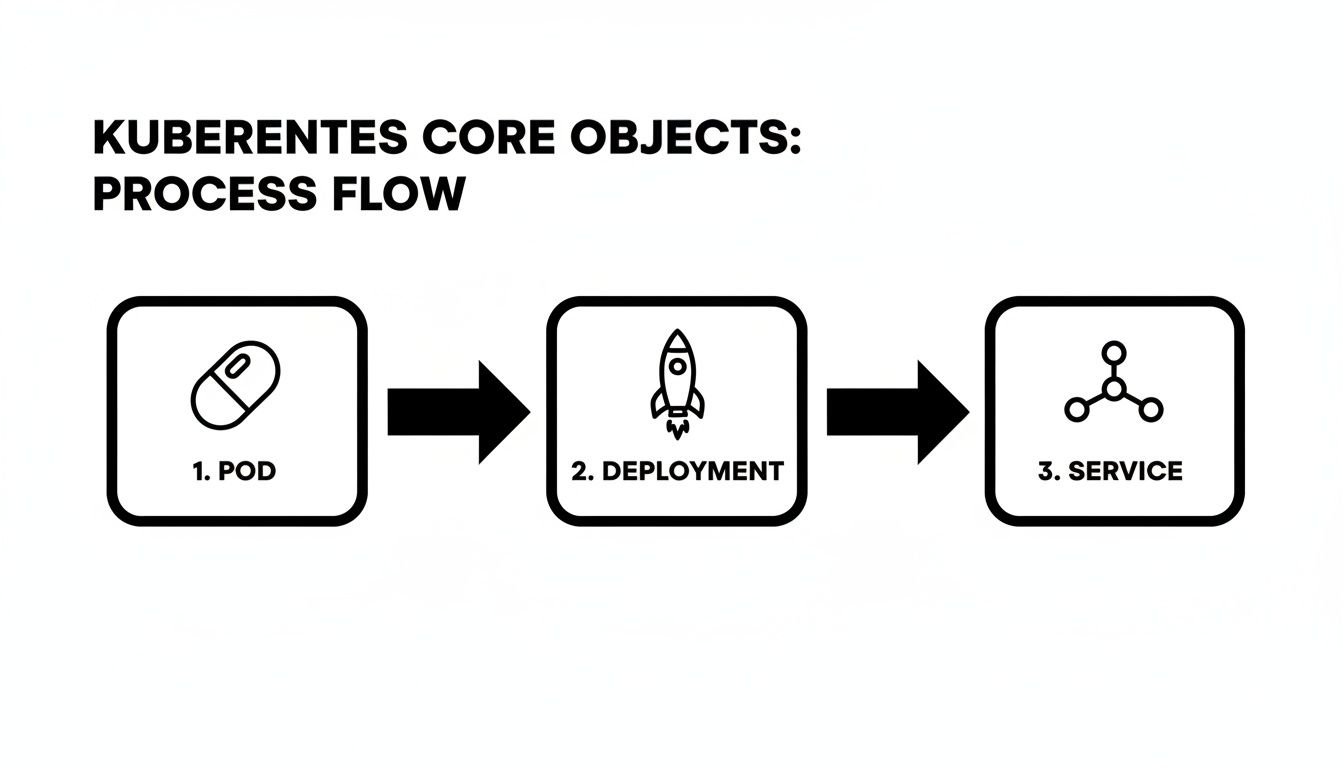
- Container Orchestration: Advanced operational knowledge of Kubernetes, including demonstrable experience authoring custom operators or CRDs, building production-grade Helm charts, and configuring Horizontal Pod Autoscalers (HPA) and Cluster Autoscalers.
- Cloud Provider: Deep proficiency with AWS services, specifically EKS, with a strong command of VPC networking (e.g., CNI plugins like Calico or Cilium) and granular IAM for Service Accounts (IRSA) to build secure, multi-tenant clusters.
This level of detail ensures you are not just searching for someone who "knows Kubernetes." You are targeting a specialist who has solved analogous problems within a similar technical ecosystem. This detailed technical blueprint becomes the most powerful filter in your consultant talent acquisition strategy, ensuring every interaction is highly targeted and productive.
How to Find and Engage Top-Tier Technical Consultants
The best technical consultants are rarely active on mainstream job boards. They are passive talent—deeply engaged in solving complex problems, contributing to open-source projects, or leading discussions in high-signal technical communities. To engage them, you must operate where they do, adopting a proactive, targeted sourcing model.
This requires a fundamental shift from reactive recruiting to proactive talent intelligence. Instead of casting a wide net with a generic job post, you must become a technical sourcer, capable of identifying signals of genuine expertise in specialized environments.
Go Beyond LinkedIn Sourcing
While LinkedIn is a useful directory, elite technical talent validates their expertise in specialized online forums. Your sourcing strategy must expand to these high-signal platforms where technical credibility is earned through demonstrated skill, not self-proclaimed titles.
- GitHub and GitLab: An active repository is a public-facing portfolio of work. Look for consistent, high-quality contributions, well-documented code, and evidence of collaboration through pull requests and issue resolution. A consultant who is a core maintainer of a relevant open-source tool is providing verifiable proof of their expertise.
- Technical Communities: Immerse yourself in platforms like the CNCF Slack channels, domain-specific subreddits (e.g., r/devops, r/sre), or specialized mailing lists. Monitor discussions to identify individuals who provide deeply insightful answers, share nuanced technical knowledge, and command peer respect.
- Specialized Freelance Platforms: Move beyond generalist marketplaces. Platforms like Toptal and Braintrust, along with highly curated agencies, perform rigorous technical vetting upfront. This significantly reduces your screening overhead. These platforms command a premium, but the talent quality is typically much higher. Explore options for specialized DevOps consulting firms in our comprehensive guide.
This multi-channel approach is critical for building a qualified candidate pipeline. The global talent acquisition market is projected to grow from USD 312.78 billion in 2024 to roughly USD 563.79 billion by 2031, driven precisely by this need for specialized recruitment methodologies.
Sourcing Channel Effectiveness for Technical Consultants
Effective sourcing requires understanding the trade-offs between candidate quality, time-to-engage, and cost for each channel. This table breaks down the typical effectiveness for specialized DevOps and SRE roles.
| Sourcing Channel | Typical Candidate Quality | Average Time-to-Engage | Cost Efficiency |
|---|---|---|---|
| Specialized Agencies | Very High | 1-2 Weeks | Low (High Premiums) |
| Curated Freelance Platforms | High | 2-4 Weeks | Medium |
| Technical Communities (Slack/Reddit) | High | 4-8 Weeks | High (Time Intensive) |
| GitHub/GitLab | Very High | 4-12+ Weeks | Very High (Time Intensive) |
| Medium to High | 2-6 Weeks | Medium | |
| Referrals | Very High | 1-4 Weeks | Very High |
A blended sourcing strategy is optimal. Leverage referrals and specialized platforms for immediate, time-sensitive needs, while cultivating a long-term talent pipeline through continuous engagement in open-source and technical communities.
Leverage AI-Powered Sourcing Tools
Manually parsing these channels is inefficient. Modern AI-powered sourcing tools can dramatically accelerate this process, identifying candidates with specific, rare skill combinations that are nearly impossible to find with standard boolean searches.
For example, sourcing a Platform Engineer with production experience in both Google's Anthos and legacy Jenkins pipeline migrations via a LinkedIn search would likely yield zero results. An AI tool, however, can search based on conceptual skills and public code contributions, pinpointing qualified candidates in hours. These tools analyze GitHub commits, conference presentations, and technical blog posts to build a holistic profile of a candidate's applied expertise.
Craft Outreach That Actually Gets a Reply
Once a potential consultant is identified, the initial outreach is your only chance to bypass their spam filter. Top engineers are inundated with generic recruiter messages. Your communication must stand out by being authentic, technically specific, and problem-centric.
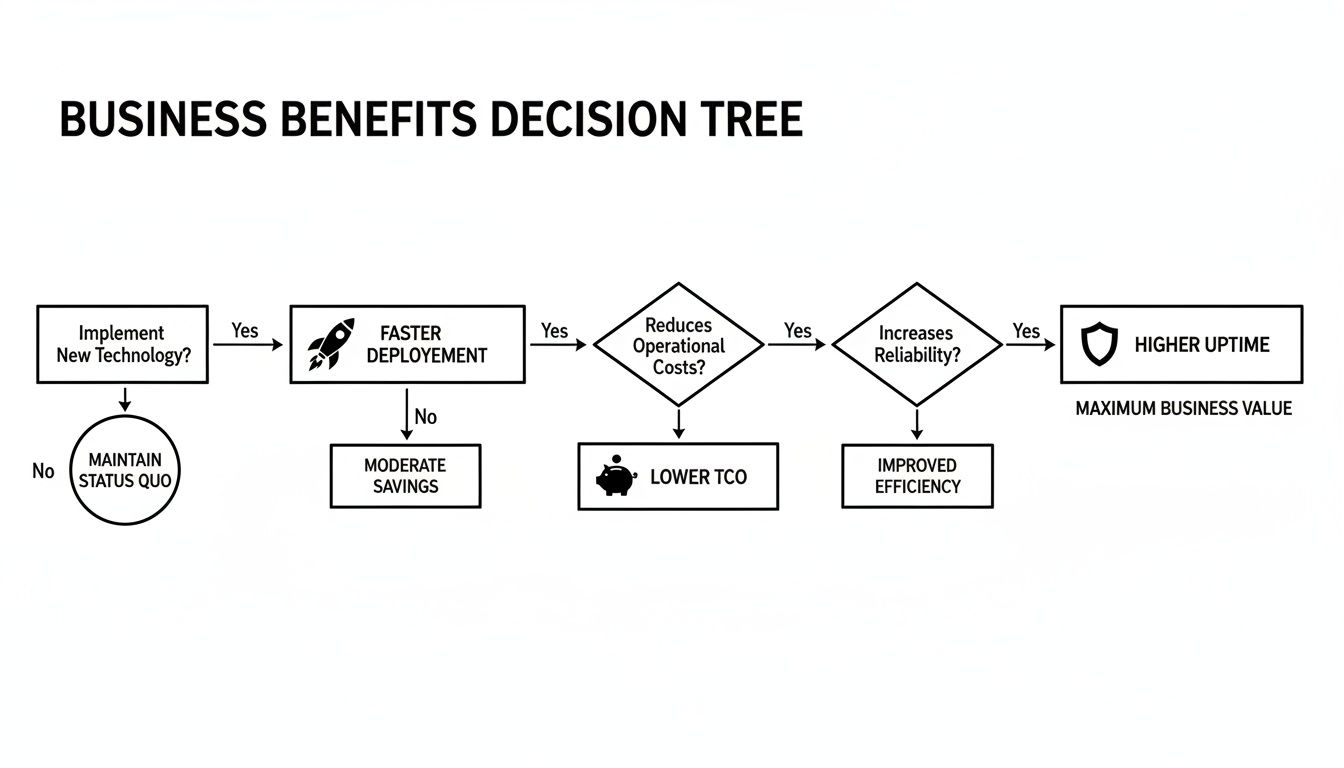
The chart below visualizes the high-impact goals that motivate top-tier consultants. Your outreach must speak this language.
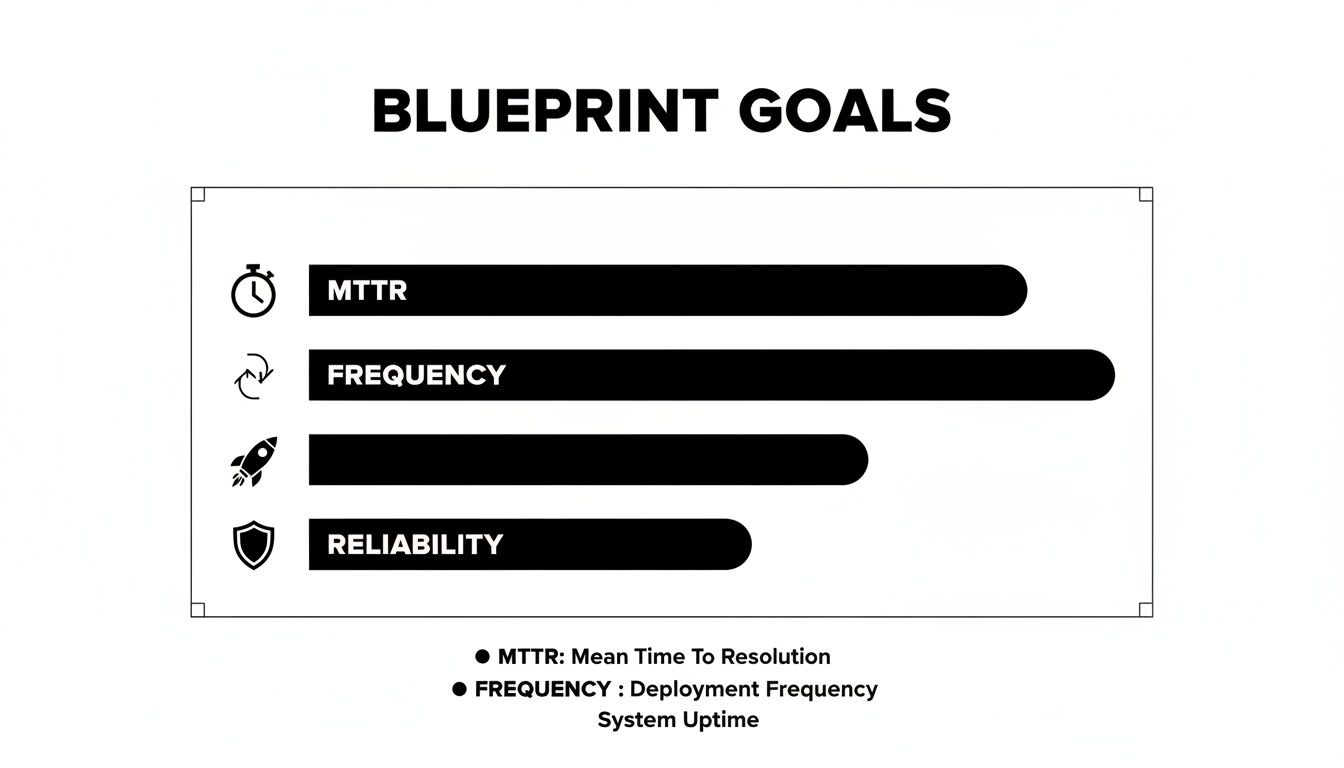
These blueprint goals—improving MTTR, deployment frequency, and reliability—are the technical challenges you need to articulate.
Your outreach should read like a message from one technical peer to another, not a generic hiring request. Lead with the compelling engineering problem you are trying to solve, not a job title.
This three-part structure is highly effective:
- Demonstrate Specific Research: Reference a specific piece of their work—an open-source project, a technical article, or a conference talk. Example: "I was impressed by the idempotency handling in your Terraform module for managing EKS node groups on GitHub…" This proves you're not mass-messaging.
- Present the Problem, Not the Position: Frame the opportunity as a specific technical challenge. Example: "…We're architecting a solution to reduce our CI/CD pipeline duration from 40 minutes to under 10, and your expertise in build parallelization and caching strategies seems directly applicable."
- Make a Clear, Low-Friction Ask: Do not request a resume or a formal interview. The initial ask should be a low-commitment technical discussion. Example: "Would you be open to a 15-minute call next week to exchange ideas on this specific problem?"
A solid understanding the contingent workforce is crucial for framing contracts correctly from the start. This entire outreach methodology respects the consultant's time and expertise, initiating a peer-level technical dialogue rather than a standard recruitment cycle.
A promising resume is merely an entry point. The critical phase is verifying that a candidate possesses the requisite technical depth to execute. This is where you must separate true experts from those who can only articulate theory. Without a structured, objective vetting framework, you are simply relying on intuition—a high-risk strategy. A standardized assessment process is non-negotiable; it mitigates bias and ensures every candidate is evaluated against the same high technical bar.

The key is to design assessments that mirror the real-world problems your team encounters. Generic algorithm tests (e.g., FizzBuzz) or abstract whiteboard problems are useless. They do not predict a consultant's ability to debug a failing Kubernetes pod deployment at 2 AM. You need hands-on, scenario-based assessments that directly test the skills specified in your Statement of Work (SOW).
Designing Relevant Scenario-Based Assessments
The most effective technical assessments are custom-built to reflect your specific environment. Creating a problem that feels authentic provides a much clearer signal on a consultant's thought process, communication under pressure, and raw technical aptitude.
Here are two examples of effective, role-specific assessments:
-
For a Platform Engineer: Present a system design challenge grounded in your reality. For instance, "Design a scalable, multi-tenant CI/CD platform on AWS EKS for an organization with 50 microservices. Present an architecture that addresses security isolation between tenants, cost-optimization for ephemeral build agents, and developer self-service. Specify the core Kubernetes components, controllers, and AWS services you would use, and diagram their interactions."
-
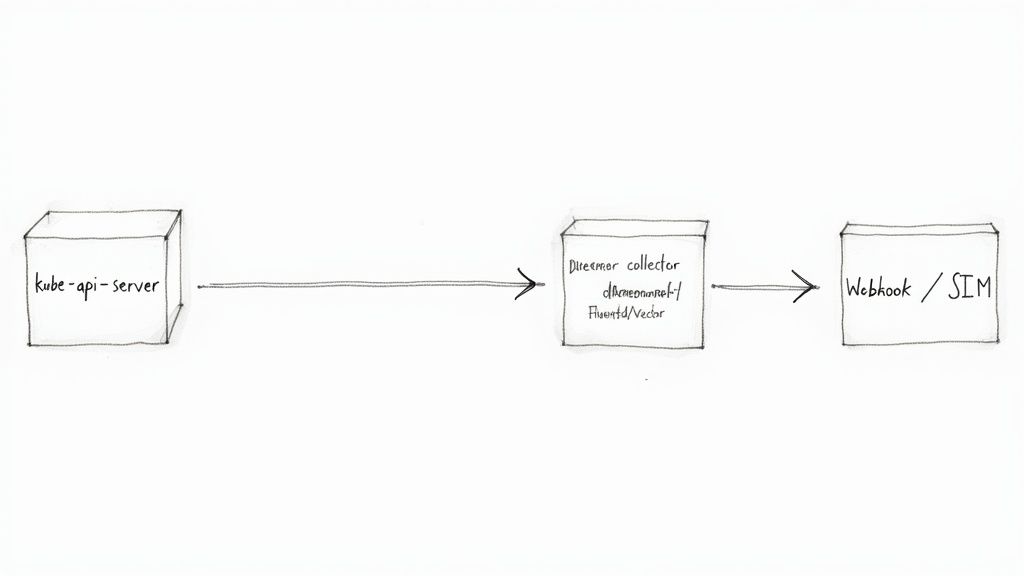
For an SRE Consultant: Conduct a live, hands-on troubleshooting exercise. Provision a sandboxed environment with a pre-configured failure scenario (e.g., a misconfigured Prometheus scrape target, a memory leak in a container, or a slow database query caused by an inefficient index). Grant them shell access and observe their diagnostic methodology. Do they start with
kubectl logs? Do they query metrics first? How effectively do they articulate their debugging process and hypotheses?
This practical approach assesses their applied skills, not just their theoretical knowledge. You get to observe how they solve problems, which is invariably more valuable than knowing what they know.
Implementing a Technical Interview Scorecard
A standardized scorecard is your most effective tool for eliminating "gut feel" hiring decisions. It compels every interviewer to evaluate candidates against the exact same criteria, all of which are derived directly from the SOW. This data-driven methodology improves hiring quality and makes the entire process more defensible and equitable.
A scorecard for a senior DevOps consultant might include these categories, each rated from 1-5:
| Competency Category | Description | Key Evaluation Points |
|---|---|---|
| Infrastructure as Code (IaC) | Proficiency with tools like Terraform or Pulumi. | Does their code demonstrate modularity and reusability? Can they articulate best practices for managing state and secrets in a team environment? |
| Container Orchestration | Deep knowledge of Kubernetes and its ecosystem. | How do they approach RBAC and network policies for cluster security? Can they design effective autoscaling strategies for both pods and nodes? Do they understand the trade-offs between Helm and Kustomize? |
| CI/CD Pipeline Architecture | Ability to design and optimize build/release workflows. | Can they articulate the pros and cons of different pipeline orchestrators (e.g., Jenkins vs. GitHub Actions)? How do they approach securing the software supply chain (e.g., image signing, dependency scanning)? |
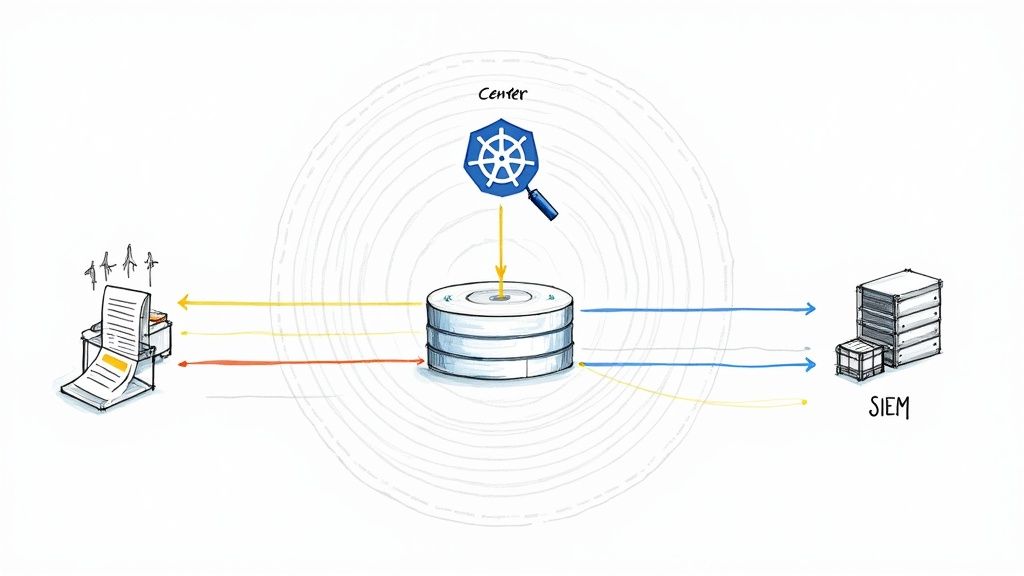
| Observability & Monitoring | Expertise in tools like Prometheus, Grafana, and Jaeger. | How do they define and implement SLOs and error budgets? Can they leverage distributed tracing to pinpoint latency in a microservices architecture? |
| Problem-Solving & Communication | How they approach ambiguity and explain technical concepts. | Do they ask precise clarifying questions before attempting a solution? Can they explain a complex technical solution to a non-technical stakeholder? |
Using a scorecard ensures all feedback is structured and directly relevant to the role's requirements. By 2025, generative AI and talent-intelligence platforms will become central to corporate hiring. Organizations are already investing in data-driven sourcing to hire faster without sacrificing quality. A well-designed scorecard provides the structured data needed to power these systems.
Beyond the Technical: Assessing Consulting Acumen
An elite consultant is more than just a technical executor; they must be a strategic partner and a force multiplier. Your vetting process must evaluate their consulting skills—the competencies required to drive meaningful change within an organization.
A consultant's true value is measured not just by the technical problems they solve, but by their ability to upskill your team, influence architectural decisions, and leave your organization more capable than they found it.
To assess these non-technical skills, ask targeted, behavior-based questions:
- "Describe a time you had to gain buy-in for a significant technical change from a resistant engineering team. What was your strategy?"
- "Walk me through a project where the initial requirements were ambiguous or incomplete. How did you collaborate with stakeholders to define the scope and establish a clear definition of 'done'?"
- "What specific mechanisms do you use to ensure successful knowledge transfer to the full-time team before an engagement concludes?"
Their responses will reveal their ability to navigate organizational dynamics and manage stakeholder expectations—skills that are often as critical as their technical proficiency. Partnering with a premier DevOps consulting company can provide access to talent where this balance of technical and consulting acumen is already a core competency.
Structuring Contracts and Fair Compensation Models
After identifying a top-tier consultant who has successfully passed your rigorous technical vetting, the next critical step is to formalize the engagement. This process is not merely about rate negotiation; it is about constructing a clear, equitable, and legally sound agreement that mitigates risk and aligns all parties for success.
A well-architected contract eliminates ambiguity and synchronizes expectations from day one. The entire consultant talent acquisition process can fail at this stage. A poorly defined or one-sided agreement is a significant red flag that will cause elite candidates to disengage, regardless of the strength of the technical challenge.
Choosing the Right Engagement Model
The compensation model directly influences a consultant's incentives and your ability to forecast budgets. The choice of model should be dictated by the nature of the work.
-
Hourly/Daily Rate: This is the most flexible model, ideal for open-ended projects, staff augmentation, or engagements where the scope is expected to evolve. You pay for precisely the time consumed, making it perfect for troubleshooting, advisory work, or initial discovery phases.
-
Fixed-Project Fee: This model is best suited for projects with a well-defined Statement of Work (SOW) and clear, finite deliverables. You agree on a single price for the entire outcome (e.g., "migrate our primary application's CI/CD pipeline from Jenkins to GitHub Actions"). This provides cost predictability and incentivizes the consultant to deliver efficiently.
-
Retainer: A retainer is used to secure a consultant's availability for a predetermined number of hours per month. It is ideal for ongoing advisory services, system maintenance, or ensuring an expert is on-call for critical incident response. This model guarantees priority access to their expertise.
A common error is applying the wrong model to a project. Attempting to use a fixed fee for an exploratory R&D initiative, for example, will inevitably lead to difficult scope negotiations. Always align the engagement model with the project's characteristics.
Consultant Engagement Model Comparison
This matrix breaks down the models to help you select the most appropriate one based on your project goals, budget constraints, and need for flexibility.
| Model | Best For | Key Advantage | Potential Risk |
|---|---|---|---|
| Hourly/Daily Rate | Evolving scope, advisory, staff augmentation | High flexibility, pay for exact work done | Unpredictable final cost, less incentive for speed |
| Fixed-Project Fee | Clearly defined projects with specific deliverables | Budget certainty, incentivizes consultant efficiency | Inflexible if scope changes, requires detailed SOW |
| Retainer | Ongoing support, advisory, on-call needs | Guaranteed availability of expert talent | Paying for unused hours if demand is low |
The optimal model aligns incentives and creates a mutually beneficial structure for both your organization and the consultant.
Setting Fair Market Rates for Niche Skills
Compensation for senior DevOps, SRE, and Platform Engineering consultants is high because their skills are specialized and in extreme demand. As of 2024, rates in North America vary significantly based on expertise and the complexity of the technology stack.
For a senior consultant with deep, demonstrable expertise in Kubernetes, Terraform, and a major cloud platform (AWS, GCP, or Azure), you should budget for rates within these ranges:
- Hourly Rates: $150 – $250+ USD
- Daily Rates: $1,200 – $2,000+ USD
Rates at the upper end of this spectrum are standard for specialists with highly niche skills, such as implementing a multi-cluster service mesh with Istio or Linkerd, or developing a sophisticated FinOps strategy to optimize cloud spend. Always benchmark against current market data, not historical rates.
Essential Clauses for a Rock-Solid Contract
Your consulting agreement is a critical risk management instrument. While legal counsel should always conduct a final review, several non-negotiable clauses are essential to protect your organization.
A contract should be a tool for clarity, not a weapon. Its primary purpose is to create a shared understanding of responsibilities, deliverables, and boundaries so both parties can focus on the work.
Ensure your agreement includes these key sections:
- Scope of Work (SOW): This must be hyper-detailed, referencing the technical blueprint. It must explicitly define project objectives, key deliverables, milestones, and acceptance criteria for what constitutes "done."
- Intellectual Property (IP): The contract must state unequivocally that all work product—including all code, scripts, documentation, and diagrams—created during the engagement is the exclusive property of your company.
- Confidentiality (NDA): This clause protects your sensitive information, trade secrets, and proprietary data. It must be written to survive the termination of the contract.
- Term and Termination: Define the engagement's start and end dates. Crucially, include a termination for convenience clause that allows either party to end the agreement with reasonable written notice (e.g., 14 or 30 days). This provides a clean exit strategy if the engagement is not working.
- Liability and Indemnification: This section limits the consultant's financial liability and clarifies responsibilities in the event of a third-party claim arising from their work.
When drafting agreements, it is vital to account for potential future modifications. This guide to understanding contract addendums provides valuable context on how to formally amend legal agreements.
Getting Consultant Impact from Day One
The first 30 days of a technical consulting engagement determine its trajectory. A haphazard onboarding process consisting of account provisioning and HR paperwork is a direct impediment to value delivery. To maximize ROI, you must implement a structured, immersive onboarding plan designed to accelerate a consultant's time-to-impact.
This is not about providing access; it is a deliberate process to rapidly integrate them into your technical stack, team workflows, and the specific business problems they were hired to solve. Without this structure, even the most skilled engineer will spend weeks on non-productive ramp-up.
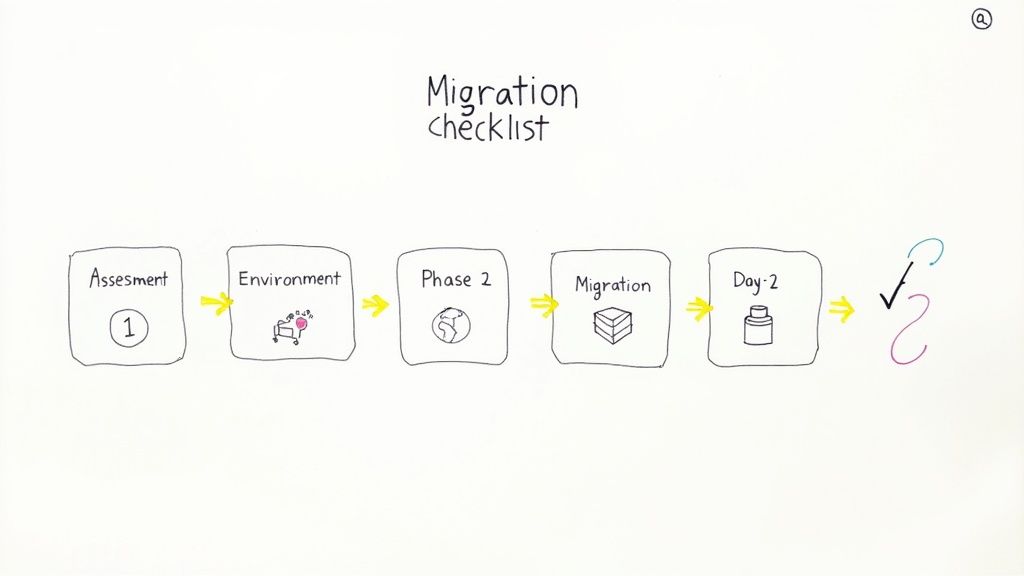
A Practical Onboarding Checklist for Technical Consultants
A structured onboarding process is a strategic advantage. It signals professionalism and establishes a high-impact tone from the start. A comprehensive checklist ensures critical steps are not missed and systematically reduces a consultant's time-to-productivity.
Adapt this actionable checklist for your needs:
-
Week 1: Deep Dive and Discovery
- Architecture Review: Schedule dedicated sessions for them to walk through key system architecture diagrams with a senior engineer who can provide historical context and explain design trade-offs.
- Stakeholder Interviews: Arrange concise, 30-minute meetings with key stakeholders (product owners, tech leads, operations staff) to help them understand the political landscape and project history.
- Codebase and Infrastructure Tour: Grant read-only access to critical code repositories and infrastructure-as-code (IaC) repos. Facilitate a guided tour to accelerate their understanding of your environment.
-
Week 2: Goal Alignment and an Early Win
- SOW and Goal Finalization: Conduct a joint review of the Statement of Work (SOW). Collaboratively refine and finalize the 30-60-90 day goals to ensure complete alignment on the definition of success.
- First Small Win: Assign a low-risk, well-defined task, such as fixing a known bug, improving a specific piece of documentation, or adding a unit test. This familiarizes them with your development workflow and builds critical initial momentum.
This focused methodology enables a consultant to start delivering meaningful contributions far more rapidly than a passive onboarding process.
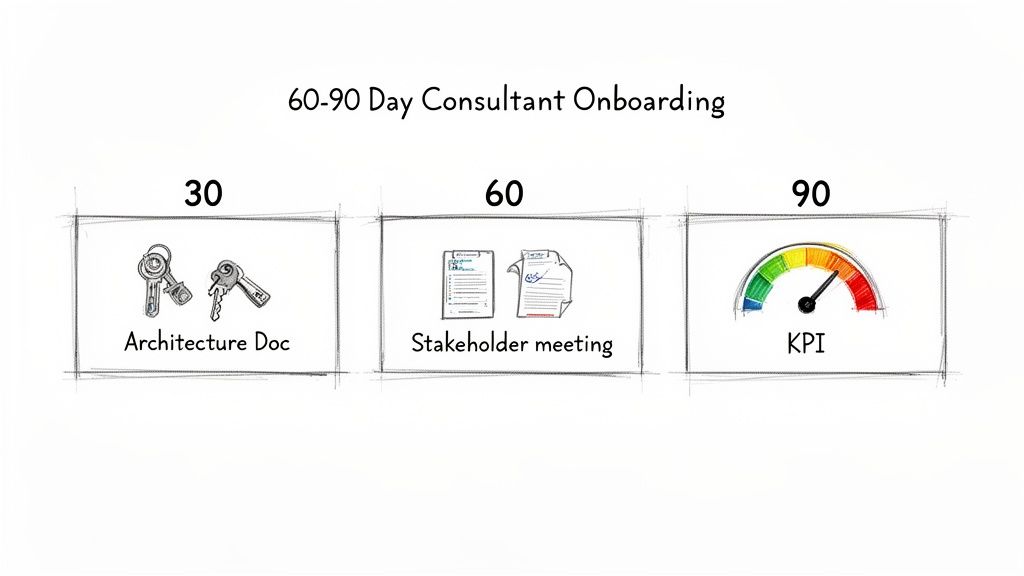
Defining Your 30-60-90 Day Goals
The most critical component of onboarding is establishing clear, measurable goals derived directly from the SOW. A 30-60-90 day plan creates a concrete roadmap with tangible milestones for tracking progress. It transforms the engagement from "we hired a consultant" to "we are achieving specific, contracted outcomes."
A well-defined 30-60-90 plan is the bridge between a consultant's potential and their actual impact. It ensures their day-to-day work is always pointed at the strategic goals you hired them to hit.
Here is a practical example for an SRE consultant hired to improve system reliability:
-
First 30 Days (Assessment & Quick Wins):
- Objective: Conduct a comprehensive audit of the current monitoring and alerting stack to identify critical gaps and sources of noise.
- Key Result: Deliver a detailed assessment report outlining the top five reliability risks and a prioritized remediation roadmap.
- KPI: Implement one high-impact, low-effort fix, such as tuning a noisy alert responsible for significant alert fatigue.
-
First 60 Days (Implementation):
- Objective: Begin executing the high-priority items on the observability roadmap.
- Key Result: Implement standardized structured logging across two business-critical microservices.
- KPI: Achieve a 20% reduction in Mean Time to Detect (MTTD) for incidents related to those services.
-
First 90 Days (Validation & Scaling):
- Objective: Validate the impact of the initial changes and develop a plan to scale the solution.
- Key Result: Define and implement Service Level Objectives (SLOs) and error budgets for the two target services.
- KPI: Demonstrate SLO adherence for one full month and present a documented plan for rolling out SLOs to five additional services.
Tying Goals to Tangible KPIs
Defining goals is only half the process; measuring them is the other. Your Key Performance Indicators (KPIs) must be specific, measurable, and directly linked to business value. This provides an objective basis for proving the consultant's contribution and justifying the investment. When you hire remote DevOps engineers, tying their work to unambiguous metrics is even more critical for maintaining alignment.
Effective KPIs for technical consultants are not abstract. They are quantifiable:
- CI/CD Pipeline Duration: A measurable decrease in the average time from
git committo production deployment (e.g., from 35 minutes to under 15 minutes). - System Reliability Metrics: A statistically significant improvement in SRE metrics like Mean Time Between Failures (MTBF) or a reduction in the error budget burn rate.
- Infrastructure Cost Reduction: A quantifiable decrease in the monthly cloud provider bill, achieved through resource optimization or implementing automated cost-control scripts.
The industry is already moving toward this outcome-based approach. In 2024–2025, companies began shifting talent metrics from activity tracking to outcome-based measures like quality of hire. With 66% of companies focused on improving manager skills, the ability to define and track these outcomes is non-negotiable. Insights from Mercer's global talent trends confirm this shift. This focus on tangible results ensures every consulting dollar delivers demonstrable value.
Common Questions About Technical Consultant Hiring
Even with a robust framework, your consultant talent acquisition process will encounter challenges, particularly when sourcing high-demand, specialized engineers.
You will inevitably face difficult questions regarding the verification of past work, rate negotiation, and sourcing strategy. Navigating these moments effectively often determines the success of an engagement.
Based on extensive experience, here are tactical answers to the most common challenges.
How Do You Verify a Consultant's Past Project Claims Without Breaking NDAs?
This is a classic challenge. A top consultant's most significant work is almost always protected by a non-disclosure agreement. You cannot ask them to violate it.
The solution is to shift your line of questioning from the what (confidential project details) to the how and the why (their process and decision-making).
During the interview, frame your questions to probe their methodology and technical reasoning:
- "Without naming the client, describe the architecture of the most complex distributed system you have designed. What were the primary technical trade-offs you evaluated?"
- "Describe the most challenging production incident you've had to debug. What was your diagnostic process, and what was the ultimate root cause and solution?"
This approach respects their legal obligations while still providing deep insight into their problem-solving capabilities. Additionally, use reference checks strategically. Ask former managers to speak to their technical contributions and collaboration skills in general terms, rather than requesting specifics about project deliverables.
What's the Best Way to Handle Rate Negotiations with a High-Demand Consultant?
Attempting to lowball an elite consultant is a failed strategy. They are aware of their market value and have multiple opportunities. The key is to enter the negotiation prepared and to frame the discussion around the total value of the engagement, not just the hourly rate.
First, conduct thorough market research. Have current, reliable compensation data for their specific skill set and experience level. This demonstrates that your position is based on market reality.
Next, shift the focus to the non-financial aspects of the project that are valuable to top talent:
- The technical complexity and unique engineering challenges involved.
- The direct, measurable impact their work will have on the business.
- The potential for a long-term, mutually beneficial partnership.
If their rate is firm and slightly exceeds your budget, explore other levers. Can you offer a more flexible work schedule? Propose a performance-based bonus tied to achieving specific KPIs from the SOW? Or can the scope be marginally adjusted to align with the budget?
Should We Use a Specialized Recruitment Agency or Source Consultants Directly?
This decision is a trade-off between speed, cost, and control. There is no universally correct answer; it depends on your team's internal capacity and the urgency of the need.
Using a Specialized Agency
A reputable agency acts as a force multiplier. They maintain a pre-vetted network of talent and can often present qualified candidates in days or weeks, a fraction of the time direct sourcing might take. This velocity comes at a significant premium, typically 20-30% of the first year's contract value.
Direct Sourcing
Direct sourcing is more cost-effective and provides complete control over the process and the candidate experience. However, it requires a substantial and sustained internal effort. Sourcing, screening, and engaging potential consultants is a resource-intensive function.
A hybrid model is often the most pragmatic solution. Initiate your internal sourcing efforts first, but be prepared to engage a specialized agency for particularly hard-to-fill or business-critical roles where time-to-hire is the primary constraint.
Ready to bypass the hiring headaches and connect with elite, pre-vetted DevOps talent? At OpsMoon, we match you with engineers from the top 0.7% of the global talent pool. Start with a free work planning session to build your technical roadmap and find the perfect expert for your project.