In today's complex cloud-native environments, mishandling secrets like API keys, database credentials, and certificates is a critical vulnerability that can lead to catastrophic breaches. Simply keeping secrets out of a .env file or your Git repository is no longer sufficient. True security requires a robust, multi-layered strategy that integrates policy, technology, and automation across the entire software development lifecycle. Without a solid foundation, even the most secure infrastructure can be compromised by a single leaked credential.
This guide moves beyond generic advice to provide a technical deep dive into eight essential secrets management best practices. We'll provide actionable, implementation-focused insights tailored for engineering leaders, DevOps teams, and security professionals. Forget surface-level tips; we will explore the practical mechanics of building a resilient and secure software delivery pipeline.
You will learn how to:
- Implement zero-trust architectures for credential access using workload identity.
- Enforce the principle of least privilege with dynamic, short-lived secrets.
- Automate the entire secret lifecycle, from provisioning to rotation and revocation.
- Leverage dedicated secrets management tools to centralize control and auditing.
Each practice is broken down into specific steps, code examples, and tooling recommendations to help you transition from theory to production. We will cover everything from policy design and encryption standards to comprehensive audit logging and automated workflows. By the end of this article, you'll have a clear roadmap for implementing a modern secrets management strategy that protects your applications, data, and infrastructure from credential-based attacks.
1. Never Hardcode Secrets in Source Code
The most foundational rule in secrets management is to never embed sensitive data directly into your source code. Hardcoding secrets like API keys, database passwords, OAuth tokens, or private certificates into application files, configuration files, or build scripts is an anti-pattern that creates significant security vulnerabilities. Once a secret is committed to a version control system like Git, it can be exposed to anyone with access to the repository, and even removing it later doesn't erase it from the commit history.

This practice is a cornerstone of modern security, popularized by organizations like the OWASP Foundation and the Cloud Security Alliance. Instead of embedding credentials, the best practice is to externalize them. Your application should be designed to retrieve these secrets at runtime from a secure, external source. This decoupling allows you to rotate secrets without changing code, grant and revoke access dynamically, and maintain a clear audit trail of secret usage.
How to Prevent Hardcoded Secrets
To effectively implement this practice, you need a multi-layered defense combining developer education, automated tooling, and secure workflows. Here are actionable steps:
- Implement Pre-Commit Hooks: Use tools like
git-secretsortalismanto configure pre-commit hooks that automatically scan staged files for patterns matching common secret formats. If a potential secret is detected, the commit is blocked. For example, to installgit-secretsand add a hook to your repository:git secrets --install git secrets --register-aws # Add common provider patterns git secrets --add 'AKIA[0-9A-Z]{16}' # Add custom patterns - Integrate Secret Scanning in CI/CD: Add automated secret detection tools like Gitleaks or TruffleHog into your continuous integration (CI) pipeline. This acts as a second line of defense. A typical CI job step might look like this:
- name: Scan for secrets run: | docker run --rm -v "$(pwd):/path" zricethezav/gitleaks:latest detect --source /path -v --no-git --report-path=gitleaks-report.json - Use Placeholder Values: In your configuration templates (e.g.,
config.yaml.template), use placeholder variables like${DB_PASSWORD}instead of actual values. These placeholders are then populated at runtime using environment variables or a dedicated secrets management tool.
Key Insight: Treating secrets as code is a critical security failure. Secrets should be treated as ephemeral, injectable data, completely separate from the application's static codebase. This approach not only improves security but also makes your application more portable and easier to manage across different environments (development, staging, production).
For example, GitHub's own secret scanning service automatically detects over 200 types of tokens and alerts providers, demonstrating the scale and importance of this problem. Adopting this "no hardcoding" rule is a non-negotiable first step in building a robust secrets management best practices strategy.
2. Implement Principle of Least Privilege
The Principle of Least Privilege (PoLP) is a foundational security concept stating that any user, program, or process should have only the bare minimum permissions necessary to perform its function. In secrets management, this means meticulously scoping access so that an application or user can only read, write, or manage the specific secrets they absolutely require, and nothing more. This approach drastically reduces the potential blast radius of a security breach; if a service is compromised, the attacker's access is confined to that service's limited set of secrets, preventing lateral movement across your systems.
This principle, originally articulated by computer scientists like Jerome Saltzer, is a core tenet of modern security frameworks, including the NIST Cybersecurity Framework and Zero Trust architectures. Instead of granting broad, role-based permissions like database-admin, PoLP demands granular, identity-based policies. For instance, a specific microservice should have read-only access to a single database credential, not the entire secrets engine. This ensures your secrets management strategy is both robust and auditable.
How to Implement Least Privilege for Secrets
Applying this principle requires a combination of precise policy definition, identity-based access controls, and regular audits. Here are actionable steps to enforce PoLP in your secrets management workflows:
- Start with Deny-All Policies: Configure your secrets manager (e.g., HashiCorp Vault, AWS Secrets Manager) with a default "deny-all" policy. Grant permissions explicitly and incrementally. For example, a Vault policy for a microservice might look like this, granting read-only access to a specific path:
# policy-billing-service.hcl path "secret/data/billing-app/database" { capabilities = ["read"] } - Use Service Identities for Applications: Instead of sharing user credentials, assign a unique identity to each application or microservice (e.g., an AWS IAM Role, a Kubernetes Service Account). You can then attach fine-grained policies to these identities. This practice aligns perfectly with broader DevOps security best practices.
- Implement Just-in-Time (JIT) Access: For human operators requiring temporary access to production secrets, use JIT access systems. Tools like Azure's Privileged Identity Management or HashiCorp Vault can generate dynamic, short-lived credentials that automatically expire after a set period. For example, a developer could request temporary database credentials via Vault:
vault read database/creds/my-roleThis command would generate a new, unique username and password with a defined TTL.
Key Insight: The Principle of Least Privilege shifts the security mindset from "who can access this?" to "what is the minimum access this entity needs to function?". Every permission granted is a potential attack vector, so every permission must be critically evaluated and tightly scoped. True secrets management best practices depend on this granular control.
3. Use Dedicated Secrets Management Solutions
While externalizing secrets from code is a crucial first step, relying on basic solutions like environment variables or simple configuration files falls short in enterprise environments. The next level of maturity in secrets management best practices involves adopting a purpose-built, dedicated secrets management platform. These solutions are specifically engineered to handle the entire lifecycle of a secret: secure storage, controlled access, dynamic rotation, and comprehensive auditing.

Pioneered by tools like HashiCorp Vault, AWS Secrets Manager, and Azure Key Vault, these platforms provide a centralized, secure vault for all sensitive credentials. They offer robust APIs and integrations that allow applications and services to fetch secrets dynamically at runtime, authenticated via trusted identities (e.g., IAM roles, Kubernetes service accounts). This approach eliminates secret sprawl and provides a single source of truth, as seen in Airbnb's migration to Vault for managing microservices secrets or Capital One's use of CyberArk for enterprise-wide credential control.
How to Implement a Dedicated Solution
Successfully adopting a dedicated secrets management platform requires careful planning and integration into your existing workflows. Here are the key technical steps:
- Evaluate Solutions Based on Your Stack: Choose a platform that integrates seamlessly with your environment. For cloud-native stacks, AWS Secrets Manager or Azure Key Vault offer deep integration. For hybrid-cloud or multi-cloud scenarios, a platform-agnostic tool like HashiCorp Vault may be more suitable. Your selection should align with your compliance requirements (e.g., PCI-DSS, HIPAA) and operational needs.
- Plan for High Availability and Disaster Recovery: A secrets manager is a critical piece of infrastructure; if it goes down, your applications may fail. Deploy your solution in a highly available configuration (e.g., a 3-5 node Raft cluster for Vault across availability zones) and establish robust backup and recovery procedures using features like Vault's integrated storage snapshots.
- Implement a Gradual Migration Strategy: Avoid a "big bang" migration. Start with a new, non-critical service to pilot the platform and refine your processes. Gradually onboard existing applications, using patterns like the external secrets operator in Kubernetes to inject secrets without major code refactoring.
Key Insight: A dedicated secrets management solution transforms secrets from static liabilities into dynamic, manageable assets. It provides the core capabilities of encryption-at-rest and in-transit, fine-grained access control policies, automated secret rotation, and detailed audit logs that are essential for achieving a mature security posture and meeting compliance standards.
Integrating these tools is often a core component of a modern security strategy. For teams managing complex cloud environments, these practices are closely related to the principles found in effective infrastructure as code best practices, where both infrastructure and its credentials are managed through secure, automated, and auditable systems.
4. Implement Secret Rotation Policies
Static, long-lived credentials are a significant security risk. Secret rotation is the practice of systematically changing sensitive credentials like API keys, database passwords, and TLS certificates on a predefined schedule or in response to specific events. This proactive measure drastically limits the time window during which a compromised secret can be exploited, reducing the potential impact of a breach.
This practice is a core tenet of modern security frameworks like NIST and is heavily promoted by cloud providers like AWS and Google Cloud. By treating secrets as ephemeral, you shift from a reactive security posture to a proactive one. For instance, instead of responding to a leaked key, you operate under the assumption that keys will eventually be compromised and render them useless before they can cause significant damage. This is a fundamental concept in building a zero-trust architecture.
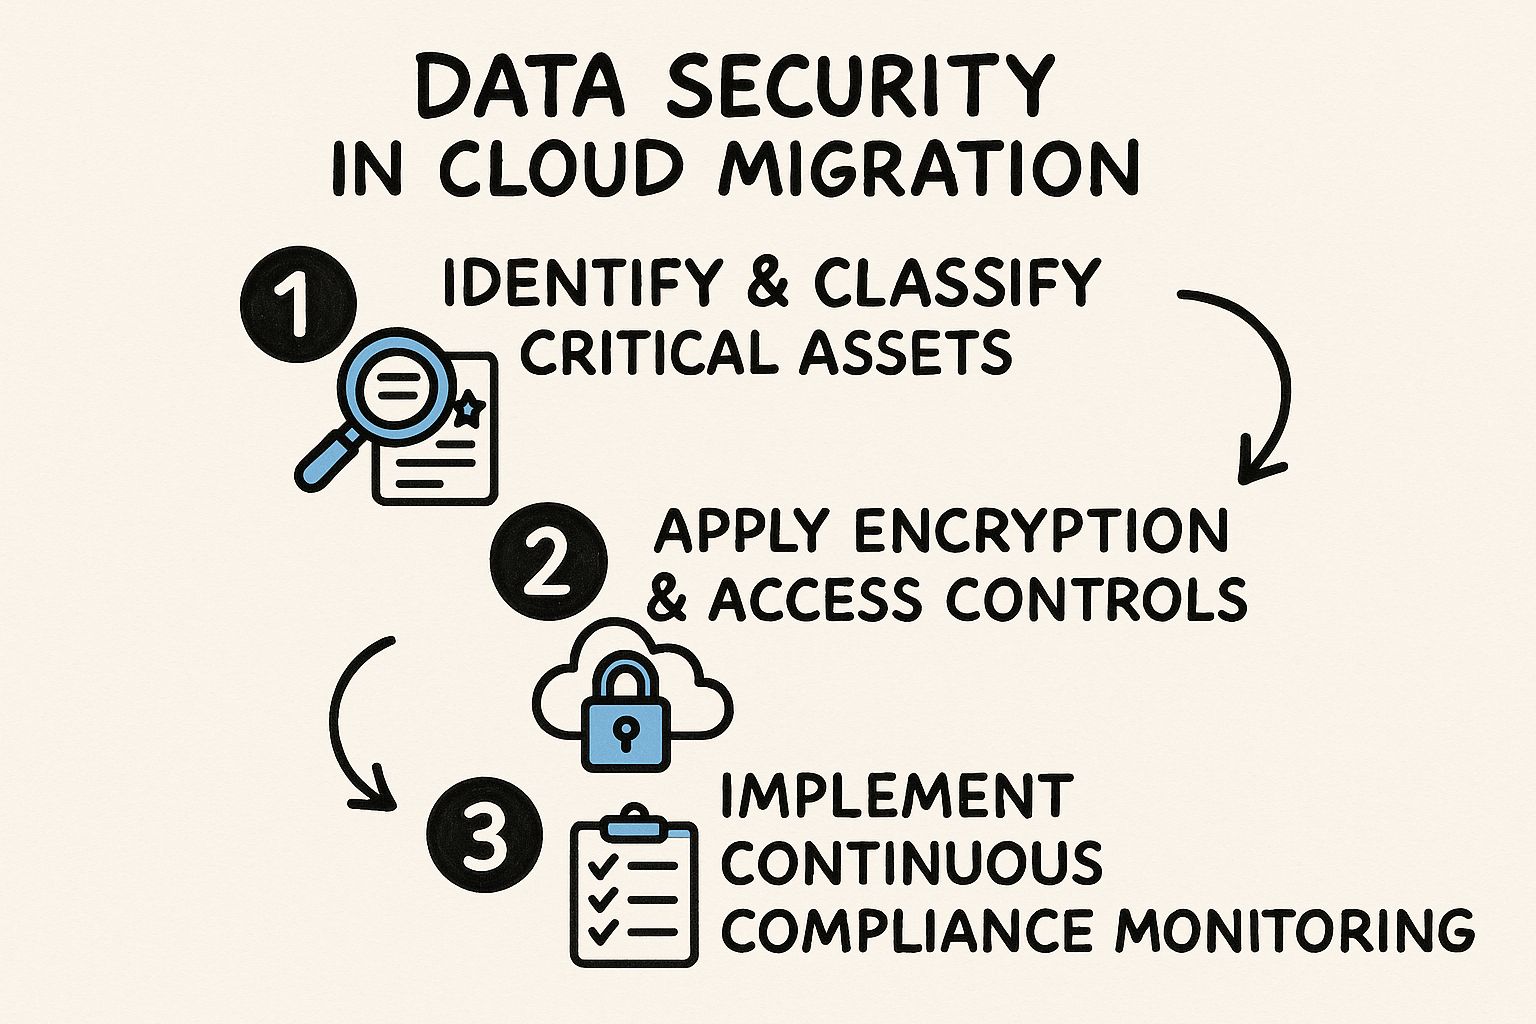
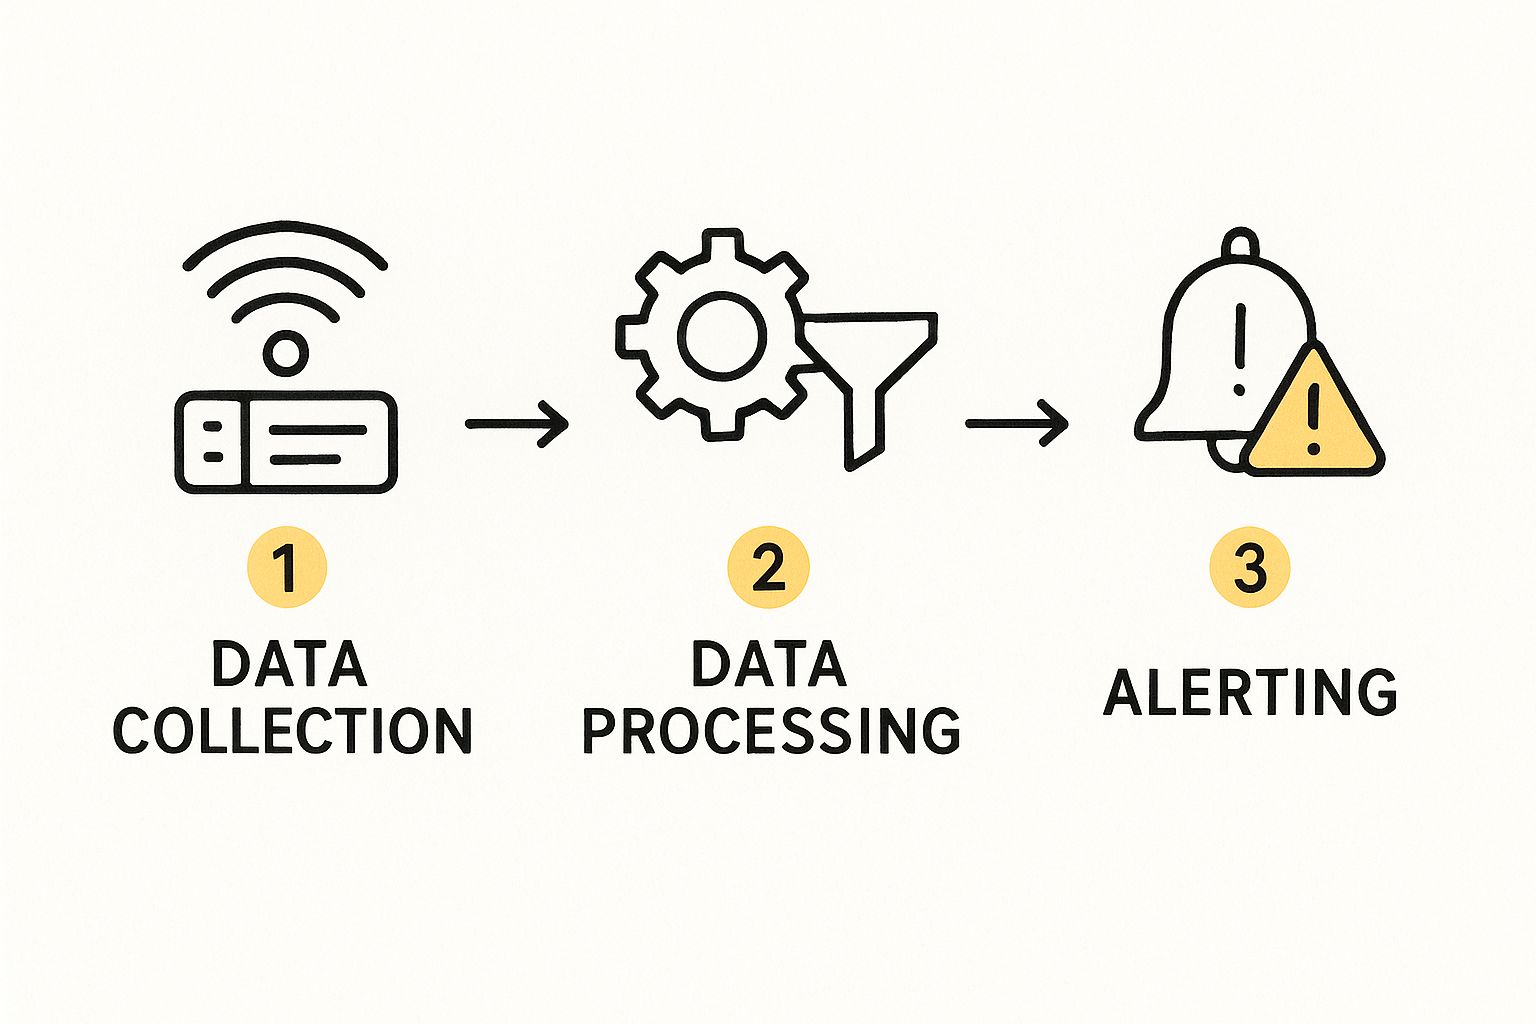
The following infographic illustrates the key automated workflows that enable a robust secret rotation strategy.
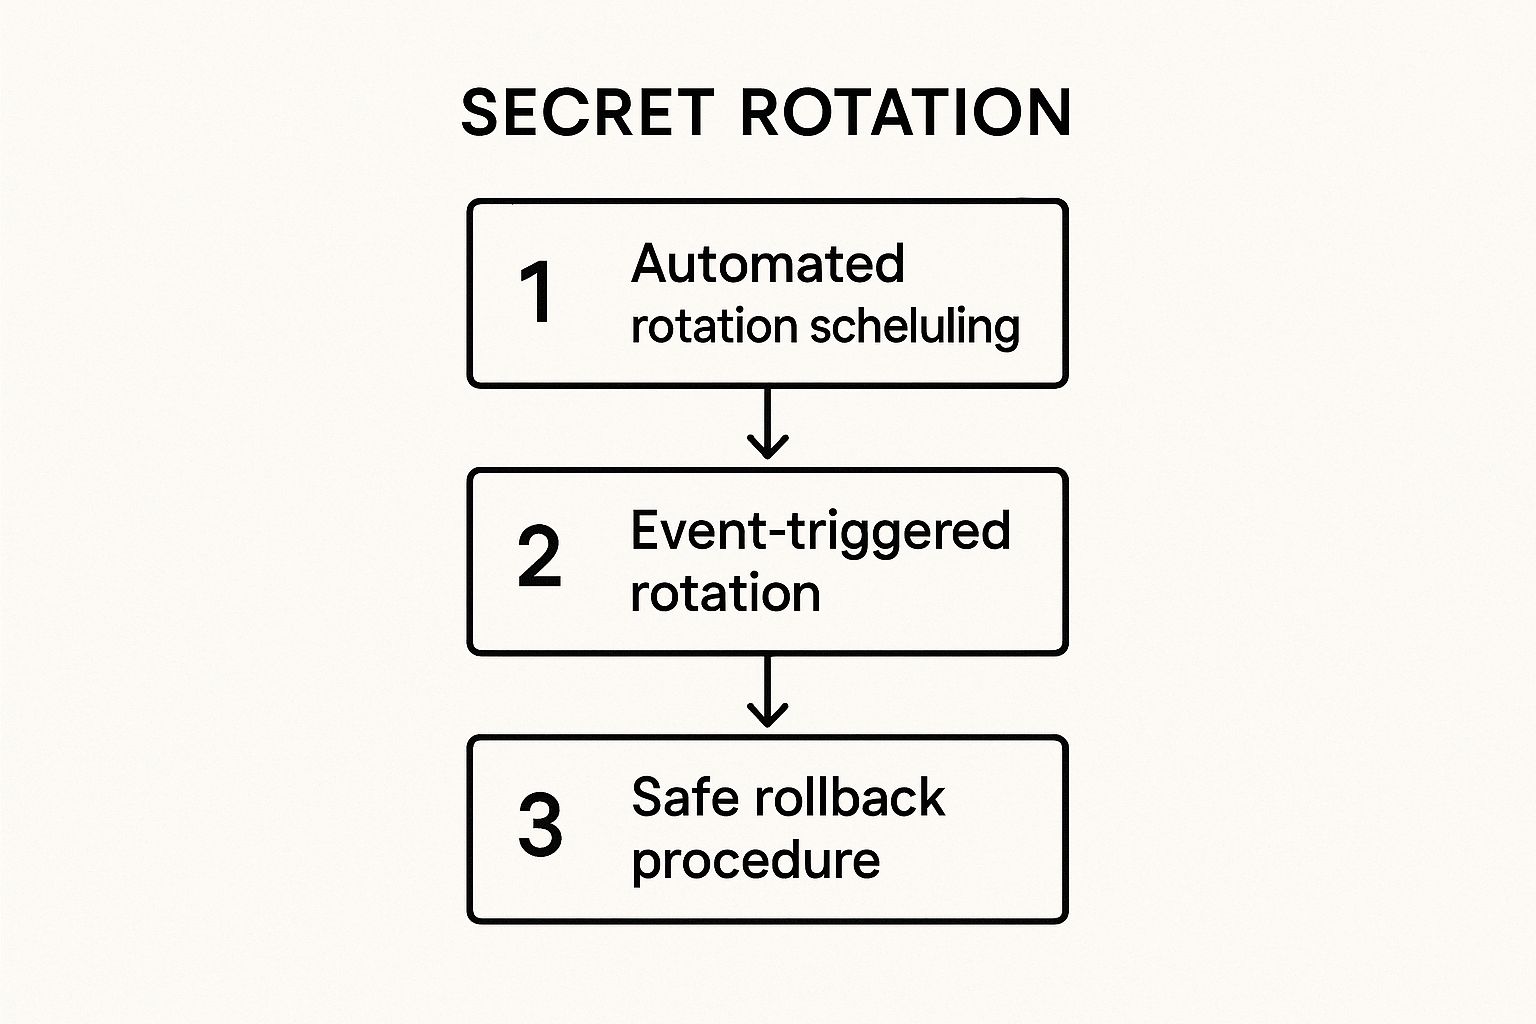
This process flow highlights how a mature rotation system combines scheduled, event-triggered, and safety-oriented workflows to maintain security without disrupting service.
How to Implement Secret Rotation
Automating secret rotation is essential for implementing it effectively at scale. Manual rotation is error-prone, difficult to track, and often neglected. Here are actionable steps to build an automated rotation pipeline:
- Automate Credential Generation and Deployment: Use a secrets management tool (like HashiCorp Vault or AWS Secrets Manager) to dynamically generate new credentials. For example, AWS Secrets Manager can use a Lambda function to automate the rotation of RDS database credentials. For Vault, you can configure the database secrets engine to manage user lifecycle.
- Implement Health Checks and Rollbacks: Before decommissioning the old secret, run automated health checks to confirm the application is functioning correctly with the new one. This can be a script in your deployment pipeline that performs a simple database query or API call. If the checks fail, trigger an automated rollback procedure to revert to the previous credential, preventing an outage.
- Start with Low-Risk Secrets: Begin your implementation journey by automating the rotation of less critical secrets, such as those in a development or staging environment. This allows your team to refine the process, build confidence, and identify potential issues before applying the same automation to production database credentials or critical API keys.
Key Insight: The primary goal of secret rotation is to reduce the "time-to-live" (TTL) of any given credential. The shorter the lifespan of a secret, the smaller the window of opportunity for an attacker. Fully automated rotation transforms secrets from high-value, long-term targets into low-value, temporary access tokens.
5. Enable Comprehensive Audit Logging
Effective secrets management isn't just about controlling access; it's also about maintaining complete visibility into how secrets are used, modified, and managed. Comprehensive audit logging is the practice of recording every interaction with your secrets management system, from an application fetching a database credential to an administrator revoking a user's access. This detailed trail is non-negotiable for security forensics, compliance, and proactive threat detection.
This practice is a core requirement of major compliance frameworks like PCI-DSS, HIPAA, and SOX, which mandate that organizations can prove who accessed sensitive data and when. Without a robust audit log, responding to a security incident becomes a guessing game. A well-maintained audit trail allows security teams to reconstruct events, identify the scope of a breach, and understand the root cause, turning an opaque system into a transparent and accountable one.
How to Implement Comprehensive Audit Logging
Implementing effective auditing requires more than just turning on logs. It involves a systematic approach to collecting, analyzing, and acting on the data generated by your secrets management platform.
- Centralize and Structure Logs: Forward all audit logs from your secrets manager (like HashiCorp Vault or AWS Secrets Manager) to a centralized Security Information and Event Management (SIEM) system like Splunk, LogRhythm, or an ELK stack. Ensure logs are in a structured format (e.g., JSON) to make them easily searchable. For Vault, you can enable a socket audit device to stream logs directly to Splunk.
vault audit enable socket address="127.0.0.1:8201" socket_type="tcp" - Implement Real-Time Alerting: Configure your SIEM to trigger real-time alerts for high-risk or anomalous activities. Examples include a secret being accessed from an unusual IP address, an excessive number of access failures from a single user, or an attempt to use a revoked token. A sample Splunk query could be:
index=vault type=response operation=read path=secret/data/prod/* error!="" | stats count by client_token_display_name - Establish Clear Retention Policies: Define and enforce log retention policies based on your industry's compliance requirements and internal security policies. For example, PCI-DSS may require one year of log history, with three months immediately available for analysis. Ensure these logs are stored immutably to prevent tampering, using features like AWS S3 Object Lock.
Key Insight: Audit logs are not just for post-incident forensics; they are a proactive security tool. Analyzing log patterns helps you identify misconfigured applications, unused secrets that can be decommissioned, and user behavior that deviates from the norm, allowing you to strengthen your security posture before a breach occurs.
For instance, integrating AWS Secrets Manager with AWS CloudTrail provides an immutable record of every API call made to the service. This data can then be fed into Amazon GuardDuty for intelligent threat detection, demonstrating how auditing forms a critical component of a layered security strategy in modern cloud environments. This level of visibility is a hallmark of mature secrets management best practices.
6. Encrypt Secrets at Rest and in Transit
A critical defense-in-depth principle in secrets management best practices is to ensure secrets are encrypted both when stored (at rest) and while being transmitted (in transit). Encrypting data at rest protects against physical theft of storage media or direct database breaches, while encrypting data in transit protects against network sniffing and man-in-the-middle (MITM) attacks. This dual-layered approach ensures that sensitive credentials remain unreadable and unusable even if an attacker bypasses other security controls.
This practice is a foundational requirement in almost every major security framework, including those from NIST (National Institute of Standards and Technology) and PCI DSS. Modern secrets management platforms are built on this principle. For instance, HashiCorp Vault encrypts all its storage backend data by default, and cloud providers like AWS Secrets Manager and Azure Key Vault leverage hardware security modules (HSMs) and robust encryption protocols to secure stored secrets. When an application requests a secret, it must be transmitted over a secure, encrypted channel like TLS 1.2 or higher.
How to Implement Comprehensive Encryption
Effective implementation requires a combination of strong cryptographic standards, secure protocols, and diligent key management policies. Here are actionable steps to ensure end-to-end encryption for your secrets:
- Enforce TLS for All Communications: Mandate the use of strong Transport Layer Security (TLS) versions (preferably 1.3) for all API calls and network traffic between applications, services, and your secrets management tool. In your Vault configuration, you can specify this:
# vault.hcl listener "tcp" { address = "0.0.0.0:8200" tls_min_version = "tls12" ... } - Utilize a Secrets Manager with Built-in Encryption: Adopt a solution that handles encryption at rest automatically. Tools like AWS Secrets Manager use AWS KMS for envelope encryption, while HashiCorp Vault provides a transit secrets engine that can perform encryption-as-a-service for your applications.
- Leverage Envelope Encryption: For an additional security layer, use envelope encryption. This technique involves encrypting your data with a Data Encryption Key (DEK) and then encrypting the DEK itself with a highly secured Key Encryption Key (KEK) stored in an HSM or a service like Google Cloud KMS. This isolates the keys and strengthens protection.
Key Insight: Encryption is not a "set it and forget it" solution. It is a continuous process that includes strong algorithm selection, secure key management, and regular rotation. Treating encryption as a lifecycle ensures that your secrets remain protected against both current and future threats, forming a non-negotiable part of your security posture.
For example, when using Azure Key Vault, secrets are automatically encrypted with 256-bit AES encryption, with the keys themselves protected by HSMs. This layered protection model ensures that even if one layer is compromised, the secrets themselves remain secure. Implementing this dual encryption strategy is essential for building a resilient secrets management framework.
7. Implement Zero Trust Architecture for Secrets
Adopting a Zero Trust model for secrets management means discarding the outdated idea of a secure network perimeter. Instead, you operate under the principle of "never trust, always verify." This approach treats every request for a secret as a potential threat, regardless of whether it originates from inside or outside your network. Each access attempt must be strictly authenticated, authorized for the specific resource requested, and encrypted end-to-end.
This security paradigm, popularized by Forrester Research and further defined in standards like NIST SP 800-207, shifts the focus from network location to identity and context. For secrets, this means a service running on a supposedly "trusted" production server doesn't get a free pass. It must prove its identity and authorization just like any external service would. This model is critical in modern cloud-native environments where traditional perimeters are non-existent.
How to Implement Zero Trust for Secrets
Transitioning to a Zero Trust model requires a strategic and layered approach that combines strong identity controls, granular access policies, and continuous monitoring.
- Enforce Strong Identity-Based Authentication: Move beyond simple IP-based or static credential authentication. Use workload identity mechanisms like SPIFFE/SPIRE, AWS IAM Roles for Service Accounts (IRSA), or Azure AD Workload Identity. For example, configuring Vault's Kubernetes auth method allows a pod to authenticate using its Service Account Token, tying its identity to a specific Vault role and policy.
vault write auth/kubernetes/role/my-app \ bound_service_account_names=my-app-sa \ bound_service_account_namespaces=production \ policies=my-app-policy \ ttl=24h - Implement Principle of Least Privilege (PoLP): Grant access based on granular, role-based policies that give an identity permission to access only the specific secrets it needs for its function. For example, a billing service should only be able to read the API key for the payment gateway, not the database root credentials. Access should be time-bound whenever possible.
- Continuously Verify and Monitor: Log every secret access request, successful or not. Use behavioral analytics and machine learning to detect anomalous patterns, such as a service requesting a secret at an unusual time or from an unexpected location. This continuous verification helps you detect and respond to potential compromises in real-time.
Key Insight: Zero Trust for secrets is not about building walls; it's about creating checkpoints. By assuming a breach has already occurred, you design a system where an attacker gaining a foothold in one part of your infrastructure cannot move laterally to access your most sensitive credentials. This containment is a core tenet of modern secrets management best practices.
Pioneering implementations like Google's BeyondCorp demonstrate how this model can secure internal applications and secrets without relying on traditional VPNs. By applying these principles, you create a resilient and dynamic security posture that protects your secrets against sophisticated, modern threats.
8. Automate Secret Provisioning and Lifecycle Management
Relying on manual processes to manage secrets is inefficient, prone to error, and unsustainable at scale. A core tenet of modern secrets management best practices is to automate the entire lifecycle of secrets, from creation and distribution to rotation and eventual revocation. This approach eliminates the security risks associated with human intervention, such as forgotten credentials or inconsistent application of policies, ensuring secrets are handled securely and efficiently across distributed systems.
This practice is a cornerstone of DevOps and Site Reliability Engineering (SRE), where speed and reliability are paramount. By integrating automation into your infrastructure and application workflows, you create a dynamic, self-managing system. This system can automatically provision new secrets for services, rotate them on a schedule without downtime, and instantly revoke access when a service is decommissioned or a potential compromise is detected.
How to Implement Secret Lifecycle Automation
Effective automation requires integrating dedicated tools into your existing infrastructure and CI/CD pipelines. Here are the key steps to implement this practice:
- Integrate Secrets Management with IaC: Use Infrastructure as Code (IaC) tools like Terraform or Pulumi to manage secrets alongside your infrastructure resources. For example, you can use the Terraform Vault Provider to dynamically generate database credentials for a new server instance.
data "vault_database_secret_backend_role" "db" { backend = "database" name = "my-role" } resource "aws_instance" "app" { # ... user_data = <<-EOF export DB_USERNAME=${data.vault_database_secret_backend_role.db.username} export DB_PASSWORD=${data.vault_database_secret_backend_role.db.password} # ... launch application EOF } - Automate Secret Injection in CI/CD: Leverage integrations between your secrets manager and your CI/CD platform. Tools like the GitHub Actions integration for Azure Key Vault or the Jenkins Vault Plugin allow your pipeline to securely fetch temporary credentials needed for a build or deployment. Our in-depth guide to CI/CD pipeline best practices covers how to securely handle credentials in these environments.
- Utilize Kubernetes Secret Operators: In cloud-native environments, use tools like the External Secrets Operator (ESO). This operator automatically synchronizes secrets from an external store (like AWS Secrets Manager, GCP Secret Manager, or Vault) directly into native Kubernetes
Secretobjects, making them securely available to pods without custom application logic.
Key Insight: Treat secret management as a dynamic, automated system, not a static, manual task. The goal is to make the "secure way" the "easy way" by building automation that handles provisioning, rotation, and revocation transparently. This reduces operational overhead and strengthens your security posture simultaneously.
To truly automate secret provisioning and lifecycle management, mastering user provisioning and deprovisioning is paramount, as secrets are often tied to user or service identities. Automating identity lifecycle management ensures that when an identity is removed, its associated secrets are automatically and immediately revoked, closing a common security gap.
8 Best Practices Comparison Guide
| Practice | Implementation Complexity | Resource Requirements | Expected Outcomes | Ideal Use Cases | Key Advantages |
|---|---|---|---|---|---|
| Never Hardcode Secrets in Source Code | Moderate (requires infra setup) | Secure storage systems, scanning tools | Eliminates secret exposure; supports env-specific configs | Development teams managing code repositories | Prevents accidental secret leaks; version control safe |
| Implement Principle of Least Privilege | High (permission granularity) | Access control systems, ongoing review | Minimizes breach impact; improves compliance | Organizations with role-based access needs | Limits insider threats; strong audit trails |
| Use Dedicated Secrets Management Solutions | High (infra and licensing) | Secrets management platforms, licensing | Professional security; audit and lifecycle management | Enterprises managing multiple apps/environments | Centralized secret control; scalable |
| Implement Secret Rotation Policies | Moderate to High (coordination) | Automation tools, monitoring | Limits compromised secret exposure window | Security-focused orgs; regulated industries | Reduces impact of credential leaks |
| Enable Comprehensive Audit Logging | Moderate | Logging infrastructure, SIEM systems | Supports incident response and compliance | Organizations with strict audit requirements | Rapid incident detection; accountability |
| Encrypt Secrets at Rest and in Transit | Moderate to High | Encryption tools, key management | Protects against breaches and network attacks | All organizations handling sensitive data | Data confidentiality; regulatory compliance |
| Implement Zero Trust Architecture for Secrets | Very High | Identity & access systems, monitoring | Eliminates implicit trust; granular controls | Large distributed systems; high-security orgs | Reduces lateral movement; adaptive security |
| Automate Secret Provisioning and Lifecycle Management | High | Automation tools, CI/CD integration | Reduces manual errors; scales management | DevOps teams; large-scale environments | Improved consistency & rapid scaling |
Operationalizing Your Secrets Management Strategy
Navigating the landscape of modern application development requires more than just innovative features and rapid deployment cycles; it demands an unwavering commitment to security. We've journeyed through eight critical secrets management best practices, moving from foundational principles to advanced, automated frameworks. Adopting these practices is not a singular event but a continuous process of refinement, integration, and cultural reinforcement. The goal is to weave security so deeply into your development lifecycle that it becomes an invisible, frictionless default, not a cumbersome afterthought.
The principles outlined, such as never hardcoding secrets and enforcing least privilege, serve as the bedrock of your security posture. They are non-negotiable starting points. From there, layering on dedicated secrets management solutions, mandatory rotation policies, and comprehensive audit logs transforms your strategy from passive defense to active, intelligent oversight. This visibility is crucial, not just for incident response but for proactive threat hunting and identifying potential weaknesses before they can be exploited.
From Theory to Tangible Implementation
Translating these concepts into a resilient, automated system is where the real work begins. The most mature security programs embrace the advanced practices we discussed:
- End-to-End Encryption: Ensuring secrets are encrypted both at rest within your vault and in transit across your network is a fundamental requirement. This dual-layered approach mitigates risks from both internal and external threats, protecting data even if one layer of defense is compromised.
- Zero Trust Architecture: Shifting from a network-perimeter-based security model to a Zero Trust framework is a paradigm shift. Every request for a secret, regardless of its origin, must be authenticated, authorized, and continuously verified. This approach treats every service and user as a potential threat, dramatically reducing the attack surface.
- Lifecycle Automation: The ultimate goal is to remove human intervention from the secrets lifecycle entirely. Automating the provisioning, injection, rotation, and revocation of secrets eliminates the risk of human error, reduces credential sprawl, and ensures policies are enforced consistently and at scale.
Implementing this level of sophistication requires a strategic roadmap. Start by assessing your current state. Where are secrets currently stored? How are they accessed? Who has access? Answering these questions will reveal immediate vulnerabilities and help prioritize your efforts. A phased rollout, starting with a single critical application or environment, can provide valuable lessons before a broader implementation.
Integrating Security into Your Broader Governance
A robust secrets management program doesn't exist in a vacuum. It is a critical component of your organization's overall governance, risk, and compliance (GRC) strategy. The comprehensive audit trails generated by your secrets management solution provide invaluable evidence for compliance audits, whether for SOC 2, ISO 27001, or HIPAA. For organizations navigating complex regulatory landscapes, integrating these security controls with dedicated software for compliance management can streamline reporting and provide a unified view of your security posture. This integration ensures that your technical controls directly support and validate your compliance claims, turning a security necessity into a strategic business enabler.
Ultimately, mastering these secrets management best practices is about building trust: trust with your customers that their data is safe, trust within your teams that they can build and deploy securely, and trust in your systems' resilience against an ever-evolving threat landscape. It's a journey from reactive security measures to a proactive, automated, and deeply embedded culture of security excellence.
Ready to transform your secrets management strategy from a liability into a competitive advantage? The expert DevOps and DevSecOps engineers at OpsMoon specialize in designing and implementing the sophisticated, automated systems discussed in this guide. Schedule a free work planning session to build a clear, actionable roadmap for securing your infrastructure.