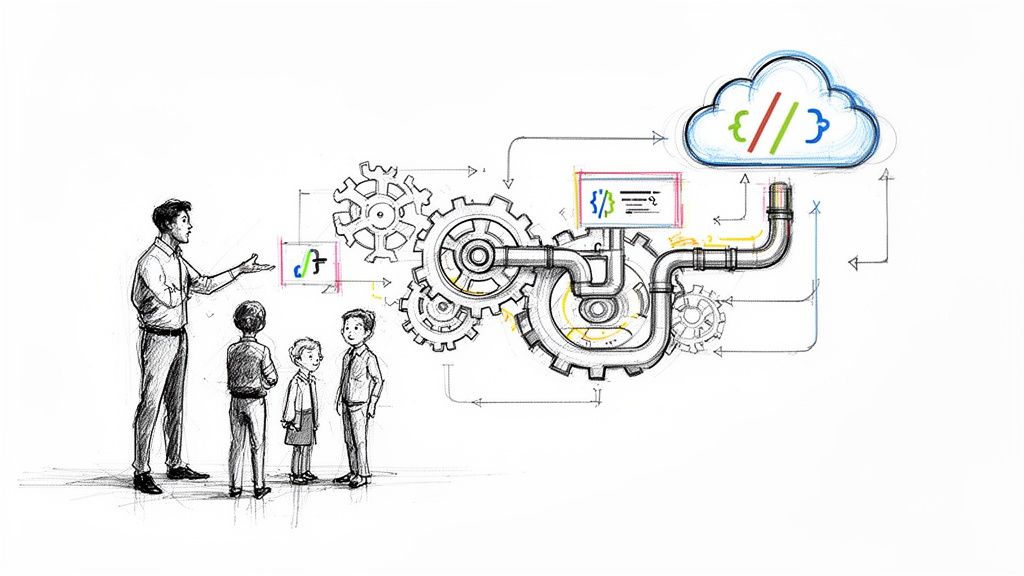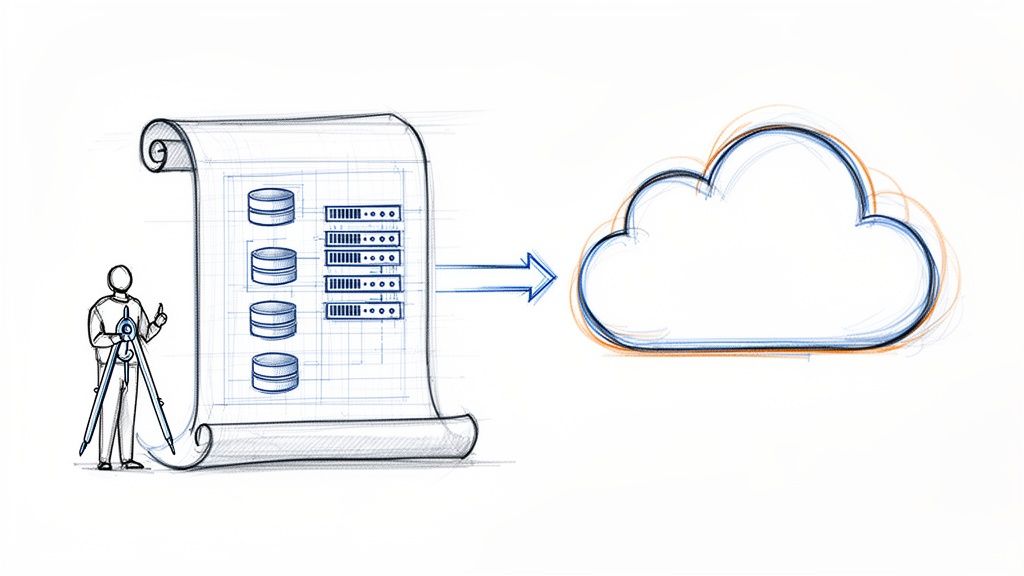
A cloud migration consultation is not a service; it is a strategic engineering partnership. Its objective is to produce a detailed, technical blueprint for migrating your infrastructure, applications, and data to the cloud. The process transforms a potentially chaotic, high-risk project into a predictable, value-driven engineering initiative.
Understanding the Cloud Migration Consultation
Hiring a consultant before a cloud migration is analogous to engaging a structural engineer before constructing a skyscraper. You would not pour a foundation without a precise, engineering-backed blueprint. A cloud migration consultation provides that architectural deep dive, ensuring the initiative does not collapse under the weight of unforeseen costs, security vulnerabilities, or crippling technical debt.
This process transcends a simplistic "lift and shift" recommendation. It is a comprehensive, collaborative analysis of your entire technical estate, ensuring the migration strategy aligns directly with measurable business objectives. The primary goal is to de-risk a significant technology transition by architecting a cloud environment that is secure, cost-effective, and scalable from inception. Understanding the end-to-end process of cloud migration is a critical prerequisite before engaging with consultants.
Aligning Technical Execution with Business Goals
An effective consultation bridges the gap between engineering teams and executive leadership. It translates high-level business goals—such as "accelerate time-to-market" or "reduce TCO"—into a concrete, actionable technical execution plan.
Different stakeholders have distinct priorities, and the consultant's role is to synthesize these into a unified strategy:
- The CTO focuses on strategic outcomes: market agility, long-term technological innovation, and future-proofing the technology stack against obsolescence.
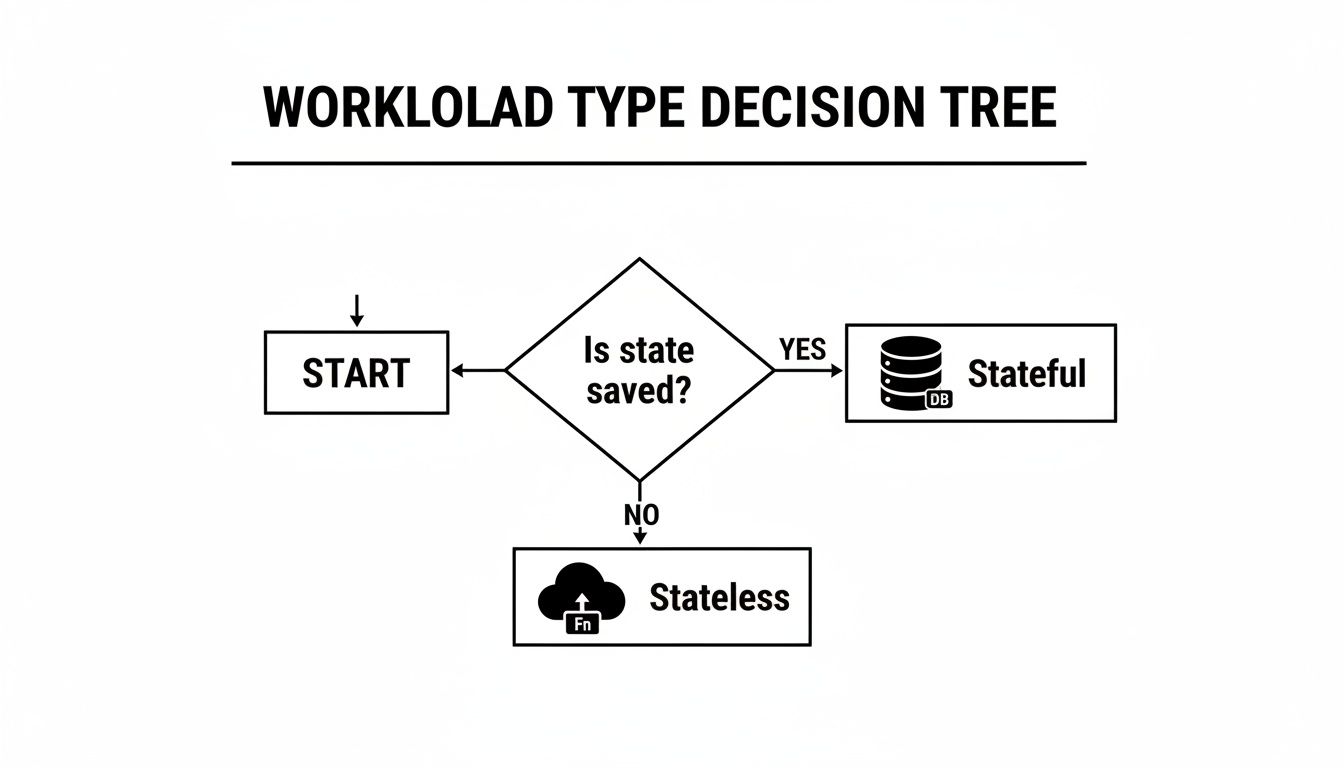
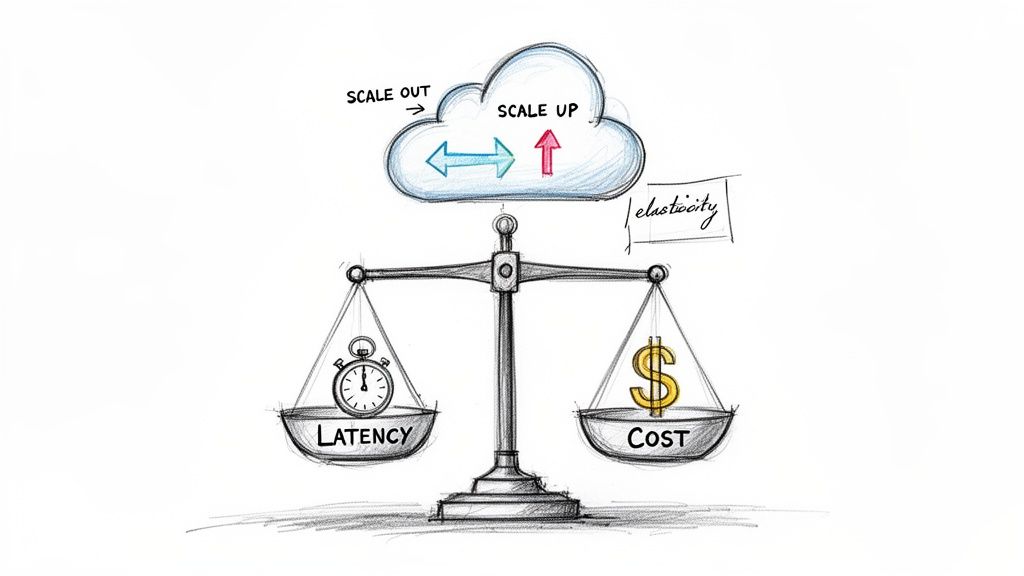
- Engineering Leads are concerned with tactical implementation: mapping application dependencies, selecting optimal cloud services (e.g., IaaS vs. PaaS vs. FaaS), and achieving performance and latency SLOs.
- Finance and Operations concentrate on financial metrics: modeling Total Cost of Ownership (TCO), calculating Return on Investment (ROI), and maintaining operational stability during and after the migration.
A consultation synthesizes these perspectives into a cohesive strategy. This ensures every technical decision, such as choosing to re-host a legacy application versus re-architecting it for a serverless paradigm, is directly mapped to a specific business outcome.
The demand for this expertise is accelerating. The global market is projected to grow from USD 19.03 billion in 2024 to USD 103.13 billion by 2032. This growth reflects the business imperative to modernize IT infrastructure to maintain competitive parity.
Immediate Risk Reduction Versus Long-Term Advantage
A consultation provides immediate tactical benefits, but its most significant impact is realized over the long term through a well-architected foundation.
A consultation provides the technical roadmap to prevent your cloud initiative from collapsing under its own weight. It’s about building for the future, not just moving for the present.
The table below contrasts the immediate risk mitigation with the long-term strategic gains.
Immediate vs Long-Term Value of a Cloud Migration Consultation
| Value Aspect | Immediate Benefit (First 90 Days) | Long-Term Advantage (1+ Years) |
|---|---|---|
| Cost Management | Avoids over-provisioning and budget overruns with a precise TCO model and rightsized resource allocation. | Enables mature FinOps practices, programmatic cost optimization via automation, and predictable capacity planning. |
| Security & Compliance | Identifies and remediates security vulnerabilities before migration, establishing a secure landing zone with robust IAM policies. | Creates a resilient, automated security posture that scales with infrastructure and adapts to emerging threats. |
| Operational Stability | Minimizes downtime and business disruption through phased rollouts and validated data migration plans. | Establishes a highly available, fault-tolerant, and automated operational environment governed by Infrastructure as Code (IaC). |
| Business Agility | Provides a clear, actionable roadmap and CI/CD integration that accelerates the initial migration velocity. | Fosters a DevOps culture, enabling rapid feature development, experimentation, and market responsiveness. |
Initially, the focus is tactical: implementing security guardrails, preventing wasted spend on oversized instances, and ensuring a smooth cutover. The long-term payoff is a cloud foundation that enables faster product development, unlocks advanced data analytics capabilities, and provides the agility to pivot business strategy in response to market dynamics. Our in-depth guide to cloud migration consulting further explores these long-term strategic advantages.
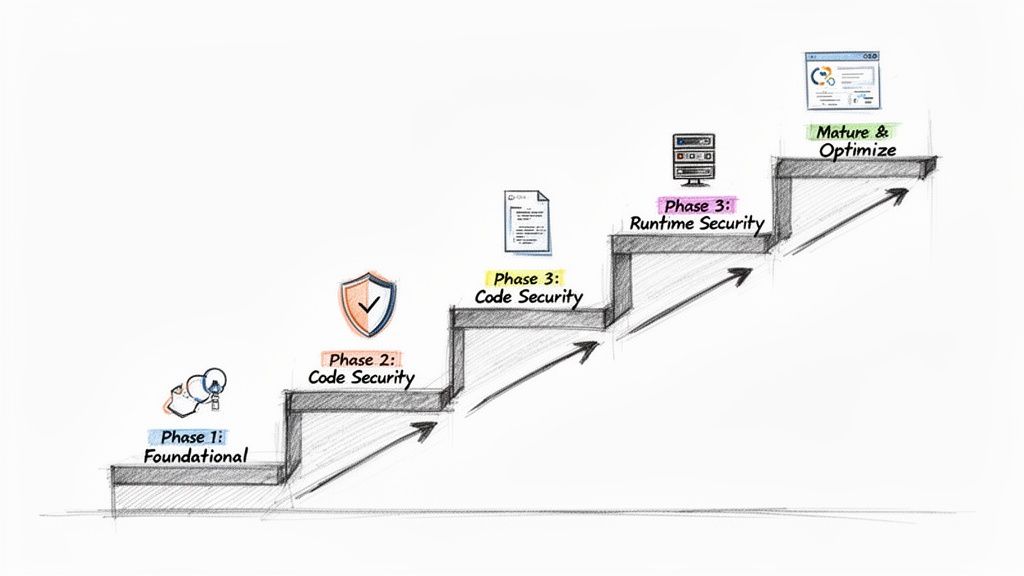
The Four Phases of a Technical Cloud Consultation
A professional cloud migration consultation is a structured, multi-phase process. It progresses from high-level discovery to continuous, data-driven optimization, ensuring the migration's success at launch and its sustained value over time.
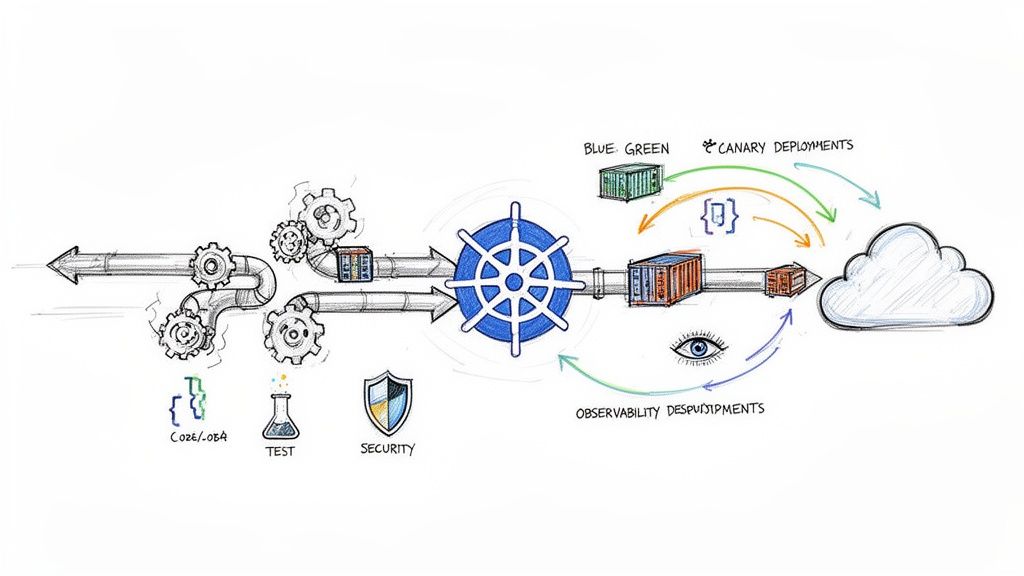
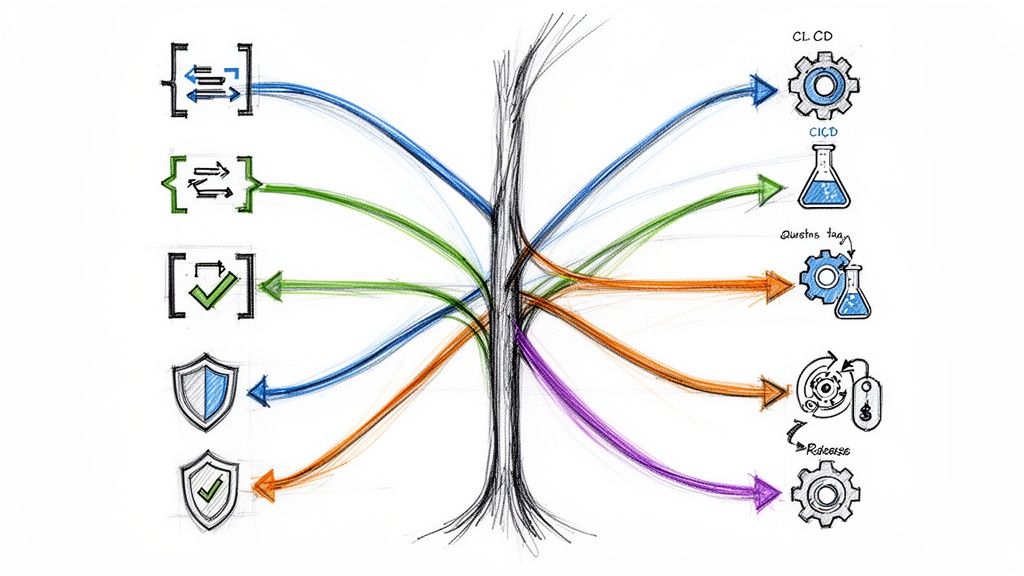
This diagram illustrates the cyclical nature of a well-executed cloud project, moving from design and build into a continuous optimization loop.
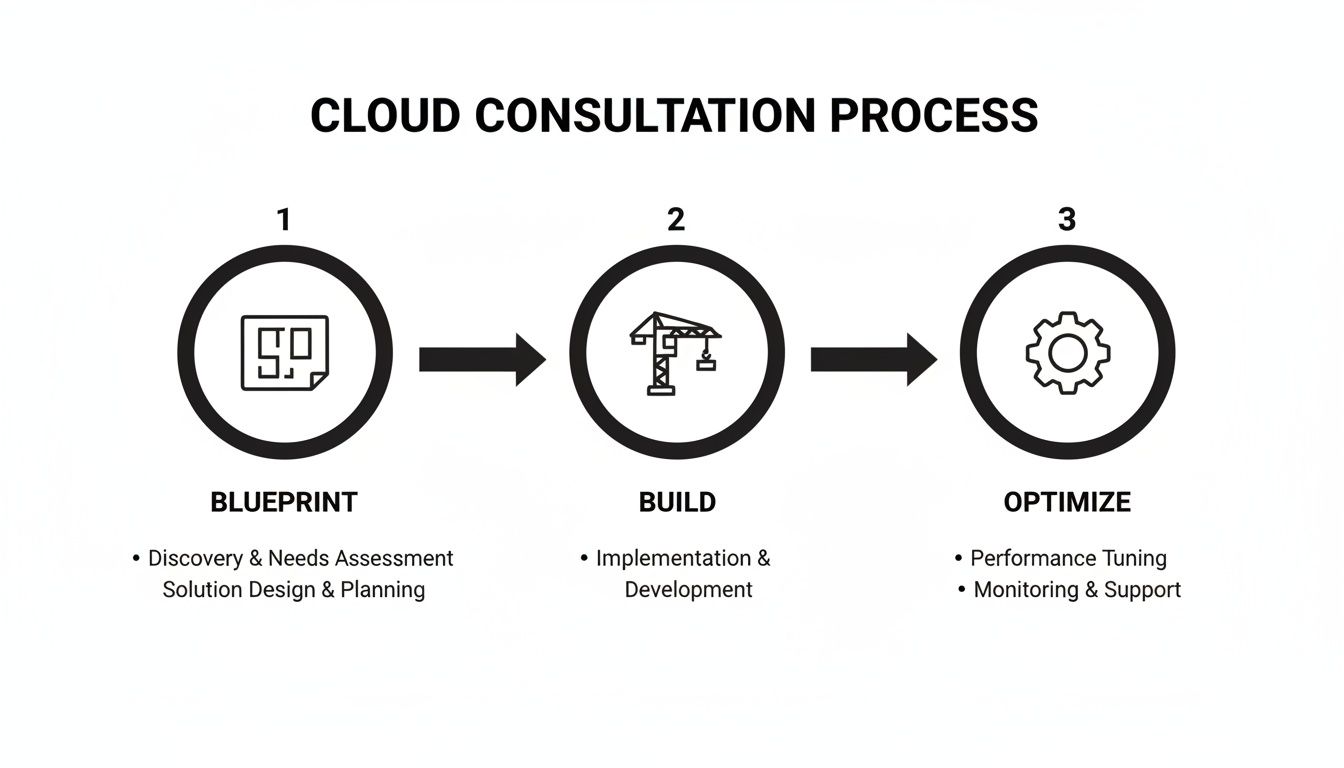
The "Optimize" phase continuously feeds performance and cost data back into future "Blueprint" and "Build" cycles, creating a flywheel of iterative improvement.
Phase 1: Discovery and Assessment
This foundational phase involves an exhaustive technical deep dive into your existing environment to replace assumptions with empirical data. The objective is to identify every dependency, performance baseline, and potential impediment before migration begins.
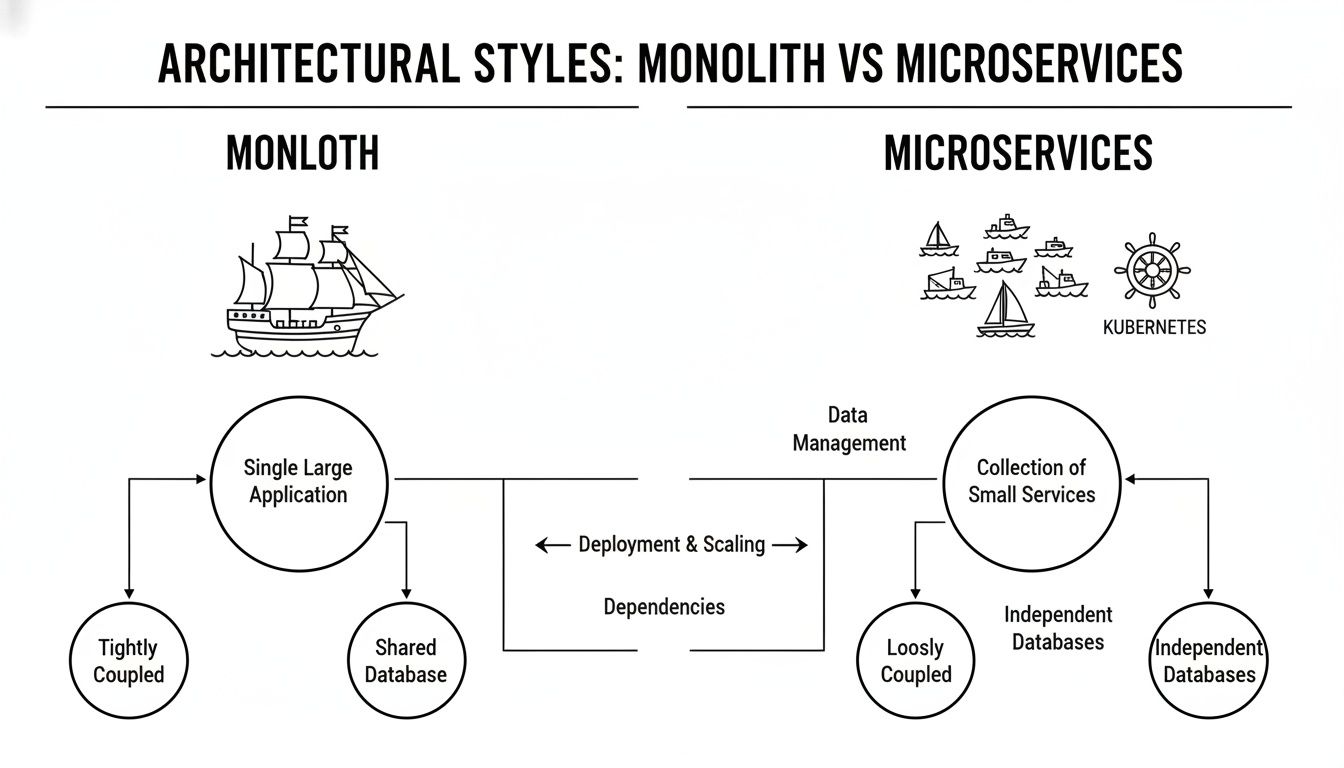
A core component is the application portfolio analysis. Consultants systematically catalog each application, documenting its architecture (e.g., monolithic, n-tier, microservices), business criticality, and current performance metrics (CPU/memory utilization, IOPS, network throughput). This is critical, as an estimated 60% of migration failures stem from inadequate infrastructure analysis.
Simultaneously, consultants perform dependency mapping. This involves using tooling to trace network connections and API calls between applications, databases, and third-party services. The outcome is a detailed dependency graph that prevents the common error of migrating a service while leaving a critical dependency on-premises, which can introduce fatal latency issues. This phase concludes with a granular Total Cost of Ownership (TCO) model that forecasts cloud spend and quantifies operational savings.
Phase 2: Strategy and Architectural Design
With a data-rich understanding of the current state, the consultation moves to designing the future-state cloud architecture. This phase translates business requirements into a technical blueprint.
A key decision is determining the appropriate migration pattern for each application, often referred to as the "6 R's" of migration:
- Rehost (Lift and Shift): Migrating applications as-is to IaaS. This is the fastest approach, suitable for legacy systems where code modification is infeasible, but it yields minimal cloud-native benefits.
- Replatform (Lift and Reshape): Making targeted cloud optimizations, such as migrating an on-premises Oracle database to a managed service like Amazon RDS. This balances migration velocity with tangible efficiency gains.
- Rearchitect (Refactor): Re-engineering applications to be cloud-native, often leveraging microservices, containers, or serverless functions. This approach unlocks the maximum long-term value in scalability, resilience, and cost-efficiency but requires the most significant upfront investment.
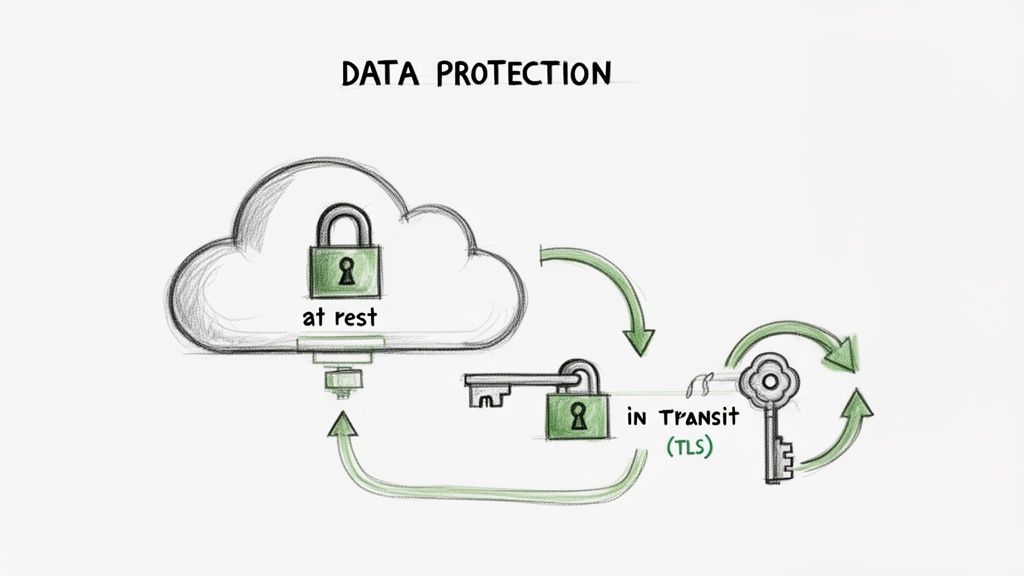
This phase also involves selecting the optimal cloud provider—AWS, Azure, or GCP—based on workload requirements, existing team skillsets, and service cost models. A robust security framework is architected, defining Identity and Access Management (IAM) roles, network segmentation via Virtual Private Clouds (VPCs) and subnets, and data encryption standards at rest and in transit.
The objective of the strategy phase is to design an architecture that is not only functional at launch but is also secure, cost-efficient, and engineered for future evolution.
Phase 3: Execution Governance
This phase focuses on the correct implementation of the architectural design, overseeing the tactical rollout while maintaining operational stability.
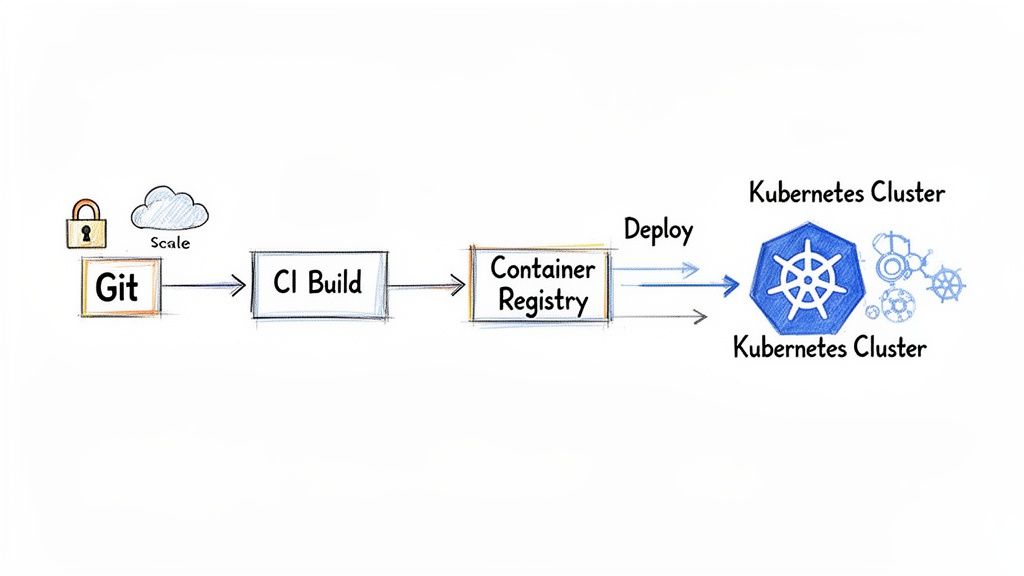
The initial step is typically the deployment of a landing zone—a pre-configured, secure, and scalable multi-account environment that serves as the foundation for all workloads. This ensures that networking, identity, logging, and security guardrails are established before any applications are migrated.
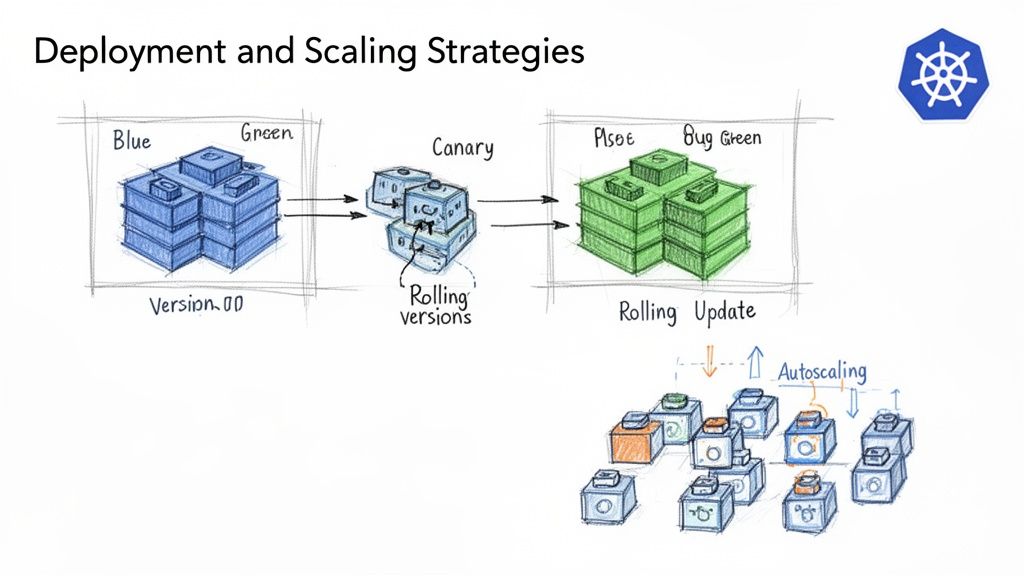
The focus then shifts to integrating the cloud environment with existing CI/CD pipelines, enabling automated testing and deployment. This is crucial for accelerating development velocity post-migration. Finally, this phase addresses complex data migration strategies, utilizing native tools like AWS Database Migration Service (DMS) or Azure Migrate to execute database migrations with minimal downtime through techniques like change data capture (CDC).
Phase 4: Continuous Optimization
The "go-live" event is the starting point for optimization, not the finish line. This ongoing phase focuses on continuous improvement in cost management, performance tuning, and operational excellence.
A key discipline is FinOps, which instills financial accountability into cloud consumption. Using tools like AWS Cost Explorer, teams monitor usage patterns, identify and eliminate waste (e.g., idle resources, unattached storage), and optimize resource allocation. Performance is continually monitored and tuned using observability platforms that provide deep insights into application health, user experience, and resource utilization.
This phase also involves maturing Infrastructure as Code (IaC) practices. By managing all cloud resources via declarative configuration files using tools like Terraform, infrastructure changes become repeatable, version-controlled, and auditable. This transforms infrastructure management from a manual, error-prone task into a programmatic, automated discipline.
Key Technical Benefits of Expert Guidance
A formal cloud migration consultation elevates a project from guesswork to a data-driven engineering initiative. The technical benefits manifest as measurable improvements in TCO, security posture, and development velocity.
A primary outcome is a significant reduction in Total Cost of Ownership (TCO). Teams migrating without expert guidance frequently over-provision resources, leading to substantial waste. A consultant analyzes historical performance metrics to right-size compute instances, storage tiers, and database capacity from day one, preventing budget overruns.
For example, a consultant will implement cost-saving strategies like AWS Reserved Instances or Azure Hybrid Benefit, which can reduce compute costs by up to 72%. This goes beyond a simple migration; it's about architecting for financial efficiency from the ground up.
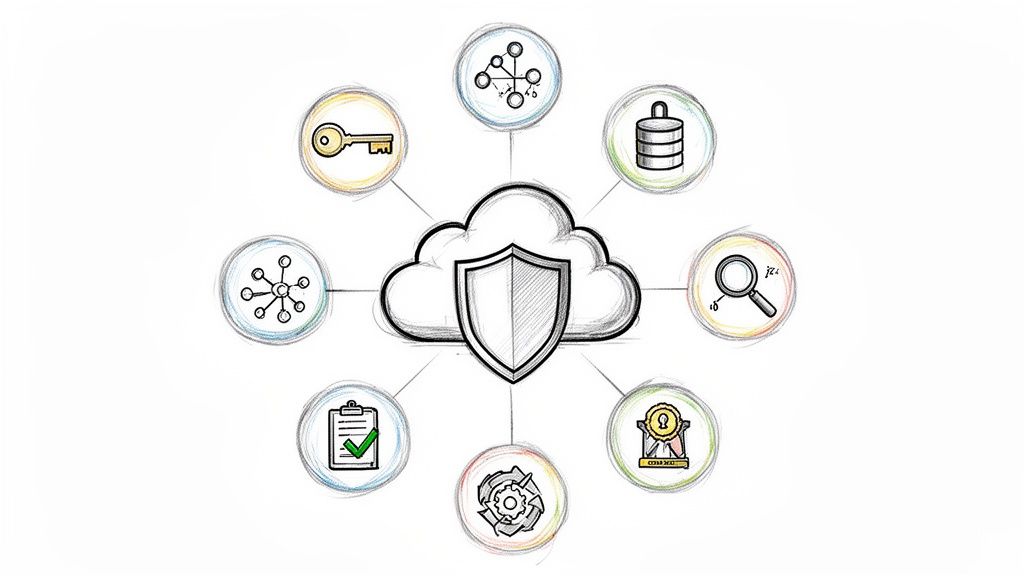
Embedding Security and Compliance from Day One
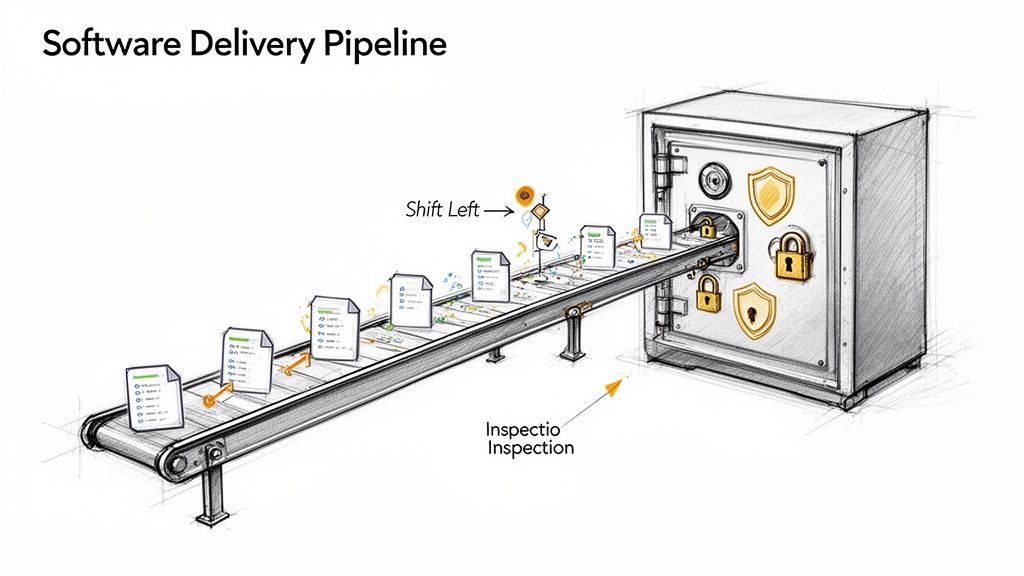
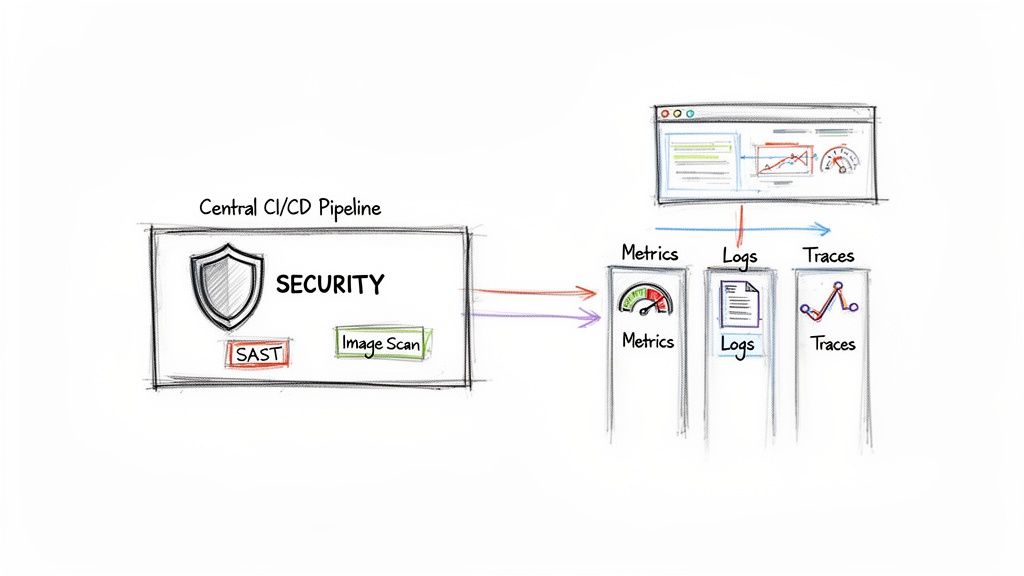
A critical technical benefit is embedding essential cloud computing security best practices into the core architecture. In self-managed migrations, security is often an afterthought, leading to vulnerabilities. A consultation inverts this model by integrating security and compliance into the design phase (a "shift-left" approach).
This proactive security posture includes several technical layers:
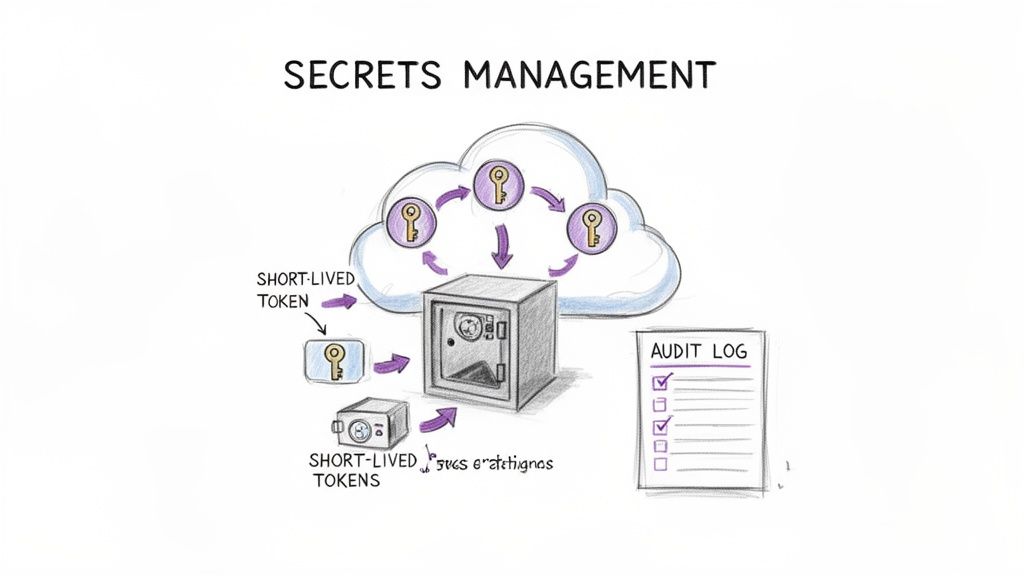
- Robust IAM Policies: Implementing granular Identity and Access Management (IAM) policies based on the principle of least privilege. This ensures that users and services possess only the permissions essential for their functions.
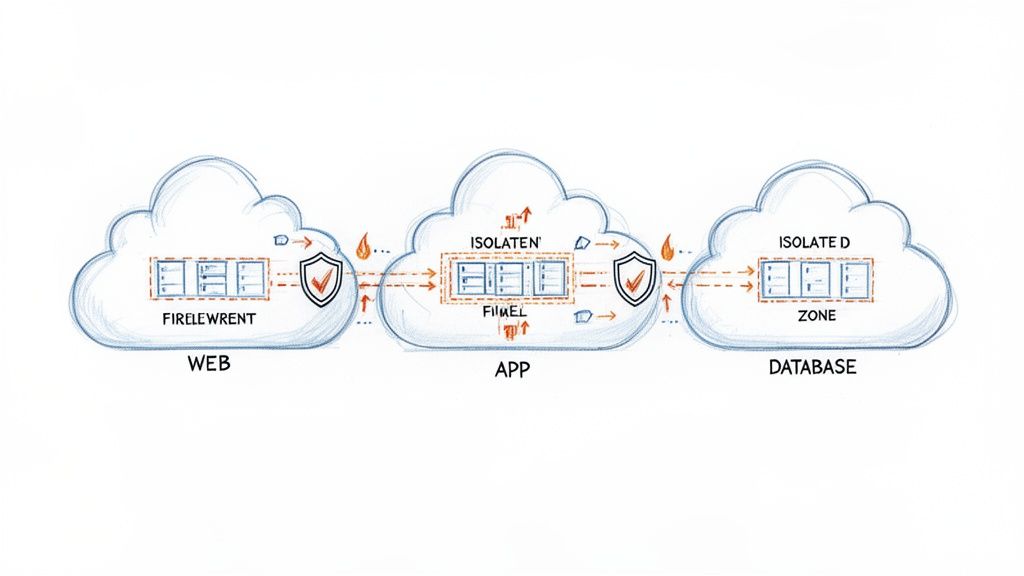
- Network Segmentation: Designing a secure network topology using Virtual Private Clouds (VPCs), subnets, and security groups to isolate workloads and control traffic flow, limiting the blast radius of a potential breach.
- Automated Compliance Checks: For regulated industries, consultants can implement infrastructure-as-code policies and use services like AWS Config or Azure Policy to continuously audit the environment against compliance standards like HIPAA, PCI-DSS, or GDPR.
This security-first methodology is now a business imperative. With North America projected to drive 44% of global growth in cloud migration services through 2029, this trend is fueled by escalating data volumes and persistent cyber threats. (Explore this expanding market and its security drivers on Research Nester). By engineering security controls from inception, you mitigate the risk of costly, reputation-damaging security incidents.
A well-architected migration doesn't just move your applications; it fundamentally fortifies your infrastructure against modern threats, turning security from a reactive task into a core architectural feature.
Accelerating Innovation with DevOps and Automation
Beyond cost and security, an expert-led migration acts as a catalyst for modernizing the software development lifecycle. A consultant's role is not merely to migrate servers but to establish a foundation for DevOps and automation.
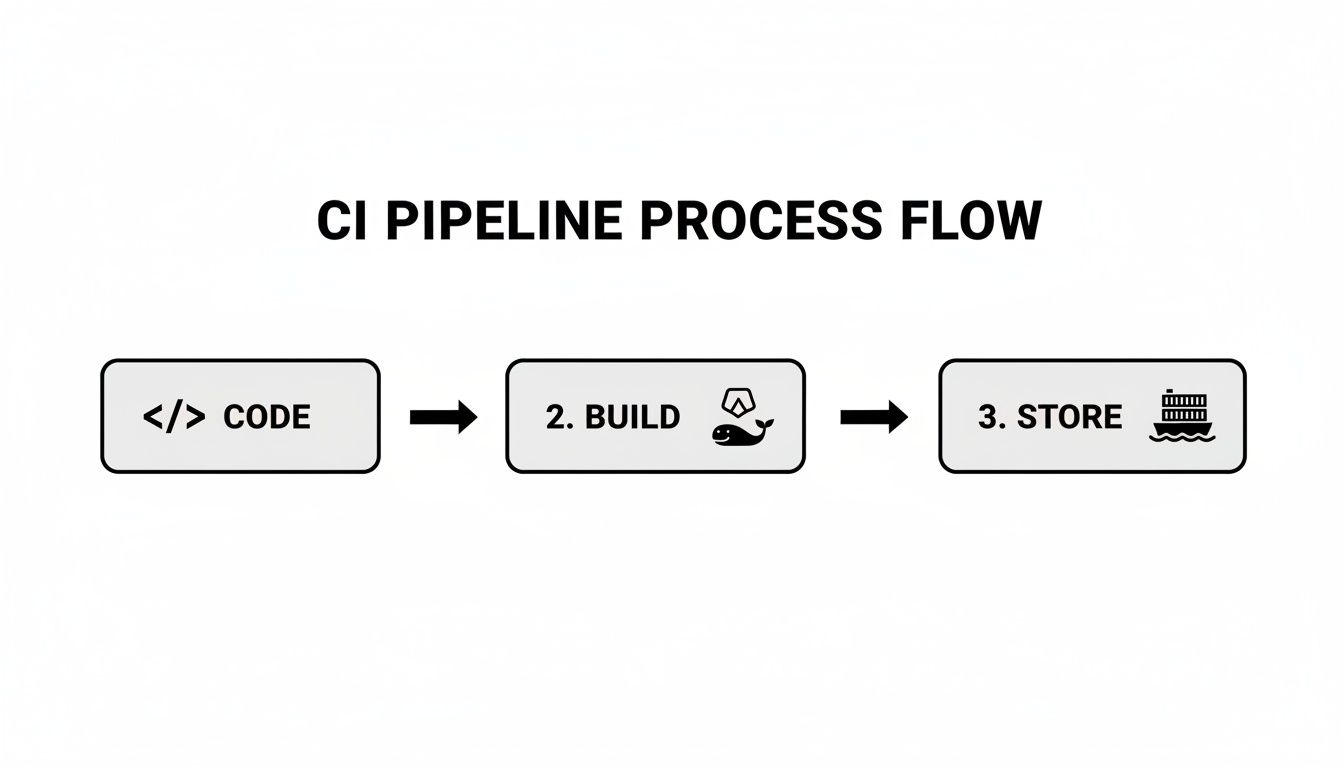
This unlocks significant capabilities. A well-designed migration strategy includes the setup of automated Continuous Integration/Continuous Deployment (CI/CD) pipelines. This enables developers to commit code that is automatically built, tested, and deployed to production environments, drastically reducing the lead time for changes.
This technical transformation provides a significant competitive advantage.
Real-World Example: A FinTech company was constrained by a manual infrastructure provisioning process that took weeks to stand up new development environments. During their migration consultation, experts recommended adopting an Infrastructure as Code (IaC) model using Terraform. By defining their infrastructure declaratively in code, the company reduced provisioning time from weeks to minutes. This enabled development teams to innovate and ship features at an unprecedented pace, transforming the infrastructure from a bottleneck into a business accelerator. This demonstrates the direct link between expert technical guidance and tangible innovation.
Preparing for Your Cloud Migration Consultation
The value derived from a cloud migration consultation is directly proportional to the quality of your preparation. Engaging a consultant without comprehensive data is inefficient; arriving armed with detailed technical information enables them to develop a viable, tailored strategy from the first meeting.
This is analogous to consulting a medical specialist. You would provide a detailed medical history and a list of specific symptoms. The more precise the input, the more accurate the diagnosis and effective the treatment plan. Effective preparation transforms a generic conversation into a productive, results-oriented technical workshop.
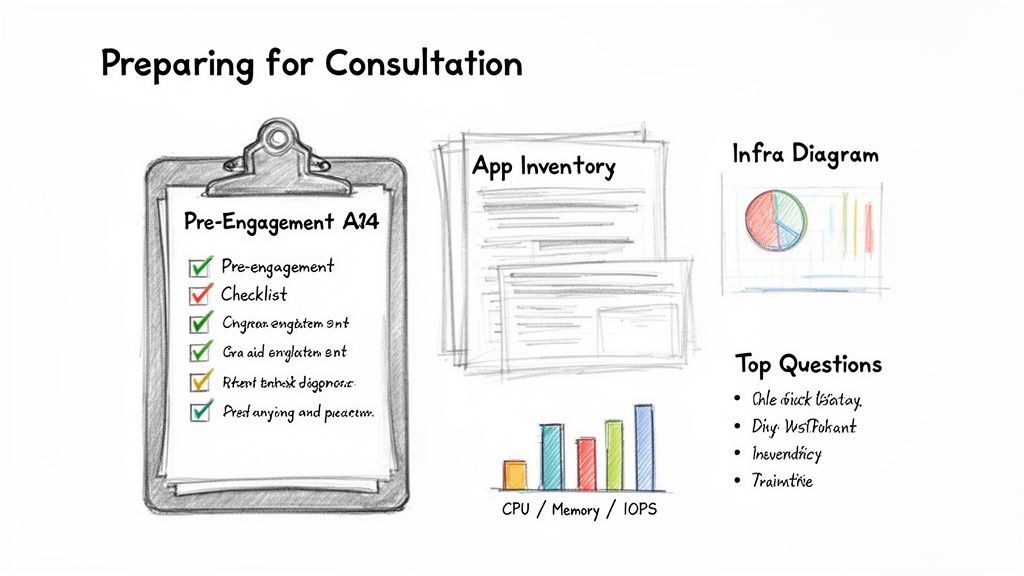
Your Pre-Engagement Technical Checklist
Before engaging a consultant, your technical team must compile a detailed dossier of your current environment. This documentation serves as the single source of truth from which a migration plan can be engineered. Neglecting this step is a primary cause of migration failure.
Your pre-engagement checklist must include:
- Detailed Application Inventory: A comprehensive catalog (e.g., in a spreadsheet or CMDB) of all applications, their business purpose, ownership, and criticality. Document the technology stack (e.g., Java, .NET, Node.js), architecture, and all database and service dependencies.
- Current Infrastructure Diagrams: Up-to-date network and architecture diagrams illustrating data flows, server locations, and inter-service communication paths.
- Performance and Utilization Metrics: Hard data from monitoring tools showing average and peak CPU utilization, memory usage, disk I/O (IOPS), and network throughput for key servers and applications over a representative period (e.g., 30-90 days).
- Security and Compliance Mandates: A definitive list of all regulatory requirements (HIPAA, PCI-DSS, GDPR, etc.) and internal security policies, including data residency constraints that will influence the cloud architecture.
Compiling this information provides a consultant with a data-driven baseline from day one. You can explore the complete migration journey in this guide on how to migrate to cloud.
Incisive Questions to Vet Potential Consultants
With your documentation prepared, you can begin vetting potential partners. The objective is to penetrate marketing claims and assess their genuine, hands-on technical expertise. Asking targeted questions reveals their technical depth, strategic thinking, and suitability for your specific challenges.
A consultant's value isn't just in their cloud knowledge, but in their ability to apply that knowledge to your unique technical stack and business context. Asking the right questions is how you find that fit.
Use these ten technical questions to vet potential consultants:
- Describe your methodology for migrating stateful, monolithic applications similar to ours.
- What is your direct experience with our specific technology stack (e.g., Kubernetes on-prem, serverless architectures, specific database engines)?
- Walk me through your technical process for automated dependency mapping and risk identification.
- What specific KPIs and SLOs do you use to define and measure a technically successful migration?
- How do you implement FinOps and continuous cost optimization programmatically after the initial migration?
- Describe a complex, unexpected technical challenge you encountered on a past migration and the engineering solution you implemented.
- What is your methodology for designing and implementing a secure landing zone using Infrastructure as Code?
- How will you integrate with our existing CI/CD pipelines and DevOps toolchains?
- Can you provide a technical reference from a company with a similar scale and compliance posture?
- What is your process for knowledge transfer and upskilling our internal engineering team post-migration?
Choosing the Right Consultation Engagement Model
Cloud migration consulting is not a monolithic service. The engagement model you choose will significantly impact your project's budget, timeline, and the degree of knowledge transfer to your internal team.
The goal is to align the consultant's role with your organization's specific needs and internal capabilities. A mismatch creates friction. A highly skilled engineering team may not need a fully managed project, while a team new to the cloud will require significant hands-on guidance.
The demand for this expertise is growing rapidly; worldwide cloud services markets are projected to see a USD 17.76 billion increase between 2024 and 2029. This growth is a component of a larger digital transformation trend, with the market expected to reach USD 70.34 billion by 2030. You can analyze the drivers behind this cloud services market growth on Technavio.com.
Strategic Advisory vs. Turnkey Project Delivery
A Strategic Advisory engagement is analogous to hiring a chief architect. The consultant provides high-level architectural blueprints, technology selection guidance, and a strategic roadmap. They do not perform the hands-on implementation. This model is ideal for organizations with a capable internal engineering team that requires expert guidance on complex architectural decisions, such as designing a multi-region, disaster recovery strategy.
Conversely, Turnkey Project Delivery is a fully managed, end-to-end service where the consultant's team assumes full responsibility for the migration, from initial assessment to final cutover and hypercare support. This is the optimal model for organizations lacking the internal bandwidth or specialized skills required to execute the migration themselves, ensuring a professional, on-time delivery with minimal disruption.
Team Augmentation vs. Managed Services
Team Augmentation is a hybrid model where a consultant embeds senior cloud or DevOps engineers directly into your existing team. This approach accelerates the project while simultaneously upskilling your internal staff through direct knowledge transfer and paired work. The embedded expert works alongside your engineers, disseminating best practices and hands-on expertise. This model is particularly effective when you need a DevOps consulting company to provide targeted, specialized skills where they are most needed.
The right model isn't just about getting the work done; it's about building lasting internal capability. Team augmentation, for example, leaves your team stronger and more self-sufficient long after the consultant is gone.
Finally, Post-Migration Managed Services provides ongoing operational support after the go-live. This model covers tasks such as cost optimization, security monitoring, performance tuning, and incident response. It is ideal for organizations that want to ensure their cloud environment remains efficient and secure without dedicating a full-time internal team to post-migration operations.
At OpsMoon, we provide flexible engagement across all these models to ensure you receive the precise level of support required.
Comparison of Cloud Consultation Engagement Models
This comparison helps you select the engagement model that best aligns with your organization's needs, resources, and project scope.
| Engagement Model | Best For | Cost Structure | OpsMoon Offering |
|---|---|---|---|
| Strategic Advisory | Teams requiring high-level architectural design, technology selection, and roadmap planning. | Fixed-price for deliverables or retainer-based. | Free architect hours and strategic planning sessions. |
| Turnkey Project | Businesses needing a fully outsourced, end-to-end migration execution with defined outcomes. | Fixed-price project scope or time and materials. | Full project delivery with dedicated project management. |
| Team Augmentation | Organizations seeking to upskill their internal team by embedding senior cloud/DevOps experts. | Hourly or daily rates for dedicated engineers. | Experts Matcher to embed top 0.7% of global talent. |
| Managed Services | Companies requiring ongoing post-migration optimization, security, and operational support. | Monthly recurring retainer based on scope. | Continuous improvement cycles and ongoing support. |
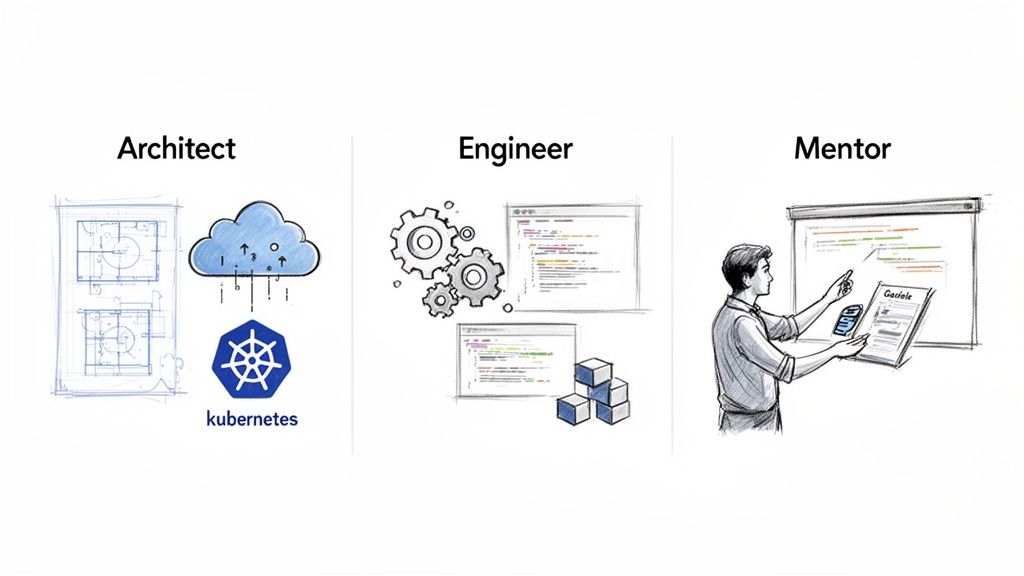
The optimal model is determined by your starting point and long-term objectives. Whether you require a strategic guide, an end-to-end execution partner, a skilled mentor for your team, or an ongoing operator for your cloud environment, there is an engagement model to fit your needs.
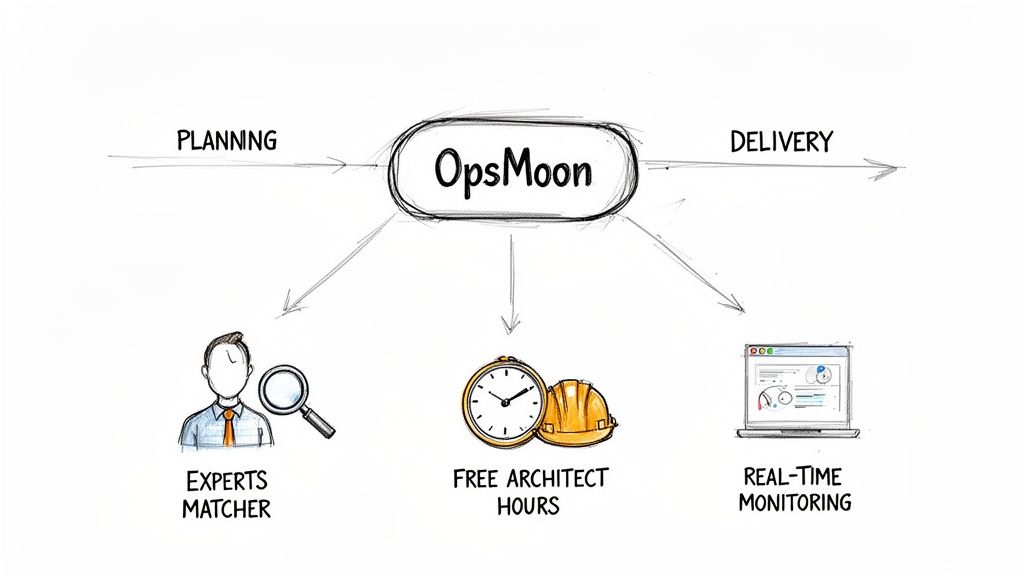
How OpsMoon Executes Your Cloud Migration
Translating a high-level strategy into a successful production implementation is where many cloud migrations fail. OpsMoon bridges this gap by serving as a dedicated execution partner. We combine elite engineering talent with a transparent, technically rigorous process to convert your cloud blueprint into a production-ready system.
Our process begins with free work planning sessions. Before any engagement, our senior architects collaborate with your team to develop a concrete project blueprint. This is a technical deep dive designed to establish clear objectives, map dependencies, and de-risk the project from the outset.
Connecting You with Elite Engineering Talent
The success of a cloud migration depends on the caliber of the engineers executing the work. Generic talent pools are insufficient for complex technical challenges. Our Experts Matcher technology addresses this directly.
This system provides access to the top 0.7% of vetted global DevOps and cloud talent. We identify engineers with proven, hands-on experience in your specific technology stack, whether it involves Kubernetes, Terraform, or complex serverless architectures. This precision matching ensures your project is executed by specialists who can solve problems efficiently and build resilient, scalable systems.
An exceptional strategy is only as good as the engineers who implement it. By connecting you with the absolute best in the field, we ensure your architectural vision is executed with technical excellence.
A Radically Transparent and Flexible Process
We operate on the principle of radical transparency. From project inception, you receive real-time progress monitoring, providing complete visibility into engineering tasks, milestone tracking, and overall project health.
Our process is defined by key differentiators designed to deliver value and mitigate risk:
- Free Architect Hours: We invest in your success upfront. These complimentary sessions with our senior architects ensure the initial plan is technically sound, accurate, and aligned with your business objectives, establishing a solid foundation.
- Adaptable Engagement Models: We adapt to your needs, whether you require a full turnkey project, expert team augmentation, or ongoing managed services. This flexibility ensures you receive the exact support you need.
- Continuous Improvement Cycles: Our work continues after deployment. We implement feedback loops and optimization cycles to ensure your cloud environment continuously evolves, improves, and delivers increasing value over time.
By combining a concrete planning process, elite engineering talent, and a transparent execution framework, OpsMoon provides a superior cloud migration consultation experience. We partner with you to build, manage, and optimize your cloud environment, ensuring your migration is a technical success that drives business forward.
Frequently Asked Questions
When considering a cloud migration consultation, numerous questions arise, from high-level strategy to specific technical implementation details. Here are concise answers to the most common questions.
How Long Does a Typical Consultation Last?
The duration depends on the complexity of your environment. For a small to medium-sized business with a few non-critical applications, the initial assessment and strategy phase typically lasts 2 to 4 weeks.
For a large enterprise with complex legacy systems, stringent compliance requirements, and extensive inter-dependencies, this initial phase can extend to 8 to 12 weeks or more. The objective is architectural correctness, not speed. A rushed discovery phase invariably leads to costly post-migration remediation. The engagement model also affects the timeline; a strategic advisory engagement is shorter than an end-to-end turnkey project.
What Are the Biggest Technical Risks in a Migration?
The most significant technical risks are often un-discovered dependencies and inadequate performance planning. A common failure pattern is migrating an application to the cloud while leaving a highly coupled, low-latency database on-premises, resulting in catastrophic performance degradation due to network latency.
The most dangerous risks in a migration are the ones you don't discover until after you've gone live. A proper consultation is about aggressively finding and neutralizing these hidden threats before they can cause damage.
Other major technical risks include:
- Security Misconfigurations: Improperly configured IAM roles or overly permissive security groups can lead to data exposure. This must be addressed from day one.
- Data Loss or Corruption: A poorly executed database migration can result in irreversible data corruption. A validated backup and rollback strategy is non-negotiable.
- Vendor Lock-In: Over-reliance on a cloud provider's proprietary, non-portable services can make future architectural changes or multi-cloud strategies prohibitively difficult and expensive.
How Do We Ensure Our Team Is Ready?
Upskilling your internal team is as critical as the technical migration itself. A high-quality consultation includes knowledge transfer as a core deliverable. The most effective method for team readiness is to embed your engineers in the process from the beginning.
Your engineers should participate in architectural design sessions and pair-program with consultants during the implementation phase. Post-migration, formal training on new operational paradigms, such as managing Infrastructure as Code (IaC) or utilizing cloud cost management tools, is essential. When your team is actively involved, the migration becomes a project they own and can confidently manage long-term.
A successful migration starts with the right partner. OpsMoon provides the expert guidance and elite engineering talent to turn your cloud strategy into a secure, scalable reality. Get started with a free work planning session today and build your cloud foundation the right way.