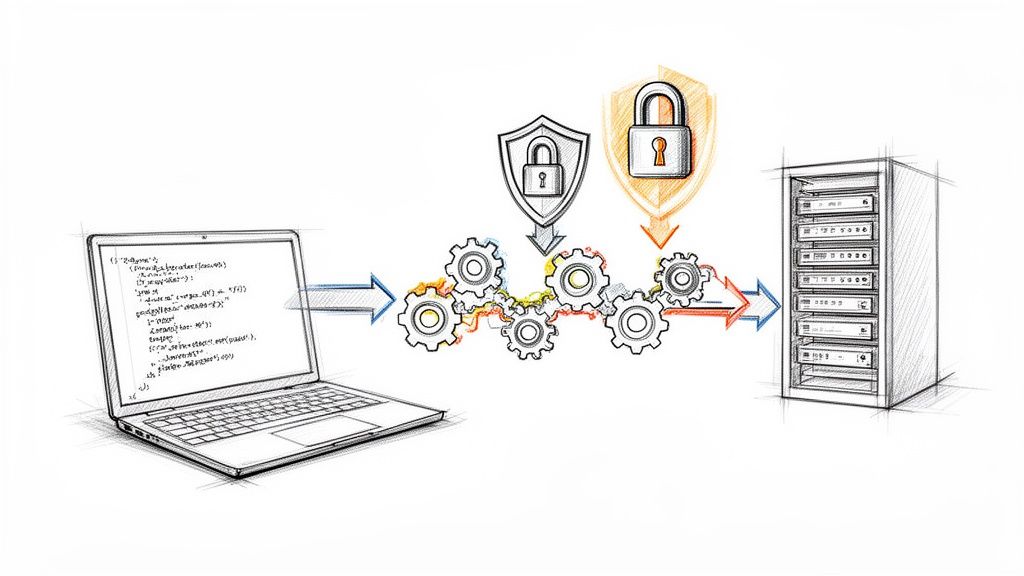
Security coding practices are the discipline of writing code to prevent the introduction of vulnerabilities. It is a proactive engineering mindset that embeds security directly into the software development lifecycle, building resilient software from the first line of code rather than treating security as a post-development compliance check.
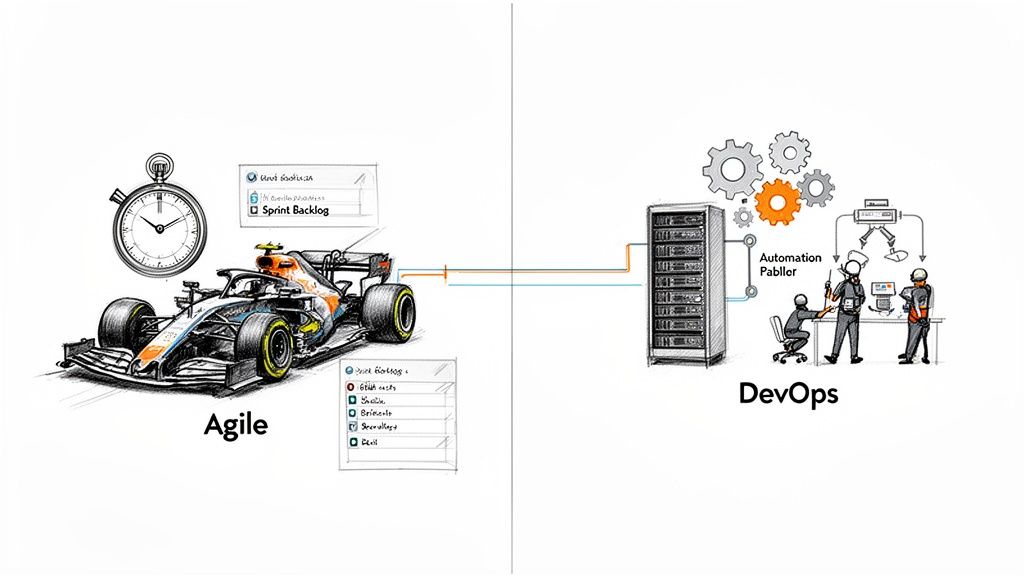
Shifting Security Left in High-Velocity DevOps
In rapid CI/CD cycles, the pressure to ship features often creates a dangerous gap between development velocity and security diligence. Treating security as a final-stage, pre-release gate is a common anti-pattern that introduces vulnerabilities that are exponentially more expensive and complex to remediate post-deployment.
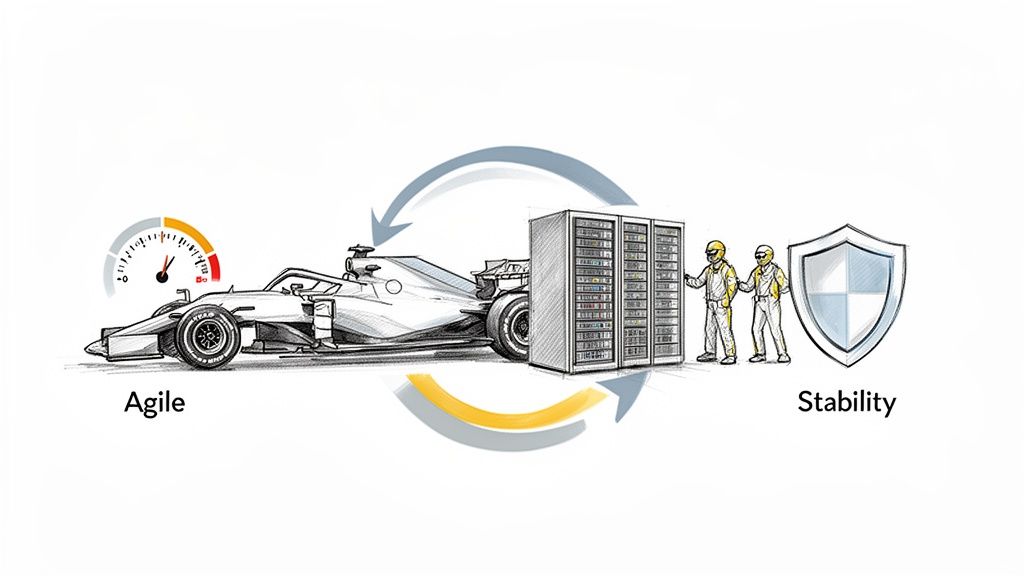
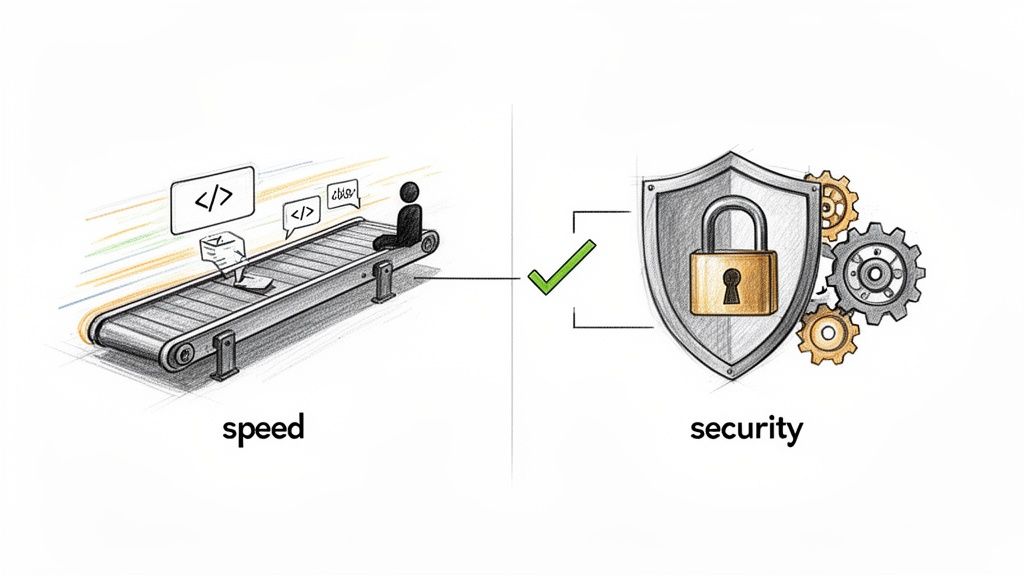
The key is to reframe security not as a bottleneck, but as an essential quality gate that enables faster, more reliable delivery. It's about architecting speed and security to work in tandem.
This "shift left" strategy requires embedding security expertise and automated tooling directly into developer workflows. When security becomes a shared responsibility, owned by engineering teams, it transforms from a burdensome task into a competitive advantage. This developer-first approach is about building robust systems from the ground up.
The Growing Maturity Gap
The uncomfortable truth is that despite the acceleration in software delivery, the industry's application security posture is lagging. A striking analysis reveals that 43% of organizations still operate at the lowest maturity level for application security.
This means nearly half of all enterprises are building software faster than ever while neglecting the fundamental security controls needed to protect it. You can explore the full context of these application security strategy findings from Gartner to get a better sense of the landscape.
This disparity demands integrated, proactive security. It is no longer sufficient to find vulnerabilities; modern engineering teams must prevent them from being written in the first place.
"In high-velocity environments, security can't be a separate team's problem. It must be an inherent property of the code itself, owned by the developers who write it. The goal is to make the secure way the easy way."
Achieving this means understanding the technical and cultural differences between a reactive, low-maturity security posture and a proactive, high-maturity one. The table below breaks down these key distinctions in a modern DevOps context.
Secure Coding Maturity Levels At a Glance
| Characteristic | Low-Maturity (Reactive) | High-Maturity (Proactive) |
|---|---|---|
| Timing of Security | End-of-cycle, pre-release scans | Continuous, from IDE to production |
| Responsibility | Security team's problem | Shared responsibility (Dev + Sec + Ops) |
| Tooling | Standalone, disruptive scanners | Integrated into CI/CD and developer tools |
| Remediation | Slow, manual, and expensive | Fast, automated, developer-led fixes |
| Focus | Finding vulnerabilities (detection) | Preventing vulnerabilities (prevention) |
| Culture | "Gatekeeper" mentality | "Enabler" mentality, security champions |
The reactive approach treats security as a series of intermittent, high-friction checks. In contrast, a high-maturity organization weaves security into the very fabric of the software development lifecycle. By adopting proactive measures, your teams don't just fix vulnerabilities—they build systems that are inherently more resistant to them. This guide provides the technical blueprints to facilitate that transition.
Implementing Foundational Secure Coding Principles
Let's translate high-level theory into concrete engineering practice. The objective is not developer memorization of abstract rules, but the integration of core security principles directly into daily coding habits. The ultimate goal is to make the secure implementation path the one of least resistance.
This section focuses on turning principles like least privilege, defense in depth, and fail-securely into specific, repeatable coding patterns. Mastering these fundamentals eliminates entire classes of vulnerabilities before they can reach a production environment.
The Core Tenet: Input Validation and Output Encoding
Nearly every major web vulnerability—from SQL injection to Cross-Site Scripting (XSS)—stems from a single root cause: misplaced trust in data originating from an external source. The foundational rule of secure coding is to treat all external input as untrusted. This applies to data from user forms, API endpoints, file uploads, database queries, and any system outside of your direct control.
The solution is a two-step process that is simple in concept but requires disciplined execution.
- Validate on Input: Enforce strict validation rules for all incoming data. Instead of blacklisting known-bad patterns, adopt an allowlist approach: define the exact format, character set, length, and type of data that is acceptable and reject everything else.
- Encode on Output: Before rendering data back to a user or passing it to another system (e.g., a database, a shell command), encode it for the specific context in which it will be used. This neutralizes potentially malicious characters, rendering them inert.
Consider a classic SQL injection vulnerability in Python.
Insecure Python (SQL Injection Vulnerability):
import psycopg2

def get_user(email):
    conn = psycopg2.connect("dbname=test user=postgres")
    cur = conn.cursor()
    # CRITICAL VULNERABILITY: Raw user input is concatenated into the SQL query string.
    query = "SELECT * FROM users WHERE email = '" + email + "'"
    cur.execute(query)
    user = cur.fetchone()
    return user
An attacker can inject a malicious payload like ' OR '1'='1' -- to bypass authentication. The correct implementation uses parameterized queries (prepared statements), which separate the SQL command logic from the data.
Secure Python (Using Parameterized Queries):
import psycopg2

def get_secure_user(email):
    conn = psycopg2.connect("dbname=test user=postgres")
    cur = conn.cursor()
    # The database driver handles safe substitution. The 'email' variable is treated strictly as data.
    query = "SELECT * FROM users WHERE email = %s"
    cur.execute(query, (email,))
    user = cur.fetchone()
    return user
This single change makes the code immune to SQL injection. The database engine is explicitly instructed to treat the email variable as a data literal, never as executable SQL code.
Applying the Principle of Least Privilege
The principle of least privilege dictates that a component must only be granted the minimum permissions necessary to perform its intended function. This is a damage containment strategy: if a component is compromised, the attacker's ability to escalate privileges or move laterally is severely restricted.
Practical implementation examples include:
- Database Users: The application should not connect to the database with
rootordboprivileges. A microservice responsible for reading product data should use a database role with onlySELECTpermissions on theproductstable, with noUPDATE,INSERT, orDELETEgrants. - API Tokens: Scopes for API keys and OAuth tokens must be narrowly defined. A token used for fetching user profiles must not have permissions to modify billing configurations.
- File System Access: A web server process should only have write access to specific directories required for its operation (e.g.,
/var/www/uploads,/tmp/cache). All other file system paths should be read-only or entirely inaccessible.
By enforcing least privilege, you contain the "blast radius" of a security breach. An attacker who pops one service shouldn't be able to pivot and own your entire infrastructure.
This mindset is more critical than ever. Code vulnerabilities are now the number one application security worry for pros worldwide. A recent survey found a staggering 59% of respondents cited this as their top concern, showing just how much organizations are still struggling with the basics.
Defense in Depth and Failing Securely
Defense in depth is the strategy of layering multiple, redundant security controls. The assumption is that any single control may fail; therefore, subsequent layers must be in place to mitigate the threat. For a typical web application, this layered defense might include:
- A Web Application Firewall (WAF) to filter common attack patterns at the network edge.
- Strict input validation within the application code to reject malformed data that bypasses the WAF.
- Parameterized queries to prevent SQL injection even if malicious input somehow passes validation.
Finally, applications must be designed to fail securely. In the event of an error or unexpected state, the default behavior must be to deny access or functionality, not grant it.
Consider this example in Go for checking permissions:
func CanAccessResource(user User, resourceID string) bool {
    permissions, err := fetchUserPermissions(user.ID)
    if err != nil {
        // Fail securely. If permission data is unavailable, default to denying access.
        log.Printf("Error fetching permissions for user %s: %v", user.ID, err)
        return false
    }

    // Explicitly check permissions only after a successful fetch.
    return permissions.HasAccess(resourceID)
}
The function immediately defaults to false (access denied) if there's any error in fetching permissions. This simple pattern prevents a transient network error from inadvertently creating a security vulnerability. For a deeper dive into these foundational concepts, check out these security best practices for web applications.
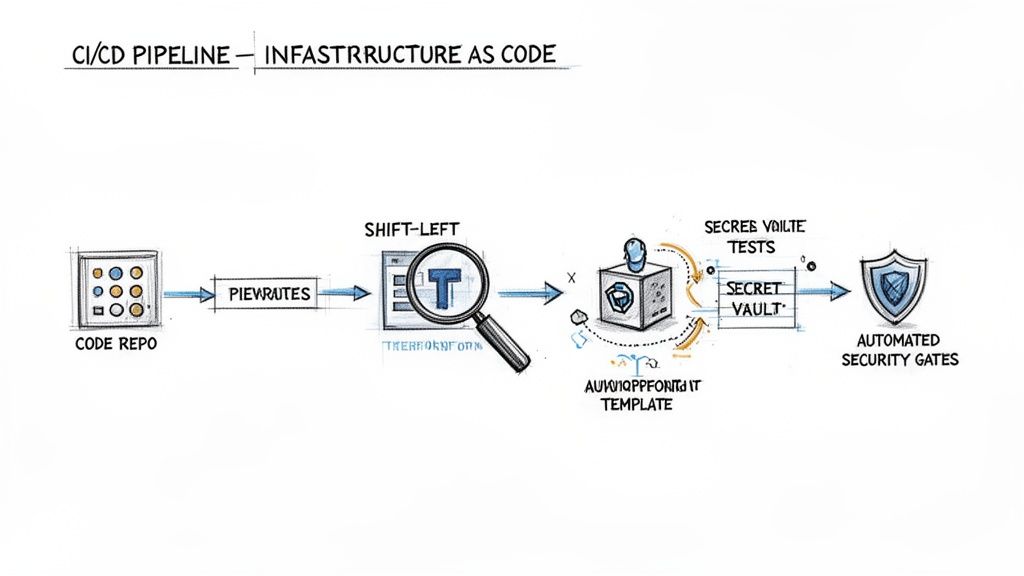
Integrating Automated Security into Your CI/CD Pipeline
"Shift left" is a practical mandate for modern software development. To maintain velocity, security analysis must be an automated, integral part of the CI/CD pipeline. Manual security reviews are a bottleneck; they are slow, error-prone, and do not scale with the pace of modern engineering.
The goal is to provide developers with immediate, context-aware, and actionable security feedback directly within their existing workflows. This transforms the pipeline from a build-and-deploy mechanism into an active security enforcement gate. This is achieved by embedding various security scanning tools directly into the build process.
For any mature security posture, it is critical to leverage tools for static vs dynamic code analysis to detect vulnerabilities before code is deployed. Each tool category serves a distinct purpose at different stages of the development lifecycle.
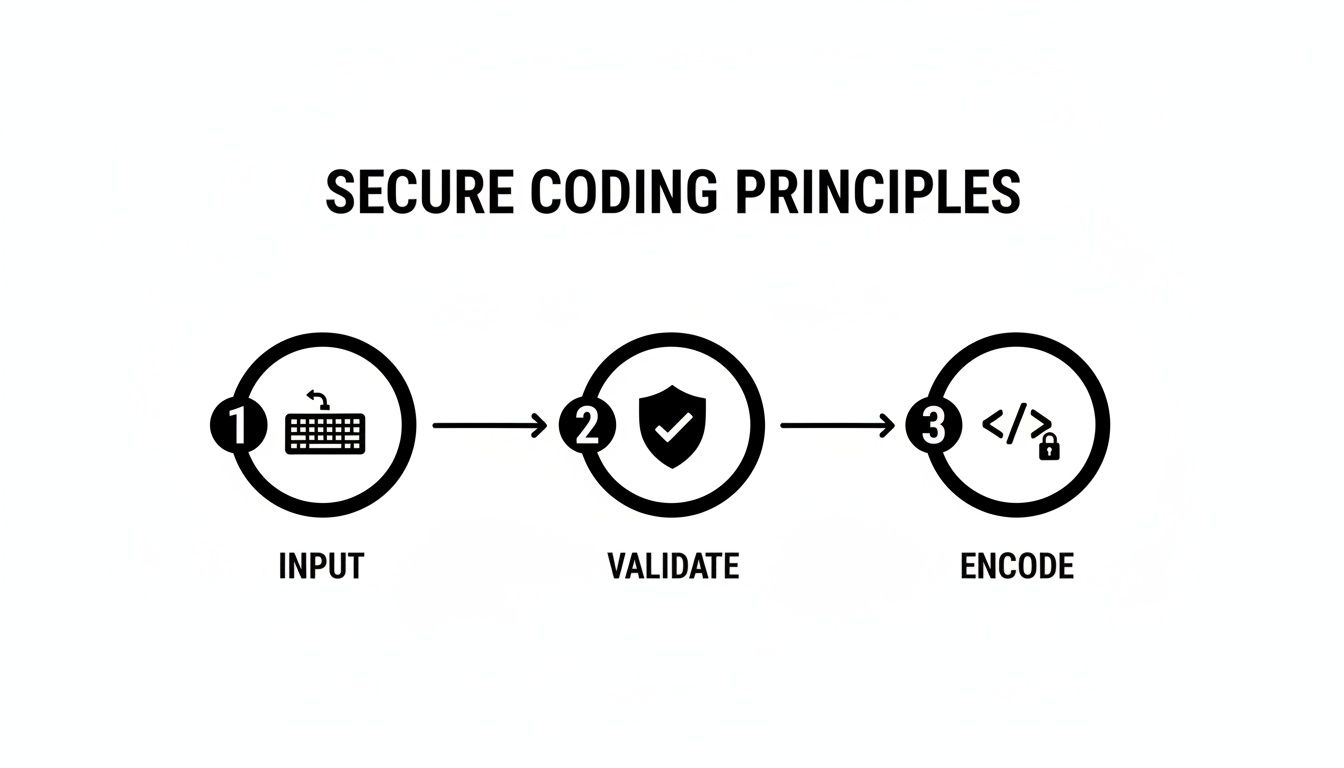
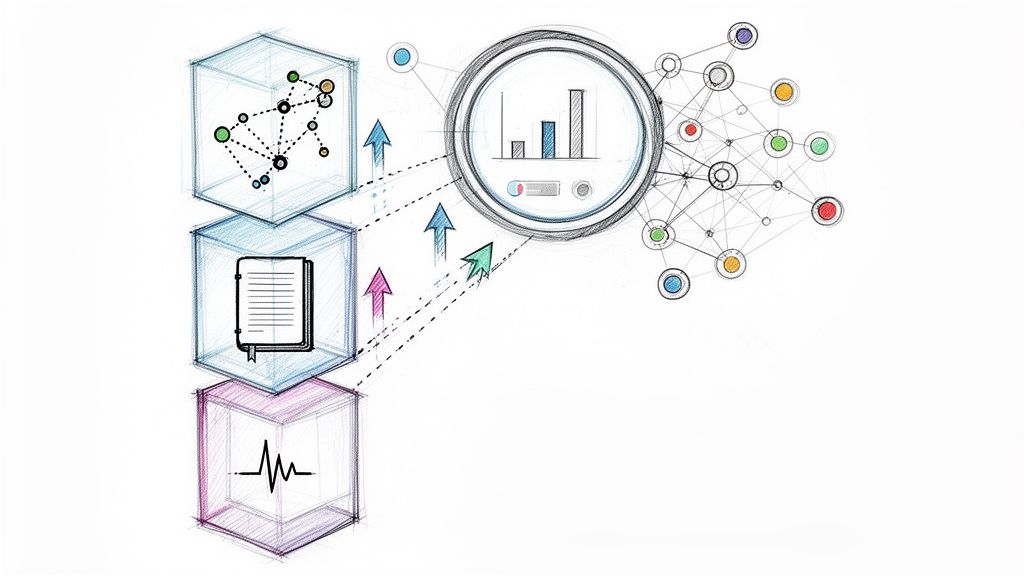
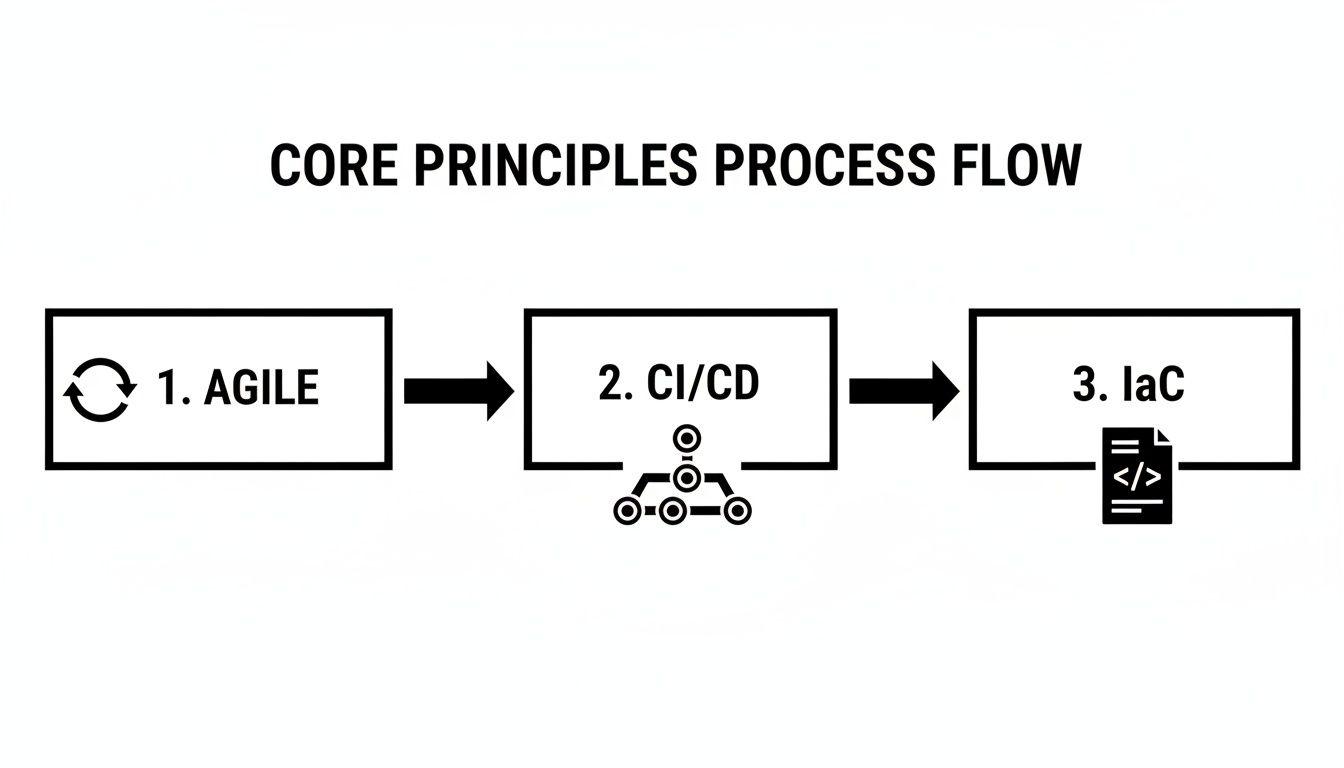
This flow illustrates a core security principle automated tools can help enforce: never trust external data. Always validate its structure first, then encode it appropriately for its destination context.
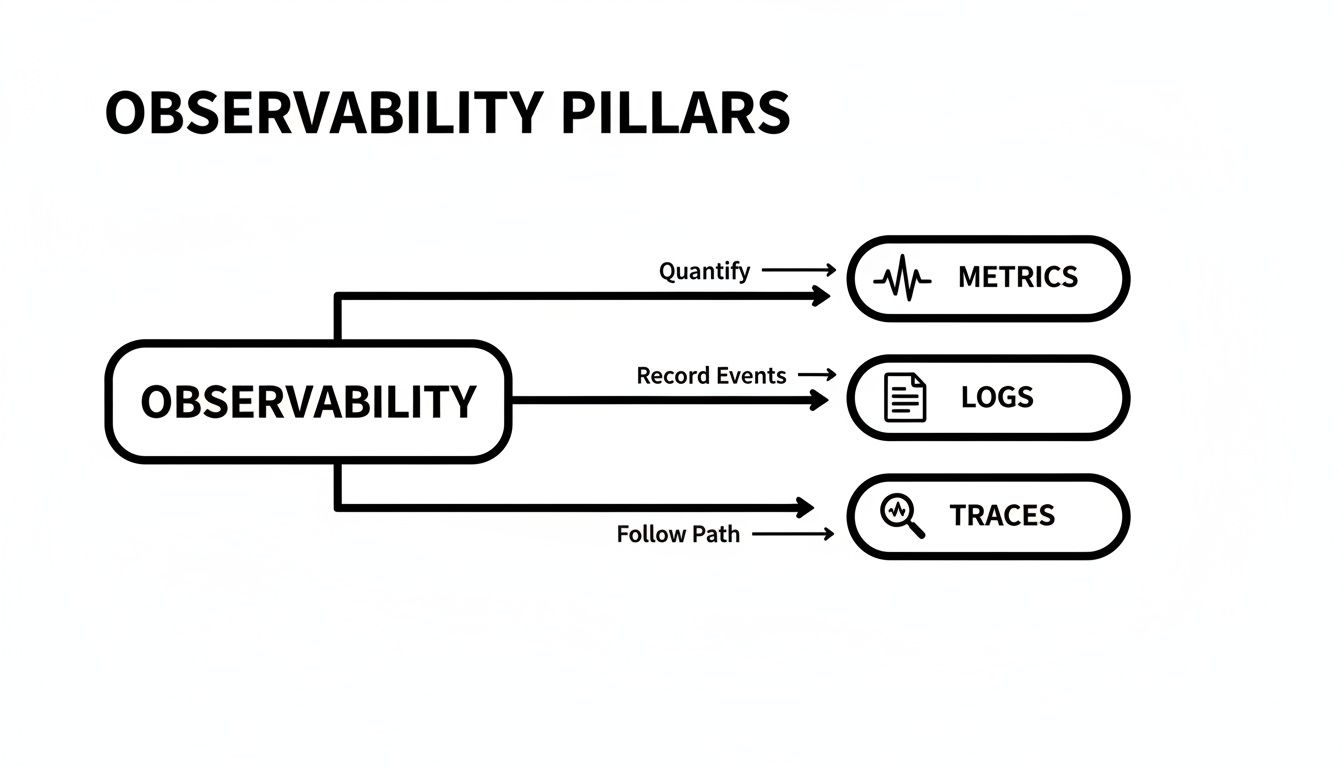
The Trio of Automated Scanning
Comprehensive coverage requires a layered approach to automated scanning. Three categories of tools are essential for a modern pipeline: SAST, DAST, and SCA.
- Static Application Security Testing (SAST): SAST tools function as automated code reviewers. They analyze source code, bytecode, or compiled binaries without executing the application, identifying vulnerabilities like SQL injection, buffer overflows, and insecure cryptographic usage.
- Dynamic Application Security Testing (DAST): DAST tools test a running application from the outside-in. They simulate attacks by sending malicious payloads to the application's endpoints in a staging environment to find runtime vulnerabilities like Cross-Site Scripting (XSS), insecure redirects, and server misconfigurations.
- Software Composition Analysis (SCA): Modern applications are assembled from hundreds of open-source dependencies. SCA tools scan these third-party libraries, identifying known vulnerabilities (CVEs) and ensuring license compliance.
Integrate these tools to provide feedback directly within pull requests. This creates the tightest possible feedback loop. A developer must know if their change introduced a critical vulnerability before the code is merged, not weeks later during a manual audit.
The following table breaks down how these scanning types fit into a typical workflow.
Security Scanning Tools for Your CI/CD Pipeline
| Tool Type | Primary Use Case | When to Run | Example Tools |
|---|---|---|---|
| SAST | Finds vulnerabilities in your source code before it's ever compiled. | On every commit or pull request, directly in the IDE. | SonarQube, Snyk Code, Checkmarx |
| DAST | Scans a running application for exploitable, runtime vulnerabilities. | In a staging environment after a successful deployment, before production. | OWASP ZAP, Burp Suite, Invicti (Netsparker) |
| IAST | Analyzes application behavior from the inside while running. | During automated functional or integration testing in a staging environment. | Contrast Security, Synopsys Seeker |
Each tool provides a different perspective on your application's security posture. Used in combination, they offer a far more complete risk profile than any single tool can alone.
Practical Pipeline Integration Examples
Let's move from theory to implementation. Here are two concrete examples of how to integrate security scanners into a CI pipeline and configure them to fail the build if severe issues are detected.
GitHub Actions with Snyk for SCA
This YAML snippet demonstrates integrating a Snyk SCA scan into a GitHub Actions workflow. It scans for vulnerabilities in open-source dependencies and is configured to fail the build if high-severity vulnerabilities are found.
name: Snyk SCA Scan

on:
  push:
    branches: [ "main" ]
  pull_request:
    branches: [ "main" ]

jobs:
  snyk:
    runs-on: ubuntu-latest
    steps:
      - uses: actions/checkout@v3
      - name: Run Snyk to check for vulnerabilities
        uses: snyk/actions/node@master
        env:
          SNYK_TOKEN: ${{ secrets.SNYK_TOKEN }}
        with:
          command: monitor
          args: --severity-threshold=high
The key argument is --severity-threshold=high. This instructs the Snyk action to pass the build unless a high-severity (or critical) vulnerability is discovered. If one is found, the job fails, blocking the pull request from being merged. This is a simple but powerful enforcement of security coding practices.
GitLab CI with SonarQube for SAST
For teams using GitLab, integrating SonarQube for static analysis is a common practice. The SonarQube scanner CLI can be executed directly within a .gitlab-ci.yml file. This configuration triggers a scan on every commit to a merge request.
sonarqube-sast-scan:
  stage: test
  image:
    name: sonarsource/sonar-scanner-cli:latest
    entrypoint: [""]
  variables:
    SONAR_USER_HOME: "${CI_PROJECT_DIR}/.sonar"
    GIT_DEPTH: 0 # Fetches full Git history for accurate analysis
  cache:
    key: "${CI_JOB_NAME}"
    paths:
      - .sonar/cache
  script:
    - sonar-scanner -Dsonar.qualitygate.wait=true
  allow_failure: false
  only:
    - merge_requests
The critical parameter here is -Dsonar.qualitygate.wait=true. This command forces the GitLab runner to pause and wait for the SonarQube analysis to complete. If the submitted code fails the project's defined Quality Gate (e.g., by introducing a new CRITICAL vulnerability), the pipeline job fails, blocking the merge request. This type of automated enforcement transforms a CI pipeline into an active defender of code quality.
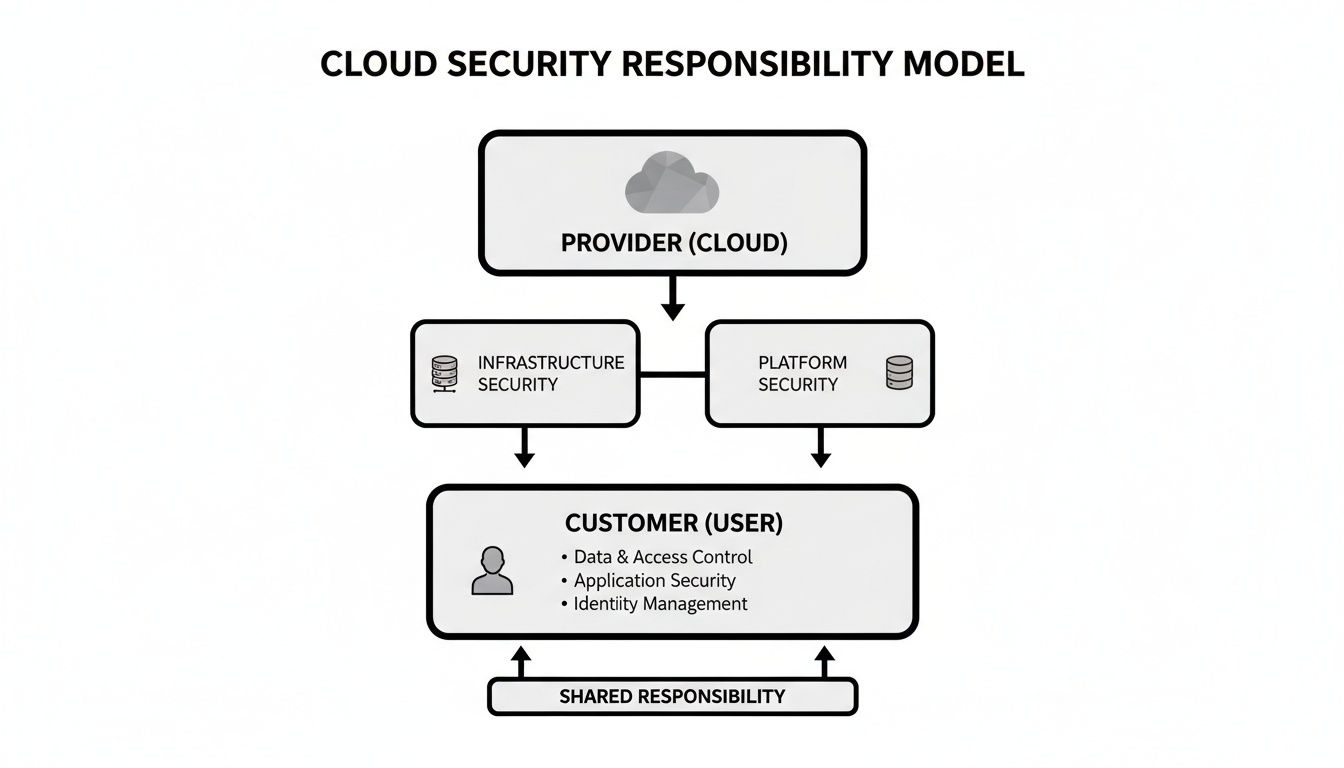
Securing Your Application Dependencies and Secrets
Modern applications are not monolithic; they are ecosystems assembled from open-source packages, frameworks, and libraries. This accelerates development but also means we inherit the security posture of every dependency.
Vulnerabilities in third-party code and hardcoded secrets are two of the most prevalent attack vectors. Mitigating these threats requires two disciplines: continuous, automated dependency monitoring and a centralized secrets management strategy.
Taming Your Dependencies with SCA and SBOMs
The first principle of software supply chain security is visibility. You cannot secure what you do not know you are using. This is where Software Composition Analysis (SCA) tools are indispensable.
SCA tools like Snyk, GitHub's Dependabot, or Trivy act as automated watchdogs. They scan dependency manifests (e.g., package.json, requirements.txt), compare them against vulnerability databases (like the NVD), and report risks. Their real power is realized through CI/CD integration.
A robust workflow includes:
- Automated Scanning: Configure the pipeline to trigger an SCA scan on every pull request. This provides developers with immediate feedback if a newly added package contains a known vulnerability.
- Policy Enforcement: Implement rules to automatically fail the build if a vulnerability exceeds a defined severity threshold (e.g.,
criticalorhigh). This acts as a gatekeeper, preventing vulnerable code from being merged. - Automatic Patching: Leverage tools like Dependabot to automatically generate pull requests that update vulnerable packages to a patched version. This reduces manual toil and minimizes the window of exposure.
Furthermore, generating a Software Bill of Materials (SBOM) is becoming a standard practice. An SBOM is a formal, machine-readable inventory of all software components and dependencies, providing critical visibility for security audits and incident response.
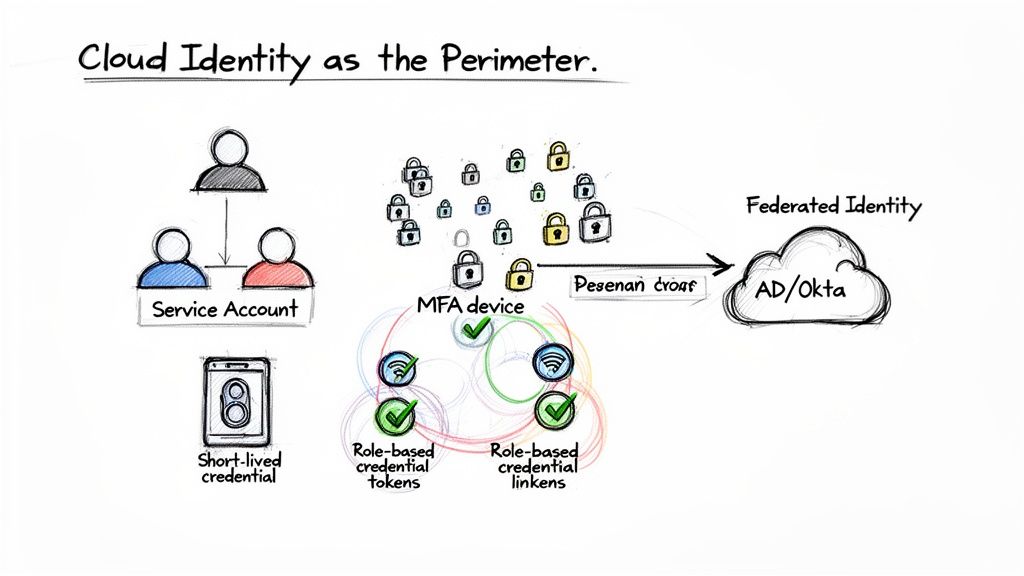
Moving Beyond Insecure Secrets Management
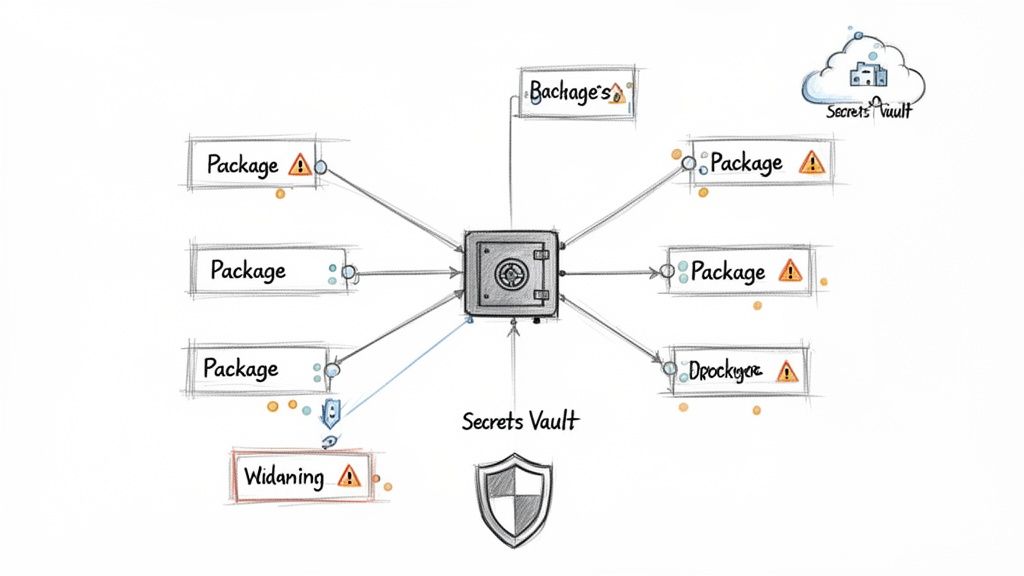
Hardcoding credentials—API keys, database passwords, TLS certificates—directly in source code or configuration files is a critical and common security flaw. Storing them as environment variables on a build server is also risky, as they can leak into logs or be exposed through a compromised build agent.
The correct approach is a dedicated secrets management system. Tools like HashiCorp Vault or cloud-native solutions like AWS Secrets Manager and Azure Key Vault provide a centralized, encrypted, and auditable repository for storing and managing access to secrets.
The core principle is that applications should fetch secrets dynamically at runtime, just-in-time for their use. Secrets should never reside within the codebase or CI/CD environment.
This model requires a shift in application design. Instead of reading credentials from a local file, the application authenticates to the secrets vault using a trusted identity (e.g., an AWS IAM role, a Kubernetes service account) and requests the specific secret it needs. This decouples the application from its secrets, enhancing security and simplifying credential rotation. For a detailed technical breakdown, see our guide to secrets management best practices.
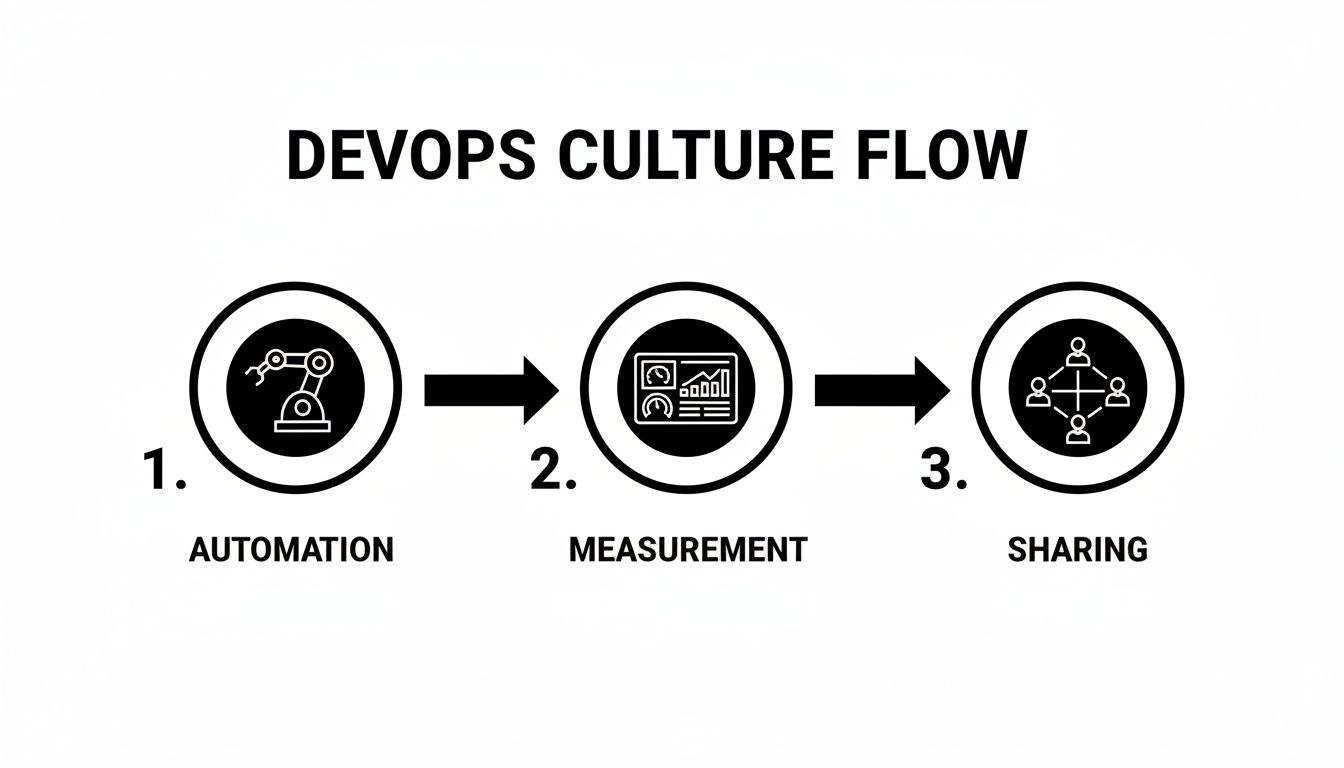
Making Security a Team Sport Through Culture and Improvement
Automated tools and hardened pipelines are necessary but not sufficient. A transformative DevSecOps program is built on people and culture. Fostering a culture where security is a shared engineering responsibility—not the sole domain of a separate team—is what distinguishes truly resilient organizations.
This begins by empowering developers as the first line of defense. The model shifts from "security gatekeeper" to "security enabler," providing engineers with the training, tools, and psychological safety needed to build secure code from the outset. When security is integrated into engineering excellence, it ceases to be a source of friction and becomes a point of collective pride.
From Boring Compliance Training to Real-World Skills
Annual, compliance-driven security training is ineffective. To build durable skills, training must be hands-on, contextual, and directly applicable to a developer's daily work.
Replace generic slideshows with interactive workshops and capture-the-flag (CTF) events. These sessions allow engineers to actively exploit vulnerabilities and learn defensive coding techniques within their own technology stack. This approach builds the muscle memory required for secure coding.
The most effective training provides developers with secure, reusable patterns and libraries. The goal is to make the secure implementation the easiest and most obvious choice.
This is now a regulatory expectation. Frameworks like PCI-DSS 4.0 mandate annual proof of developer competency in secure coding, requiring evidence of continuous security education and skill development. You can find more details on these evolving secure coding standards on securityjourney.com.
Weaving Security Into Every Code Review
Secure code reviews are a critical control, but they cannot be the sole responsibility of a single security champion. To be effective and scalable, security must be an explicit consideration in every pull request, with ownership distributed across the entire team.
Integrate this practical checklist into your pull request templates to guide reviewers:
- Input Validation: Is all external data (user input, API responses, file content) validated against a strict allowlist before being processed?
- Output Encoding: Is data correctly encoded for its output context (e.g., HTML entity encoding for web pages, parameterized queries for SQL) to prevent injection attacks?
- Authentication & Authorization: Are permission checks explicit and performed on the server-side for every sensitive operation? Is there a risk of insecure direct object references (IDORs)?
- Secrets Management: Are there any hardcoded secrets (passwords, API keys, tokens)? Secrets must be retrieved from a dedicated secrets management system at runtime.
- Dependency Check: Does this change introduce or update any third-party dependencies? Have they been scanned for known vulnerabilities (CVEs) by an SCA tool?
- Secure Error Handling: Do error messages fail securely? They must not leak sensitive information like stack traces, internal file paths, or database query details.
Measuring What Matters to Get Better
A mature security culture is data-driven. Continuous improvement requires tracking metrics that reflect the actual health of the security program, not just vanity metrics like the number of alerts generated.
Focus on these key performance indicators (KPIs) to drive meaningful improvements:
- Mean Time to Remediate (MTTR): What is the average time between the detection of a vulnerability and its remediation? A low MTTR indicates an efficient and responsive security process.
- Vulnerability Density: How many confirmed vulnerabilities are found per 1,000 lines of code (KLOC)? Tracking this trend over time indicates the effectiveness of preventative controls.
- Escape Rate: What percentage of vulnerabilities are discovered in production versus pre-production environments? A low escape rate signifies that "shift left" security controls are effective.
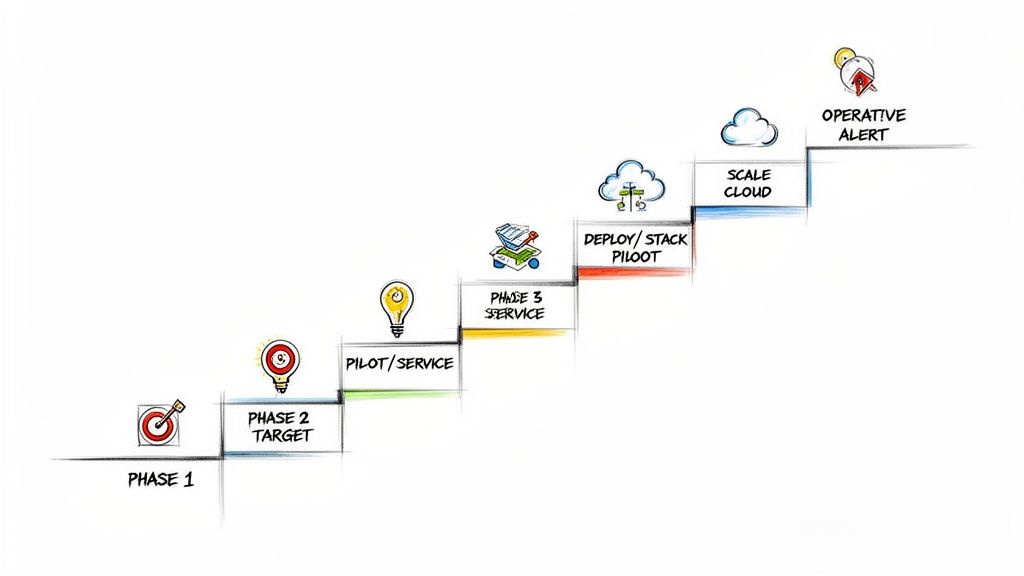
Tracking these metrics enables teams to identify bottlenecks, validate the impact of security initiatives, and make data-informed decisions about where to invest resources. This feedback loop is essential for advancing through the DevOps maturity levels.
Frequently Asked Questions
Integrating security into high-velocity development workflows raises common and valid questions from engineers and leadership. Here are direct, technical answers to the most frequent challenges.
How Can We Introduce Security Without Slowing Down Our Developers?
Security must be integrated seamlessly into existing developer workflows, not implemented as an external, blocking gate. The key is automation and context-aware feedback.
Integrate fast, automated tools like SAST and SCA scanners directly into the CI pipeline to provide feedback on every pull request. This feedback must be delivered within the developer's primary interface (e.g., GitHub, GitLab), eliminating the need for context switching to a separate security tool.
Begin with a minimal, high-confidence ruleset to avoid alert fatigue. Focus on critical, non-negotiable issues first (e.g., SQL injection, remote code execution) and expand coverage as the team matures.
The most successful security programs make the secure path the easiest path. Provide developers with pre-vetted, secure libraries and internal frameworks that handle complex security tasks like authentication and data sanitization by default.
Catching vulnerabilities in the PR stage is far more efficient than finding them weeks later in a separate audit. This proactive approach prevents costly rework and actually increases long-term velocity.
What Is the Single Most Impactful Secure Coding Practice to Start With?
Implement and enforce strict input validation and output encoding. A significant percentage of common, high-impact vulnerabilities, including Cross-Site Scripting (XSS) and all injection flaws (SQL, command, LDAP), stem from the failure to properly handle untrusted data.
To operationalize this:
- Standardize a Library: Mandate the use of a single, vetted library or set of internal functions for data validation and encoding.
- Make it the Default: Train developers that this is the required pattern for handling any data originating from outside the application's trust boundary.
- Enforce it in Reviews: Make this a mandatory line item on every code review checklist: "Verify that all external data is validated on input and encoded on output."
By standardizing this practice, you create a foundational defense that systematically eliminates entire classes of vulnerabilities.
How Do We Get Developers to Actually Care About Security?
Ownership is built, not mandated. Reframe security from a separate, specialized discipline into an integral aspect of software quality, on par with performance, reliability, and maintainability.
Replace passive, compliance-focused training with hands-on workshops where developers can actively find, exploit, and fix vulnerabilities in a safe environment. Publicly recognize and reward developers who proactively identify and remediate security issues.
Implement a "security champions" program. Identify developers within each team who have a natural interest in security and formally empower them. Provide them with advanced training, resources, and a direct line to the security team. Peer-to-peer influence and mentorship are far more effective at driving cultural change than top-down directives.
SAST Tools Produce Too Many False Positives. How Do We Manage the Noise?
This is a common failure mode. The solution is aggressive and continuous tuning. A SAST tool deployed with its default configuration will quickly lead to alert fatigue, causing developers to ignore its output.
Start by disabling most rules. Your initial, active ruleset should be small and focused exclusively on high-confidence, high-impact vulnerability classes, such as SQL injection, command injection, and deserialization vulnerabilities. Focus on achieving a near-zero false positive rate for this core set to build developer trust in the tool.
Gradually enable additional rules as the team becomes proficient at triaging the findings. Use the tool's baselining capabilities to ignore pre-existing "technical debt" and focus analysis only on vulnerabilities introduced in new or modified code. The goal is not to find every theoretical issue but to find and fix the most critical ones without overwhelming the development team.
Ready to build a mature, high-velocity DevOps culture? OpsMoon connects you with the top 0.7% of remote DevOps engineers to accelerate your projects. From CI/CD pipelines to infrastructure automation, we provide the expertise you need to ship secure, reliable software faster. Start with a free work planning session and build your roadmap to success.