When you hear "SOC 2 compliance," think technical evidence, not just policies. The American Institute of Certified Public Accountants (AICPA) framework is a rigorous examination of your ability to securely manage customer data in a production environment. Auditors don't just read your documents; they test your controls.
The framework is built around five key principles, known as the Trust Services Criteria (TSC). Think of them as the modules of your audit. Of these, Security is the only mandatory one for every single audit. Getting a clean SOC 2 report demonstrates that your security posture is not just a theoretical concept—it's implemented, operational, and verifiable.
Unlocking Trust with SOC 2 Compliance
Here’s the thing about SOC 2: it’s not a simple checklist you can just tick off. It's an attestation, not a certification. An auditor provides an opinion on the design and operational effectiveness of your controls.
A better way to think about it is like a code review for your entire security program. A linter can check for syntax errors (like a policy document), but a senior engineer's review checks the logic and implementation (the actual audit). SOC 2 is that practical, in-depth review; it's an attestation that proves your organization's controls can handle the technical complexities of modern data management. The goal is to give your clients and partners cryptographic-level confidence that their sensitive information is secure within your environment.
This confidence is your ticket to closing enterprise deals. When the average data breach in the U.S. costs a whopping $9.36 million, you can bet that large companies aren't taking any chances. They won't partner with a vendor who can't prove their security is up to snuff. Your SOC 2 report is that proof, and it often becomes a deal-breaker in the sales process.
The Foundation of Trust Services Criteria
The entire SOC 2 framework rests on those five core principles I mentioned, the Trust Services Criteria (TSC). We’ll dive deeper into each one later, but for now, let’s get a quick overview:
- Security: The non-negotiable foundation. It’s all about protecting systems from unauthorized access, use, or modification through technical controls like firewalls, intrusion detection, and access management.
- Availability: This focuses on ensuring your systems meet their operational uptime and performance objectives as defined in your service level agreements (SLAs).
- Processing Integrity: This ensures system processing is complete, valid, accurate, timely, and authorized. Think transaction integrity and data validation.
- Confidentiality: This is for protecting information that has been specifically designated as "confidential" from unauthorized disclosure, often through encryption and strict access controls.
- Privacy: This criterion deals with the collection, use, retention, disclosure, and disposal of personal information in conformity with an organization's privacy notice.
While Security is the only one you have to include, you'll choose the other four based on your service commitments and customer requirements. Weaving these principles into your daily operations is a huge part of good DevOps security best practices.
SOC 2 isn't a one-and-done project; it’s a continuous commitment. It shows you've built solid information security policies and, more importantly, that you follow them consistently. An independent, third-party auditor comes in to verify it all.
It's also worth noting how SOC 2 differs from other frameworks. If you're exploring your options, understanding ISO 27001 certification can provide a useful contrast. ISO 27001 is much more prescriptive, handing you a specific set of controls. SOC 2, on the other hand, gives you more flexibility to design controls that are appropriate for your specific business and technology stack.
Decoding the Five Trust Services Criteria
The heart of any SOC 2 audit is the Trust Services Criteria (TSC). Think of them as the five core principles that define what it really means to securely manage customer data.
These aren't rigid, black-and-white rules. Instead, they’re flexible objectives. The TSCs tell you what you need to protect, but give you the freedom to decide how you'll do it based on your specific tech stack and business model. This adaptability is what makes the SOC 2 framework so practical for modern cloud environments.
The American Institute of Certified Public Accountants (AICPA) defines these five criteria: Security, Availability, Processing Integrity, Confidentiality, and Privacy. Of these, Security is the only mandatory criterion for every single SOC 2 audit. It's the bedrock, making it the primary focus for any company serious about proving its data security chops. If you're just starting your journey, getting familiar with the full scope of SOC 2 requirements is a great first step.
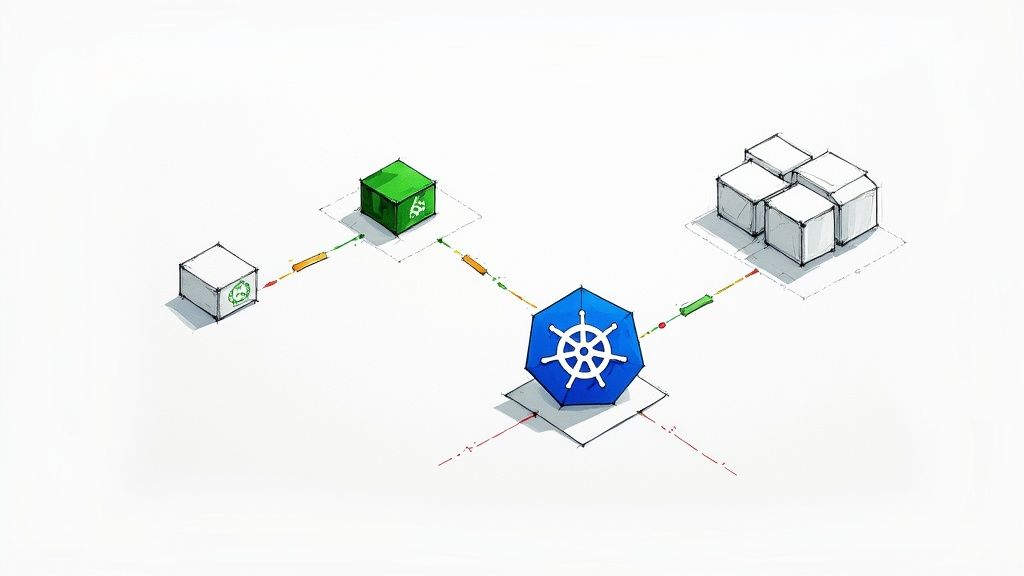
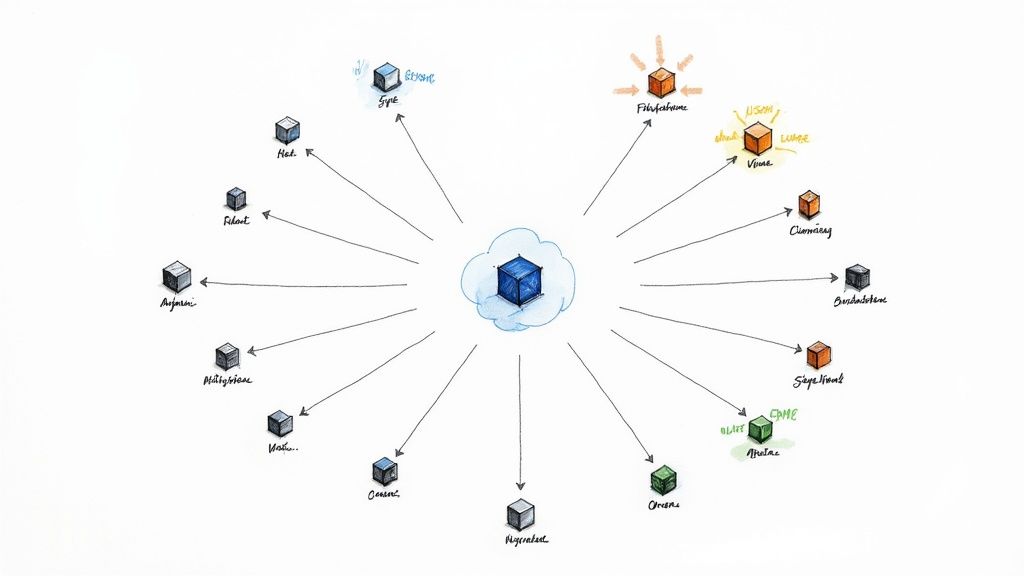
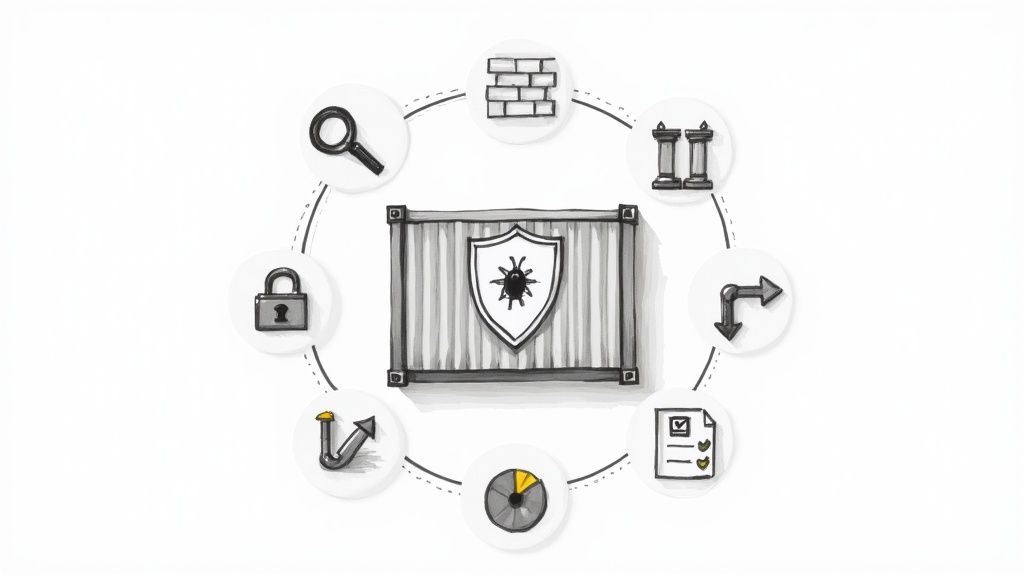
The infographic below really clarifies how everything fits together—from the AICPA down to the five criteria that auditors use to evaluate your systems.
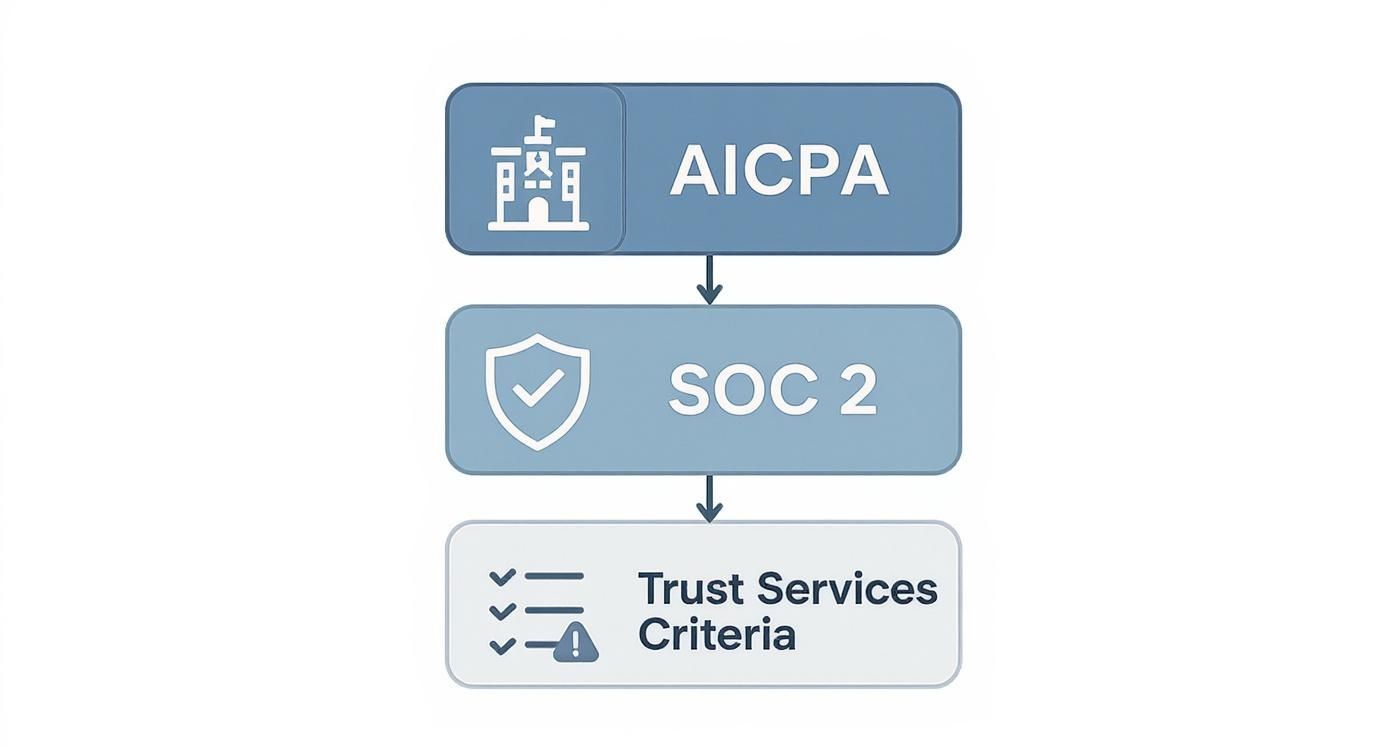
As you can see, the Trust Services Criteria are the pillars an auditor leans on to test your controls, all under the authority of the AICPA's SOC 2 standard.
Let's break down what each of these criteria actually means in practice.
The following table provides a quick-glance summary of each TSC, what it aims to achieve, and how it applies to real-world business scenarios.
Overview of the SOC 2 Trust Services Criteria
| Trust Service Criterion | Core Objective | Example Controls | Primary Use Case |
|---|---|---|---|
| Security (Mandatory) | Protect systems and data against unauthorized access and use. | Firewalls, intrusion detection systems, multi-factor authentication (MFA), vulnerability management. | Essential for any SaaS provider, cloud host, or service organization handling customer data. |
| Availability | Ensure the system is operational and accessible as promised in SLAs. | System redundancy, load balancing, disaster recovery plans, performance monitoring. | Critical for services where uptime is non-negotiable, like cloud platforms (AWS, Azure) and communication tools (Zoom, Slack). |
| Processing Integrity | Ensure system processing is complete, accurate, timely, and authorized. | Input/output validation checks, quality assurance (QA) testing, transaction logging and reconciliation. | Vital for financial processing platforms (Stripe), e-commerce sites, and data analytics tools where accuracy is paramount. |
| Confidentiality | Protect sensitive information that has restricted access and disclosure. | Data encryption (in transit and at rest), access control lists (ACLs), non-disclosure agreements (NDAs). | Necessary for companies handling proprietary data, intellectual property, or sensitive business intelligence. |
| Privacy | Secure the collection, use, and disposal of Personally Identifiable Information (PII). | Consent management systems, data anonymization techniques, secure data deletion processes. | Crucial for any business handling personal data, especially in healthcare (HIPAA), finance, and consumer tech. |
Each criterion addresses a unique aspect of data stewardship, but they all work together to build a comprehensive security posture.
The Mandatory Security Criterion
The Security criterion, often called the Common Criteria, is the non-negotiable foundation of every SOC 2 report. It’s all about protecting your systems from anyone who shouldn’t have access. This is where an auditor will spend most of their time, digging into your technical and operational controls.
For instance, they'll want to see evidence of controls like:
- Network Firewalls and Intrusion Detection Systems (IDS): Are you effectively segmenting your network and actively looking for malicious activity? An auditor will want to see your firewall rules (e.g., AWS Security Group configurations) and review logs from your IDS (e.g., Suricata, Snort).
- Access Control Mechanisms: How do you enforce the principle of least privilege? They'll expect to see evidence of Role-Based Access Control (RBAC) implementation (e.g., IAM roles in AWS) and mandatory multi-factor authentication (MFA) on all critical systems.
- Vulnerability Management: Do you have a formal process for scanning, triaging, and remediating vulnerabilities? You’ll need to show scan reports from tools like Nessus or Qualys and the corresponding Jira tickets that prove you remediated the findings within your defined SLAs.
The Security criterion is the baseline for everything else. You can't logically have Availability or Confidentiality if your fundamental systems aren't secure from unauthorized access in the first place.
Availability Uptime and Resilience
The Availability criterion is all about making sure your system is up and running as promised in your Service Level Agreements (SLAs). This isn't just about preventing downtime; it's about proving you have a resilient architecture.
Auditors will be scrutinizing controls such as:
- System Redundancy: This means having failover mechanisms, like running your service across multiple availability zones in the cloud or using load-balanced server clusters. An auditor might ask for your infrastructure-as-code (e.g., Terraform) to verify this.
- Disaster Recovery (DR) Plans: You need a documented, tested plan to restore service if a catastrophic failure occurs. Auditors won't just take your word for it—they'll ask for your DR test results, including recovery time objectives (RTO) and recovery point objectives (RPO).
- Performance Monitoring: Are you using tools like Datadog or Prometheus to monitor system health and capacity? They'll want to see that you have automated alerts for issues that could lead to an outage, such as CPU utilization thresholds or latency spikes.
Processing Integrity Accuracy and Completeness
Processing Integrity ensures that when your system performs a function—like a calculation or a transaction—it does so completely, accurately, and in a timely manner. This is a must-have for services that handle critical computations, like financial platforms or data analytics tools.
An auditor is going to verify controls like:
- Input and Output Validation: Are you implementing server-side checks to ensure data conforms to expected formats and values before it enters and leaves your system?
- Quality Assurance (QA) Procedures: You need a robust QA process, including unit and integration tests within your CI/CD pipeline, to prevent bugs that could compromise data integrity.
- Transaction Logging: Maintaining immutable, detailed logs of every transaction is key, so you can perform reconciliation and audit them later for accuracy and completeness.
Confidentiality Protecting Sensitive Data
The Confidentiality criterion is for data that's meant for a specific set of eyes only. Think of it as enforcing your "need to know" policies for things like intellectual property, secret business plans, or sensitive financial records.
Here, auditors will look for proof of:
- Data Encryption: Is your data encrypted both in transit (using protocols like TLS 1.2 or higher) and at rest (using AES-256 on your databases and object storage)? They will want to see configuration files to prove this.
- Access Control Lists (ACLs): Are you using granular permissions on files, databases, and object stores so only authorized roles can access them?
- Non-Disclosure Agreements (NDAs): Do you require employees and contractors to sign NDAs before they can access sensitive company or customer data? Auditors will sample employee files to verify this.
Privacy Handling Personal Information
Finally, the Privacy criterion deals with how you collect, use, retain, and dispose of Personally Identifiable Information (PII). This is different from Confidentiality because it applies specifically to personal data and is guided by the commitments in your organization's privacy notice.
Key controls auditors will check for include:
- Consent Management: Do you have systems in place to obtain and track user consent for collecting and processing their data, in line with regulations like GDPR or CCPA?
- Data Anonymization and De-identification: Are you using techniques like hashing or tokenization to strip PII from datasets you use for testing or analytics?
- Secure Data Deletion: You need to show that you have a documented and verifiable process to permanently delete user data upon request, ensuring it's unrecoverable.
Implementing Key Technical and Operational Controls
Knowing the Trust Services Criteria is one thing. Actually translating them into the real-world technical and operational controls that make up your infrastructure? That's where the real work of SOC 2 compliance begins. This is the hands-on playbook for the engineers and security pros tasked with building a system that can pass an audit.
We're going to walk through four critical domains: Risk Management, Access Controls, Change Management, and Systems Monitoring. For each one, I’ll give you specific, technical examples of what auditors will dig into.
This isn’t about just buying a bunch of security tools. It's about weaving solid security practices into the very fabric of your daily operations. The goal is to build a system where controls aren't a painful afterthought, but a fundamental part of how you build, deploy, and manage everything.
Foundational Risk Management Controls
Before you can implement technical safeguards, you must identify what you’re protecting against. This is the purpose of risk management in SOC 2. Auditors need to see a formal, documented process for how you identify, assess, and mitigate risks to your systems and data.
A great starting point is a risk register. This is a centralized ledger, often a spreadsheet or a GRC tool, that tracks potential threats. For every identified risk, you must evaluate its likelihood and potential impact, then document a mitigation strategy.
An auditor is going to want to see proof of:
- A Formal Risk Assessment Process: This means a documented policy outlining your methodology (e.g., NIST 800-30), how often you conduct these assessments (at least annually), and who is responsible.
- An Asset Inventory: You can't protect what you don't know you have. You need an up-to-date inventory of all your critical hardware, software, and data assets, often managed through a CMDB or asset management tool.
- Vendor Risk Management: A clear process for vetting third-party vendors who have access to your systems or data. This often involves security questionnaires and reviewing their own SOC 2 reports.
As you design these controls, it's smart to see how they line up with other established global standards like ISO 27001. They often share similar risk management principles, and this alignment can seriously strengthen your overall security posture and make future compliance efforts a lot easier.
Granular Access Control Implementation
Access control is a massive piece of the Security criterion. The guiding principle is least privilege: users should only have the minimum access required to perform their job functions. An auditor will test this rigorously.
Role-Based Access Control (RBAC) is the standard implementation. Instead of assigning permissions to individuals, you create roles like "Developer," "Support Engineer," or "DatabaseAdministrator," assign permissions to those roles, and then assign users to them.
An auditor won't just glance at a list of users and roles. They'll select a sample, such as a recently hired engineer, and state, "Show me the documented approval for their access levels and provide a system-generated report proving their permissions align strictly with their role definition."
Here are the key technical controls to have in place:
- Multi-Factor Authentication (MFA) Enforcement: MFA cannot be optional. It must be enforced for everyone accessing critical systems—internal dashboards, cloud consoles (AWS, GCP, Azure), and your version control system (e.g., GitHub).
- Access Reviews: You must conduct periodic reviews of user access rights, typically quarterly. An auditor will request the evidence, like signed-off tickets or checklists, showing that managers have verified their team's permissions are still appropriate.
- Privileged Access Management (PAM): For administrative or "root" access, use PAM solutions. These systems require users to "check out" credentials for a limited time and log every command executed. This ensures the most powerful permissions are used rarely and with full accountability.
Properly handling secrets and credentials is a huge part of this. To get a better handle on that, check out our guide on secrets management best practices.
Disciplined Change Management Processes
Uncontrolled changes are a primary source of security incidents and service outages. A robust change management process demonstrates to an auditor that you deploy code and infrastructure changes in a planned, tested, and approved manner. This is absolutely critical in modern DevOps environments with CI/CD pipelines.
Auditors will put your pipeline under a microscope, looking for these control points:
- Segregation of Duties: The developer who writes the code should not be the same person who can deploy it to production. This is often enforced through protected branches in Git, requiring a peer review and approval from a designated code owner before a merge is permitted.
- Automated Testing: Your CI/CD pipeline must have automated security scans (SAST, DAST, dependency scanning) and unit/integration tests built in. A build should fail automatically if tests do not pass or if critical vulnerabilities are discovered.
- Documented Approvals: For every single change deployed to production, there must be a clear audit trail. This is typically a pull request linked to a project management ticket (like in Jira) that shows the peer review, QA sign-off, and final approval.
Comprehensive Systems Monitoring and Logging
Finally, you have to prove you're actively monitoring your environment. Continuous monitoring and logging are how you detect, investigate, and respond to security incidents. An auditor isn't just looking for log collection; they want to see that you're actively analyzing those logs for anomalous activity.
A Security Information and Event Management (SIEM) tool is typically the central hub for this. It ingests logs from all systems—servers, firewalls, applications, cloud services—and uses correlation rules to detect and alert on potential threats.
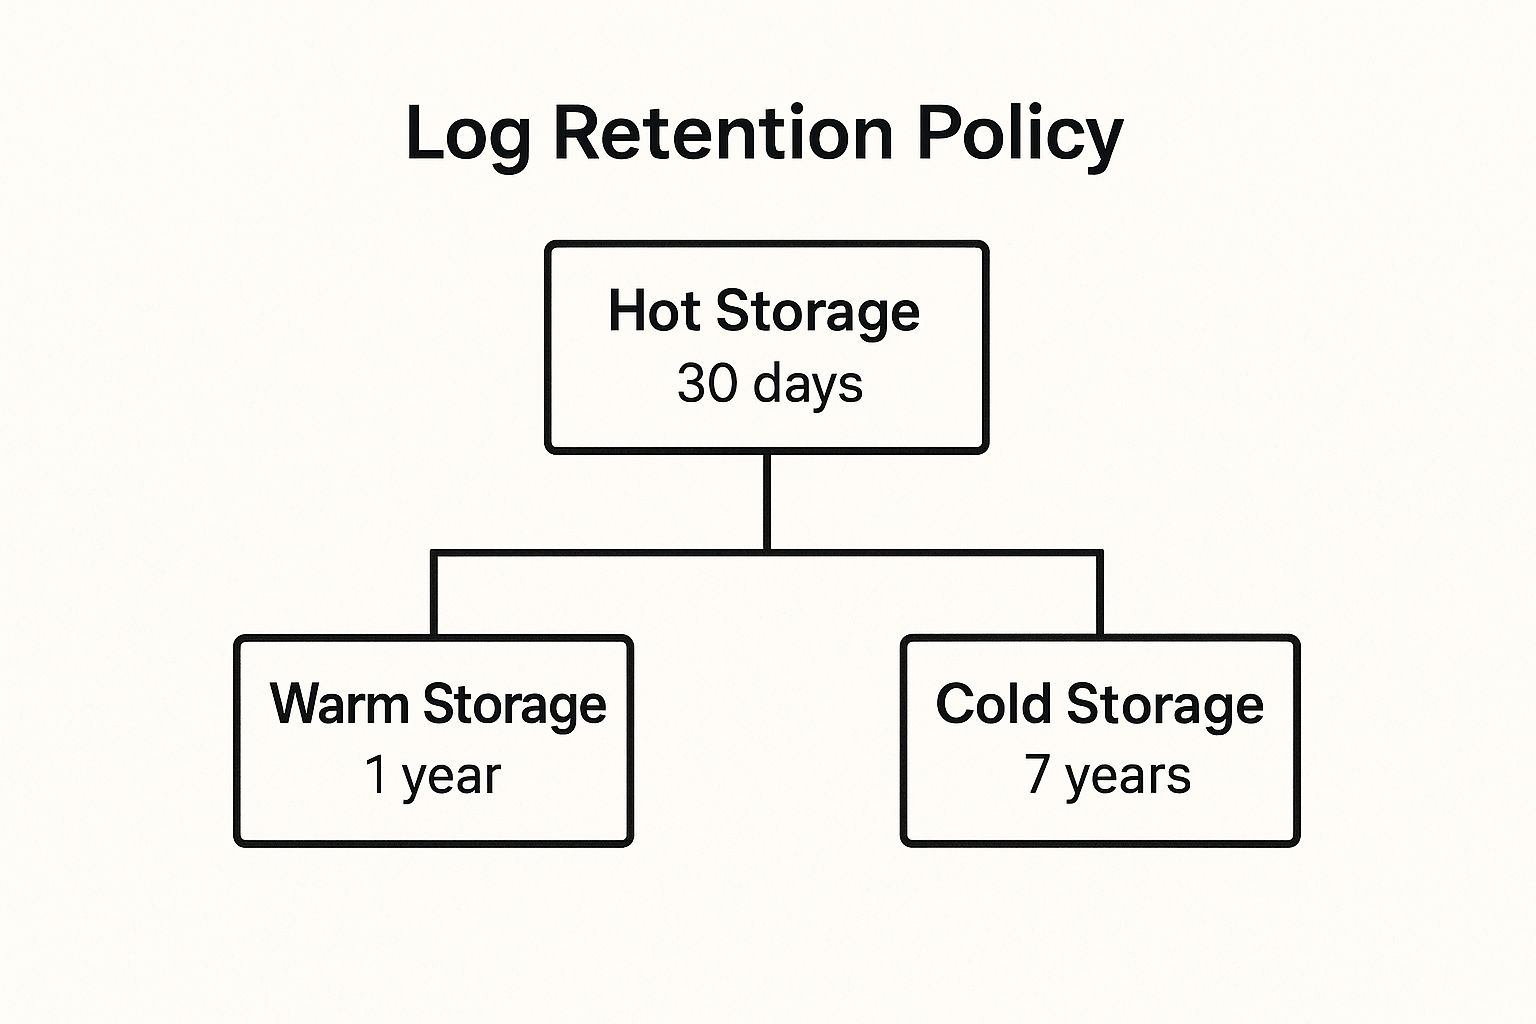
Your essential monitoring controls should include:
- Log Collection: Ensure logging is enabled and centrally collected from all critical infrastructure. This includes OS-level logs, application logs, cloud provider audit logs (like AWS CloudTrail), and network traffic logs.
- Alerting on Anomalies: Configure your SIEM or monitoring tools to generate automated alerts for significant security events. Examples include multiple failed login attempts, unauthorized access attempts on sensitive files, or unusual network traffic patterns.
- Log Retention: You must have a clear policy for log retention periods, ensuring it meets security and regulatory requirements. These logs must be stored immutably so they cannot be tampered with.
Putting all these technical and operational controls in place is a detailed and demanding process, there’s no sugarcoating it. But it’s the only way to build a system that is not only compliant, but genuinely secure and resilient.
Navigating the SOC 2 Audit Process
An audit can feel like a black box—a mysterious process filled with endless evidence requests and a lot of uncertainty. But if you approach it with a clear, step-by-step plan, it transforms from a source of anxiety into a manageable, even predictable, project. This guide breaks down the entire SOC 2 audit lifecycle, giving you a practical roadmap to a successful outcome.
The journey doesn’t start when the auditor shows up. It begins long before that, with careful planning, scoping, and a bit of internal homework. Each phase builds on the last, so by the time the formal audit kicks off, you're not just ready—you're confident.
Phase 1: Scoping and Readiness Assessment
First things first, you have to define the scope of your audit. This means drawing a very clear boundary around the systems, people, processes, and data that support the services you’re getting audited. A poorly defined scope is a recipe for confusion and delays, so getting this right from the start is absolutely critical.
Once you know what’s in scope, the single most valuable thing you can do is a readiness assessment. This is a pre-audit performed by a CPA firm or consultant to review your current controls against the selected Trust Services Criteria. Their job is to identify gaps before your official auditor does.
A readiness assessment is your chance to find and fix problems before they become official audit exceptions. It gives you a punch list of what to remediate, turning unknown weaknesses into a clear action plan.
The data backs this up. Organizations that conduct SOC 2 readiness assessments see, on average, a 30% improvement in audit outcomes. This prep work doesn't just make the audit smoother; it makes you more secure. For example, continuous monitoring—a key part of SOC 2—has been linked to a 50% reduction in the time it takes to spot and shut down security incidents. You can check out more insights about SOC 2 readiness on Bitsight.com.
Phase 2: Choosing a Report Type and Audit Firm
With your readiness assessment complete and a remediation plan in hand, you have two big decisions to make. The first is whether to pursue a Type 1 or a Type 2 report.
- Type 1 Report: This is a "point-in-time" assessment of the design of your controls. The auditor verifies that on a specific day, your controls are designed appropriately to meet the criteria.
- Type 2 Report: This is the gold standard. It’s a much deeper audit that tests the operational effectiveness of your controls over a period of time, typically 6 to 12 months.
Let's be clear: most of your customers and partners will demand a Type 2 report. It provides real assurance that you're not just talking the talk, but consistently operating your controls effectively over time.
Next, you need to select a reputable CPA firm to conduct the audit. Don't just go with the cheapest option. Look for a firm with deep experience auditing companies in your industry and with a similar tech stack. Ask for references, and ensure their auditors hold relevant technical certifications (e.g., CISA, CISSP) so they genuinely understand modern cloud environments.
Phase 3: Technical Evidence Collection
This is the most intensive phase, where your team will work with the auditors to provide evidence for every single control in scope. The auditors won’t take your word for it—they need to see concrete proof. They'll provide a "Provided by Client" (PBC) list, which is a detailed request list of all required evidence.
The evidence they ask for is highly technical and specific. Here's a sample of what you can expect to provide:
- Configuration Files: They'll want to see exports of your cloud configurations (e.g., AWS Security Group rules, IAM policies), firewall rule sets, and server hardening scripts to verify secure configurations.
- System Logs: Auditors will request samples from your SIEM, application logs showing user activity, and cloud provider audit trails like AWS CloudTrail to confirm monitoring and incident response capabilities.
- Policy Documents: You will provide all information security policies, such as your access control policy, incident response plan, and disaster recovery plan. The auditor will compare these policies against your actual practices.
- Change Management Tickets: For a sample of production changes, you'll need to produce the corresponding ticket from a tool like Jira. This ticket must show evidence of peer review, passing tests, and formal approval before deployment.
- Employee Records: This includes evidence of background checks for new hires, acknowledgments of security awareness training completion, and records demonstrating that access was promptly terminated for former employees.
The key to surviving this phase is organization. Trying to pull this evidence together manually is a nightmare. A compliance automation platform that centralizes evidence collection can drastically reduce the effort and streamline the entire audit process.
Maintaining Continuous SOC 2 Compliance
Getting that first SOC 2 report isn't crossing the finish line. Far from it. Think of it as the starting pistol for your ongoing commitment to security. Your audit report is a snapshot in time, and its value diminishes daily. To maintain the trust you’ve earned and meet SOC 2 compliance requirements long-term, you must shift from a project-based mindset to a continuous program.
This means embedding security and compliance into the fabric of your daily operations. It’s about transforming the annual audit scramble into a sustainable, always-on security posture. The goal? Make compliance a natural byproduct of how you engineer and operate your systems, not a stressful afterthought.
This proactive approach doesn't just prepare you for your next audit. It genuinely strengthens your defenses against real-world threats, making your entire organization more resilient.
Establishing a Continuous Monitoring Program
The engine of sustained compliance is continuous monitoring. This is the technical practice of using automated tools to check the status of your security controls in near real-time. Instead of a frantic, manual evidence hunt every twelve months, you automate the process so that proof of compliance is constantly being collected. If you want to go deeper, check out our article on what is continuous monitoring.
Think of it like the dashboard in your car. It doesn't just flash your speed once; it constantly displays it, along with fuel levels and engine status, warning you the moment a parameter is out of spec. A solid continuous monitoring program does exactly that for your security controls.
The key technical pieces of this program usually include:
- Automated Evidence Collection: Configure scripts and tools to automatically poll and log control states. For example, a daily script can check your cloud environment to ensure all S3 buckets are private and all databases have encryption enabled, logging the results as audit evidence.
- Real-Time Alerting: Integrate your monitoring tools with alerting systems. If a developer accidentally disables MFA on a critical system, you need an immediate PagerDuty or Slack notification—not a finding during your next audit.
- Compliance Dashboards: Use dashboards to visualize the health of your controls against your compliance framework. This gives everyone, from engineers to executives, a clear, up-to-the-minute view of your compliance posture.
Continuous monitoring transforms compliance from a reactive, evidence-gathering exercise into a proactive, control-validating discipline. It ensures you are always audit-ready.
Conducting Annual Risk Assessments and Internal Audits
The threat landscape is dynamic, and so must be your risk assessments. Your risks and controls need regular re-evaluation. A core component of maintaining SOC 2 compliance is conducting a formal risk assessment at least annually. This isn't just a paperwork exercise; it's a technical deep-dive into new threats, vulnerabilities, and any changes to your production environment.
Furthermore, conducting periodic internal audits helps you verify that your controls are operating effectively. You can simulate a "mini-audit" by having an internal team (or an outside consultant) test a sample of your key controls. This process is invaluable for catching control drift or failures before your external auditor finds them.
The market data backs this up—the days of "one and done" audits are over. A striking 92% of organizations now conduct two or more SOC audits annually, with 58% performing four or more. This trend shows a clear shift toward continuous validation, where compliance is an ongoing security commitment. This constant scrutiny makes annual risk assessments and internal audits absolutely essential for staying ahead of the game.
Common Questions About SOC 2 Requirements
Jumping into SOC 2 often feels like learning a new language. You've got the concepts down, but the practical questions start piling up. Let's tackle some of the most common ones I hear from teams going through this for the first time.
What Is the Difference Between a SOC 2 Type 1 and Type 2 Report?
Think of a SOC 2 Type 1 report as an architectural review. It’s a snapshot in time that assesses if you’ve designed your security controls correctly. An auditor examines your controls on a specific day and issues an opinion on their suitability of design.
However, a SOC 2 Type 2 report is what sophisticated customers demand. It tests if those controls actually operate effectively over a longer period, usually 6 to 12 months. It's the difference between having a blueprint for a strong wall and having engineering test results proving the wall can withstand hurricane-force winds for a whole season. The Type 2 is the real proof of operational effectiveness.
How Long Does It Take to Become SOC 2 Compliant?
This is the classic "it depends" question, but here are some realistic timelines. If your company already has a mature security program with most controls in place, you might achieve compliance in 3-6 months.
For a typical startup or company building its security program from scratch, a more realistic timeline is 12 months or more. This covers the essential phases: a readiness assessment to identify gaps, several months of remediation work to implement new controls and policies, and then the 6- to 12-month observation period required for the Type 2 audit itself.
Rushing the preparation phase almost always backfires. It leads to a longer, more painful audit with more exceptions when the auditor finds issues you could have remediated earlier.
How Much Does a SOC 2 Audit Cost?
The price tag for a SOC 2 audit can swing wildly, but a typical range is anywhere from $20,000 to over $100,000. The final cost is a function of:
- Audit Scope: Auditing only the Security criterion is cheaper than auditing all five TSCs.
- Company Size & Complexity: Auditing a 50-person startup with a simple tech stack is less work than auditing a 500-person company with multiple product lines and a complex hybrid-cloud environment.
- Technical Environment: A simple, cloud-native stack is easier to audit than a complex hybrid-cloud mess with tons of legacy systems.
- Report Type: A Type 2 audit requires significantly more testing and evidence gathering than a Type 1, and is therefore more expensive.
Don't forget the indirect costs. You’ll likely spend money on readiness assessments, compliance automation software, and potentially new security tools to close any identified gaps.
Does a SOC 2 Report Expire?
Technically, a SOC 2 report doesn't have a formal expiration date. But in practice, its relevance has a short half-life. The report only provides assurance for a specific, historical period.
Most clients and enterprise customers will require a new report annually. They need assurance that your controls are still effective against current threats, not just last year's. The best practice is to treat SOC 2 as an ongoing annual commitment, not a one-time project. It’s a continuous cycle of maintaining and demonstrating trust.
At OpsMoon, we know that building a compliant environment is about more than just checking boxes; it's about engineering robust, secure systems from the ground up. Our remote DevOps and security experts can help you implement the technical controls, automate your evidence collection, and get you ready for a smooth audit. Start with a free work planning session and we'll help you map out your path to SOC 2.