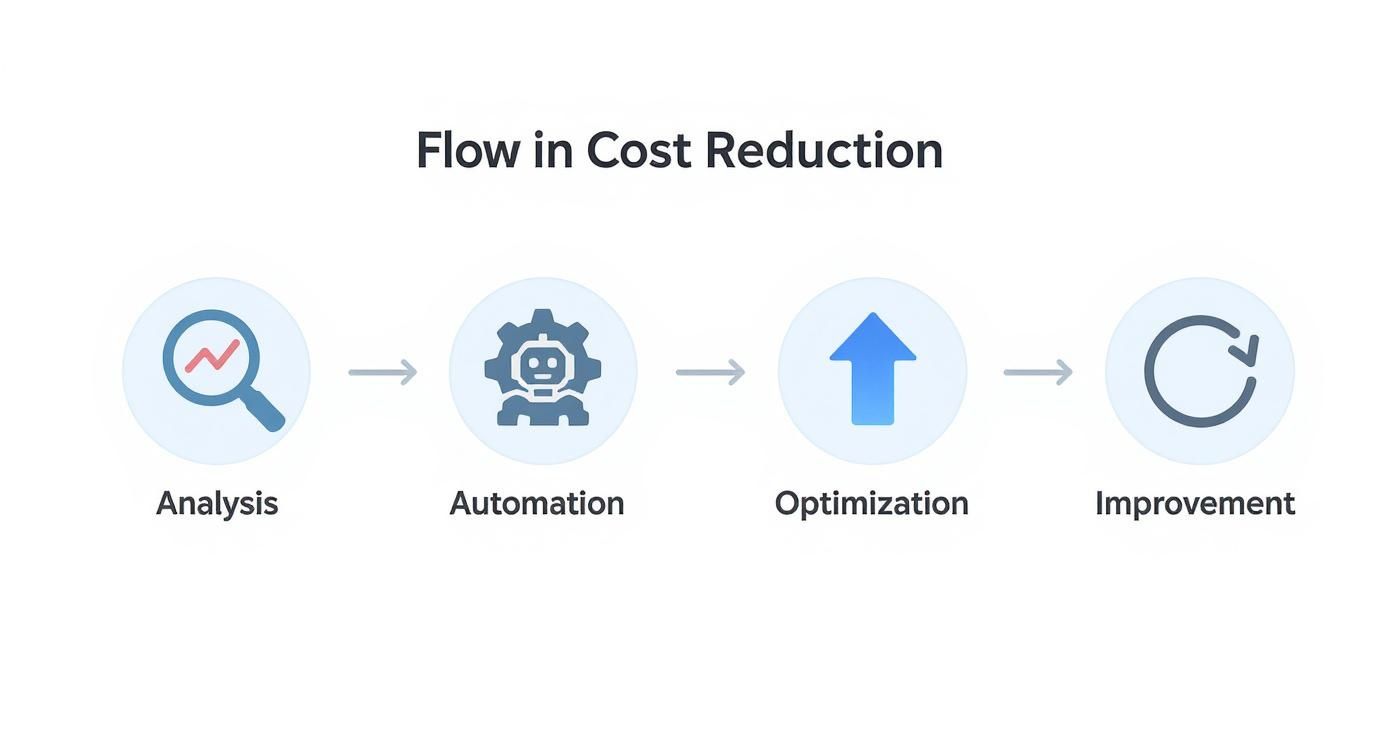
Reducing operational costs requires more than budget cuts; it demands a systematic, technical approach focused on four key domains: granular process analysis, intelligent automation, infrastructure optimization, and a culture of continuous improvement. This is not a one-time initiative but an engineering discipline designed to build financial resilience by systematically eliminating operational waste.
Your Blueprint for Slashing Operational Costs
To decrease operational expenditure, you must move beyond generic advice and engineer a technical blueprint. The objective is to systematically identify and quantify the inefficiencies embedded in your daily workflows and technology stack.
This guide provides an actionable framework for implementing sustainable cost reduction initiatives that deliver measurable savings. It's about transforming operational efficiency from a business buzzword into a quantifiable core function.
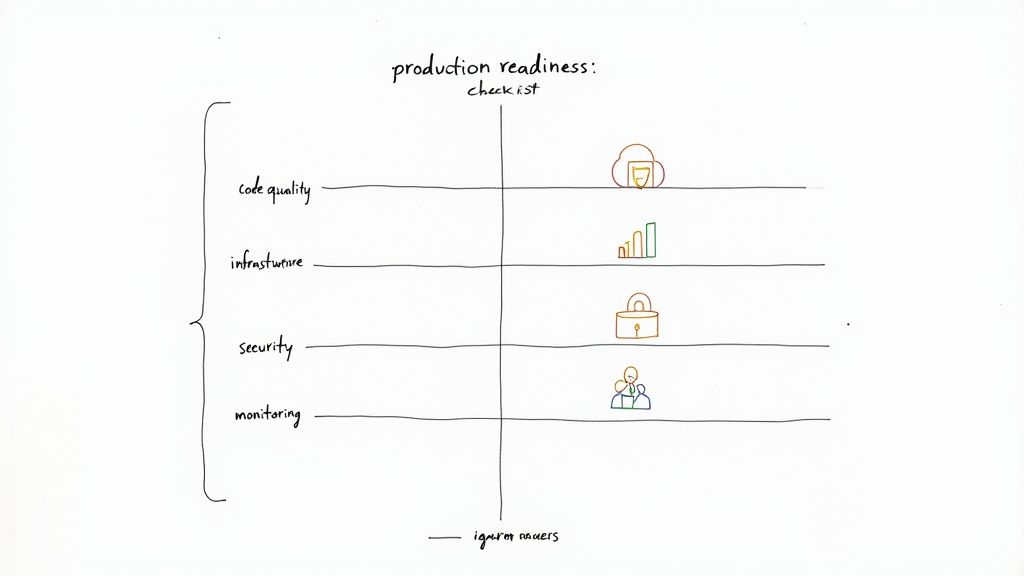
The Four Pillars of Cost Reduction
A robust cost-reduction strategy is built on a technical foundation. These four pillars represent the highest-yield opportunities for impacting your operational expenditure.
- Process Analysis: This phase requires a deep, quantitative analysis of how work is executed. You must map business processes end-to-end using methods like value stream mapping to identify bottlenecks, redundant approval gates, and manual tasks that consume valuable compute and human cycles.
- Intelligent Automation: After pinpointing inefficiencies, automation is the primary tool for remediation. This can range from implementing Robotic Process Automation (RPA) for deterministic data entry tasks to deploying AI/ML models for optimizing complex supply chain logistics or predictive maintenance schedules.
- Infrastructure Optimization: Conduct a rigorous audit of your physical and digital infrastructure. Every asset—from data center hardware and office real estate to IaaS/PaaS services and SaaS licenses—is a significant cost center ripe for optimization through techniques like rightsizing, auto-scaling, and license consolidation.
- Continuous Improvement: Cost reduction is not a static project. It demands a culture of continuous monitoring and refinement, driven by real-time data from performance dashboards and analytics platforms. This is the essence of a DevOps or Kaizen mindset applied to business operations.
A study by Gartner revealed that organizations can slash operational costs by up to 30% by implementing hyperautomation technologies. This statistic validates the financial impact of coupling rigorous process analysis with intelligent, targeted automation.
The following table provides a high-level schematic for this framework.
| Strategy Pillar | Technical Focus | Expected Outcome |
|---|---|---|
| Process Analysis | Value stream mapping, process mining, time-motion studies, identifying process debt. | A quantitative baseline of process performance and identified waste vectors. |
| Intelligent Automation | Applying RPA, AI/ML, and workflow orchestration to eliminate manual, repetitive tasks. | Increased throughput, reduced error rates, and quantifiable savings in FTE hours. |
| Infrastructure Optimization | Auditing and rightsizing cloud instances, servers, and software license utilization. | Lower TCO, reduced OpEx, and improved resource allocation based on actual demand. |
| Continuous Improvement | Establishing KPIs, monitoring dashboards, and feedback loops for ongoing refinement. | Sustainable cost savings and a more agile, resilient, and data-driven operation. |
This framework provides a structured methodology for cost reduction, ensuring you are making strategic technical improvements that strengthen the business's long-term financial health.
As you engineer your blueprint, it's critical to understand the full technical landscape. For example, exploring the key benefits of business process automation reveals how these initiatives compound, impacting everything from data accuracy to employee productivity. Adopting this strategic, technical mindset is what distinguishes minor adjustments from transformative financial results.
Conducting a Granular Operational Cost Audit
Before you can reduce operational costs, you must quantify them at a granular level. A high-level P&L statement is insufficient. True optimization begins with a technical audit that deconstructs your business into its component processes, mapping every input, function, and output to its specific cost signature.
This is not about broad categories like "Software Spend." The objective is to build a detailed cost map of your entire operation, linking specific activities and resources to their financial impact. This map will reveal the hidden inefficiencies and process debt actively draining your budget.
Mapping End-to-End Business Processes
First, decompose your core business processes into their constituent parts. Do not limit your analysis to departmental silos. Instead, trace a single process, like "procure-to-pay," from the initial purchase requisition in your ERP system through vendor selection, PO generation, goods receipt, invoice processing, and final payment settlement.
By mapping this value stream, you expose friction points and quantify their cost. You might discover a convoluted approval workflow where a simple software license request requires sign-offs from four different managers, adding days of cycle time and wasted salary hours. Define metrics for each step: cycle time, touch time, and wait time. Inefficient workflows with high wait times are prime targets for re-engineering.
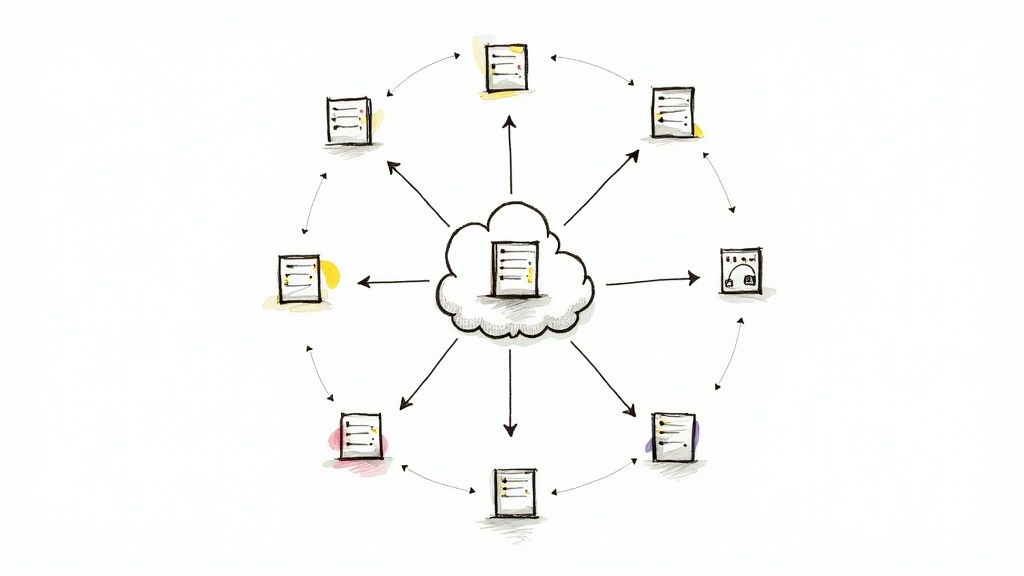
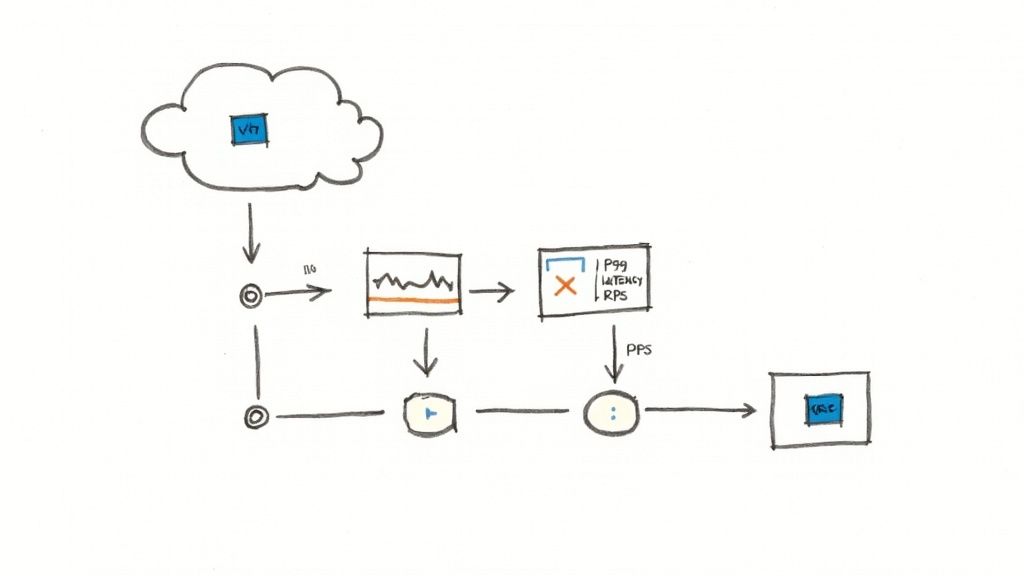
This infographic illustrates the cyclical nature of cost reduction—from deep analysis to tactical execution and back to monitoring.
This continuous loop demonstrates that managing operational expenditure is a sustained engineering discipline, not a one-off project.
Using Technical Tools for Deeper Insights
To achieve the required level of granularity, manual analysis is inadequate. You must leverage specialized tools to extract and correlate data from your operational systems.
- Process Mining Software: Tools like Celonis or UIPath Process Mining programmatically analyze event logs from systems like your ERP, CRM, and ITSM. They generate visual, data-driven process maps that highlight deviations from the ideal workflow ("happy path"), pinpoint bottlenecks, and quantify the frequency of redundant steps that manual discovery would miss.
- Time-Motion Studies: For manual processes in logistics or manufacturing, conduct formal time-motion studies to establish quantitative performance baselines. Use this data to identify opportunities for automation, ergonomic improvements, or process redesign that can yield measurable efficiency gains.
- Resource Utilization Analysis: This is critical. Query the APIs of your cloud providers, CRM, and other SaaS platforms to extract hard utilization data. How many paid software licenses have a last-login date older than 90 days? Are your EC2 instances consistently running at 20% CPU utilization while being provisioned (and billed) for 100% capacity? Answering these questions exposes direct financial waste.
A common finding in software asset management (SAM) audits is that 30% or more of licensed software seats are effectively "shelfware"—provisioned but unused. This represents a significant and easily correctable operational expense.
By combining these technical methods, your audit becomes a strategic operational analysis, not just a financial accounting exercise. You are no longer asking, "What did we spend?" but rather, "Why was this resource consumed, and could we have achieved the same technical outcome with less expenditure?"
The detailed cost map you build becomes the quantitative foundation for every targeted cost-reduction action you execute.
Leveraging Automation for Supply Chain Savings

The supply chain is a prime candidate for cost reduction through targeted automation. Often characterized by manual processes and disparate systems, it contains significant opportunities for applying AI and Robotic Process Automation (RPA) to logistics, procurement, and inventory management for tangible financial returns.
This is not about personnel replacement. It is about eliminating operational friction that creates cost overhead: data entry errors on purchase orders, latency in vendor payments, or suboptimal inventory levels. Automation directly addresses these systemic inefficiencies.
Predictive Analytics for Inventory Optimization
Inventory carrying costs—capital, warehousing, insurance, and obsolescence—are a major operational expense. Over-provisioning ties up capital, while under-provisioning leads to stockouts and lost revenue. Predictive analytics offers a direct solution to this optimization problem.
By training machine learning models on historical sales data, seasonality, and exogenous variables like market trends or macroeconomic indicators, AI-powered systems can forecast demand with high accuracy. This enables the implementation of a true just-in-time (JIT) inventory model, reducing carrying costs that often constitute 20-30% of total inventory value.
A common error is relying on simple moving averages of past sales for demand forecasting. Modern predictive models utilize more sophisticated algorithms (e.g., ARIMA, LSTM networks) and ingest a wider feature set, including competitor pricing and supply chain disruptions, to generate far more accurate forecasts and minimize costly overstocking or understocking events.
The quantitative results are compelling. Early adopters of AI-enabled supply chain management have reported a 15% reduction in logistics costs and inventory level reductions of up to 35%. You can find supporting data in recent supply chain statistics and reports.
Automating Procurement and Vendor Management
The procure-to-pay lifecycle is another process ripe for automation. Manual processing of purchase orders, invoices, and payments is slow and introduces a high probability of human error, leading to payment delays, strained vendor relations, and late fees.
Here is a technical breakdown of how automated workflows mitigate these issues:
- RPA for Purchase Orders: Configure RPA bots to monitor inventory levels in your ERP system. When stock for a specific SKU drops below a predefined threshold, the bot can automatically generate and transmit a purchase order to the approved vendor via API or email, requiring zero human intervention.
- AI-Powered Invoice Processing: Utilize Optical Character Recognition (OCR) and Natural Language Processing (NLP) tools to automatically extract key data from incoming invoices (e.g., invoice number, amount, PO number). The system can then perform an automated three-way match against the purchase order and goods receipt record, flagging exceptions for human review and routing validated invoices directly to the accounts payable system.
- Automated Vendor Onboarding: A workflow automation platform can orchestrate the entire vendor onboarding process, from collecting necessary documentation (W-9s, insurance certificates) via a secure portal to running compliance checks and provisioning the vendor profile in your financial system.
Implementing these systems dramatically reduces cycle times, minimizes costly errors, and reallocates procurement specialists from administrative tasks to high-value activities like strategic sourcing and contract negotiation. To understand how this fits into a broader strategy, review our article on the benefits of workflow automation. This is about transforming procurement from a reactive cost center into a strategic, data-driven function.
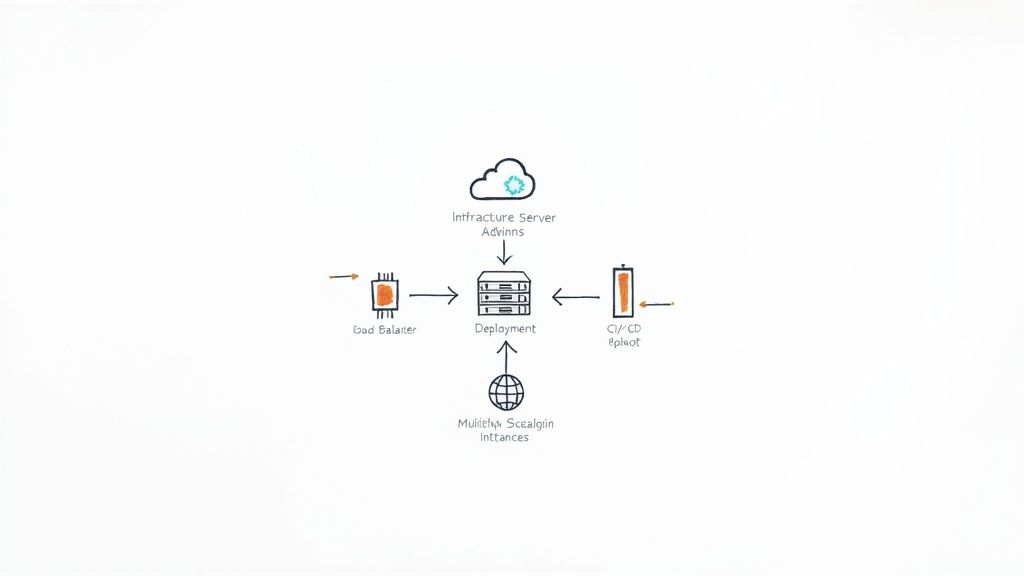
Optimizing Your Technology and Infrastructure Spend
Your technology stack is either a significant competitive advantage or a major source of financial leakage. Optimizing IT operational costs requires a technical, data-driven playbook that goes beyond surface-level budget reviews to re-engineer how your infrastructure operates.
The primary target for optimization is often cloud expenditure. The elasticity of cloud platforms provides incredible agility but also facilitates overspending. Implementing rigorous cloud cost management is one of the most direct ways to impact your operational budget.
Mastering Cloud Cost Management
A significant portion of cloud spend is wasted on idle or over-provisioned resources. A common example is running oversized VM instances. An instance operating at 15% CPU utilization incurs the same cost as one running at 90%. Rightsizing instances to match actual workload demands is a fundamental and high-impact optimization.
Here are specific technical actions to implement immediately:
- Implement Reserved Instances (RIs) and Savings Plans: For predictable, steady-state workloads, leverage commitment-based pricing models like RIs or Savings Plans. These offer substantial discounts—often up to 75%—compared to on-demand pricing in exchange for a one- or three-year commitment. Use utilization data to model your baseline capacity and maximize commitment coverage.
- Automate Shutdown Schedules: Non-production environments (development, staging, QA) rarely need to run 24/7. Use native cloud schedulers (e.g., AWS Instance Scheduler, Azure Automation) or Infrastructure as Code (IaC) scripts to automatically power down these resources outside of business hours and on weekends, immediately cutting their operational cost by over 60%.
- Implement Storage Tiering and Lifecycle Policies: Not all data requires high-performance, high-cost storage. Automate the migration of older, less frequently accessed data from hot storage (e.g., AWS S3 Standard) to cheaper, archival tiers (e.g., S3 Glacier Deep Archive, Azure Archive Storage) using lifecycle policies.
Shifting from a reactive "pay-the-bill" model to proactive FinOps pays significant dividends. For instance, the video platform Kaltura reduced its observability operational costs by 60% by migrating to a more efficient, managed service on AWS, demonstrating the power of architectural optimization.
Eliminating 'Shelfware' and Optimizing Licenses
Beyond infrastructure, software licenses are another major source of hidden costs. It is common for businesses to pay for "shelfware"—software that is licensed but completely unused. A thorough software asset management (SAM) audit is the first step to reclaiming these costs.
This requires extracting and analyzing usage data. Query your SaaS management platform or single sign-on (SSO) provider logs (e.g., Okta, Azure AD) to identify user accounts with no login activity in the last 90 days. This empirical data provides the leverage needed to de-provision licenses and negotiate more favorable terms during enterprise agreement renewals.
A comprehensive guide to managed cloud computing can provide the strategic context for these decisions. For a deeper technical dive, our guide on cloud computing cost reduction strategies offers more specific, actionable tactics. By integrating these strategies, you convert technology spend from a liability into a strategic, optimized asset.
Streamlining Support Functions with Shared Services
One of the most impactful structural changes for reducing operational costs is the centralization of support functions. Instead of maintaining siloed HR, finance, and IT teams within each business unit, these functions are consolidated into a single shared services center (SSC).
This model is not merely about headcount reduction. It is an exercise in process engineering, creating a highly efficient, specialized hub that serves the entire organization. It eliminates redundant roles and mandates the standardization of processes, fundamentally transforming administrative functions from distributed cost centers into a unified, high-performance service delivery organization. The result is a significant reduction in G&A expenses and a marked improvement in process consistency and quality.
The Feasibility and Standardization Phase
The implementation begins with a detailed feasibility study. This involves mapping the as-is processes within each support function across all business units to identify variations, duplicative efforts, and ingrained inefficiencies.
For example, your analysis might reveal that one business unit has a five-step, manually-intensive approval process for invoices, while another uses a three-step, partially automated workflow. The objective is to identify and eliminate such discrepancies.
Once this process landscape is mapped, the next phase is standardization. The goal is to design a single, optimized "to-be" process for each core task—be it onboarding an employee, processing an expense report, or resolving a Tier 1 IT support ticket. These standardized, documented workflows form the operational bedrock of the shared services model.
Adopting a shared services model is a strategic architectural decision, not just a cost-reduction tactic. It compels an organization to adopt a unified, process-centric operating model, which builds the foundation for scalable growth and sustained operational excellence.
Building the Centralized Model
With standardized processes defined, the next step is to build the operational and technical framework for the SSC. This involves several critical components.
- Technology Platform Selection: A robust Enterprise Resource Planning (ERP) system or a dedicated service management platform (like ServiceNow) is essential. This platform becomes the central nervous system of the SSC, automating workflows, providing a single source of truth for all transactions, and enabling performance monitoring through dashboards.
- Navigating Change Management: Centralization often faces internal resistance, as business units may be reluctant to relinquish dedicated support staff. A structured change management program is crucial, with clear communication that articulates the benefits: faster service delivery, consistent execution, and access to better data and insights.
- Defining Service Level Agreements (SLAs): To ensure accountability and measure performance, you must establish clear, quantitative SLAs for every service provided by the SSC. These agreements define metrics like ticket resolution time, processing accuracy, and customer satisfaction, transforming the internal support function into a true service provider with measurable performance.
The financial impact of this consolidation can be substantial. General Electric reported over $500 million in savings from centralizing its finance operations. Procter & Gamble's shared services organization generated $900 million in savings over five years. Organizations that successfully implement this model typically achieve cost reductions between 20% to 40% in the targeted functions.
This strategy often includes consolidating external vendors. For guidance on optimizing those relationships, our technical guide on vendor management best practices can be a valuable resource. By streamlining both internal and external service delivery, you unlock a new level of operational efficiency and cost control.
A Few Common Questions About Cutting Operational Costs
Even with a technical blueprint, specific questions will arise during implementation. Addressing these with clear, data-driven answers is critical for turning strategy into measurable savings. Here are answers to common technical and operational hurdles.
My objective is to provide the technical clarity required to execute your plan effectively.
What’s the Absolute First Thing I Should Do?
Your first action must be a comprehensive operational audit. The impulse to immediately start cutting services is a common mistake that often addresses symptoms rather than root causes. You must begin with impartial, quantitative data. This audit should involve mapping your core business processes end-to-end.
Analyze key value streams—procurement, IT service delivery, HR onboarding—to precisely identify and quantify inefficiencies. Use process mining tools to analyze system event logs or, at a minimum, conduct detailed workflow analysis to uncover bottlenecks, redundant manual tasks, and other forms of operational waste. Without this data-driven baseline, any subsequent actions are based on conjecture.
A classic mistake is to immediately cancel a few software subscriptions to feel productive. A proper audit might reveal the real problem is a poorly designed workflow forcing your team to use three separate tools when a single, properly integrated platform would suffice. Data prevents you from solving the wrong problem.
How Can a Small Business Actually Apply This Stuff?
For small businesses, the focus should be on high-impact, low-overhead solutions that are highly scalable. You do not need an enterprise-grade ERP system to achieve significant results. Leverage affordable SaaS platforms for accounting, CRM, and project management to automate core workflows.
Here are specific, actionable starting points:
- Leverage Public Cloud Services: Utilize platforms like AWS or Azure on a pay-as-you-go basis. This eliminates the significant capital expenditure and ongoing maintenance costs associated with on-premise servers.
- Conduct a Software License Audit: Perform a systematic review of all monthly and annual software subscriptions. Query usage logs and de-provision any license that has not been accessed in the last 90 days.
- Map Core Processes (Even on a Whiteboard): You do not need specialized software. Simply diagramming a key workflow, such as sales order processing, can reveal obvious redundancies and bottlenecks that can be addressed immediately.
For a small business, the strategy is to prioritize automation and optimization that delivers the highest return on investment for the lowest initial cost and complexity.
How Do I Actually Measure the ROI of an Automation Project?
To accurately calculate the Return on Investment (ROI) for an automation project, you must quantify both direct and indirect savings.
Direct savings are tangible and easy to measure. This includes reduced labor hours (calculated using the fully-loaded cost of an employee, including salary, benefits, and overhead), decommissioned software licenses, and a reduction in the cost of rework stemming from human error.
Indirect savings, while harder to quantify, are equally important. These include improved customer satisfaction due to faster service delivery, increased innovation capacity as staff are freed from mundane tasks, and improved data accuracy. The formula remains straightforward: ROI = (Net Savings – Project Cost) / Project Cost. It is critical to establish baseline metrics before implementation and track them after to accurately measure the project's financial impact.
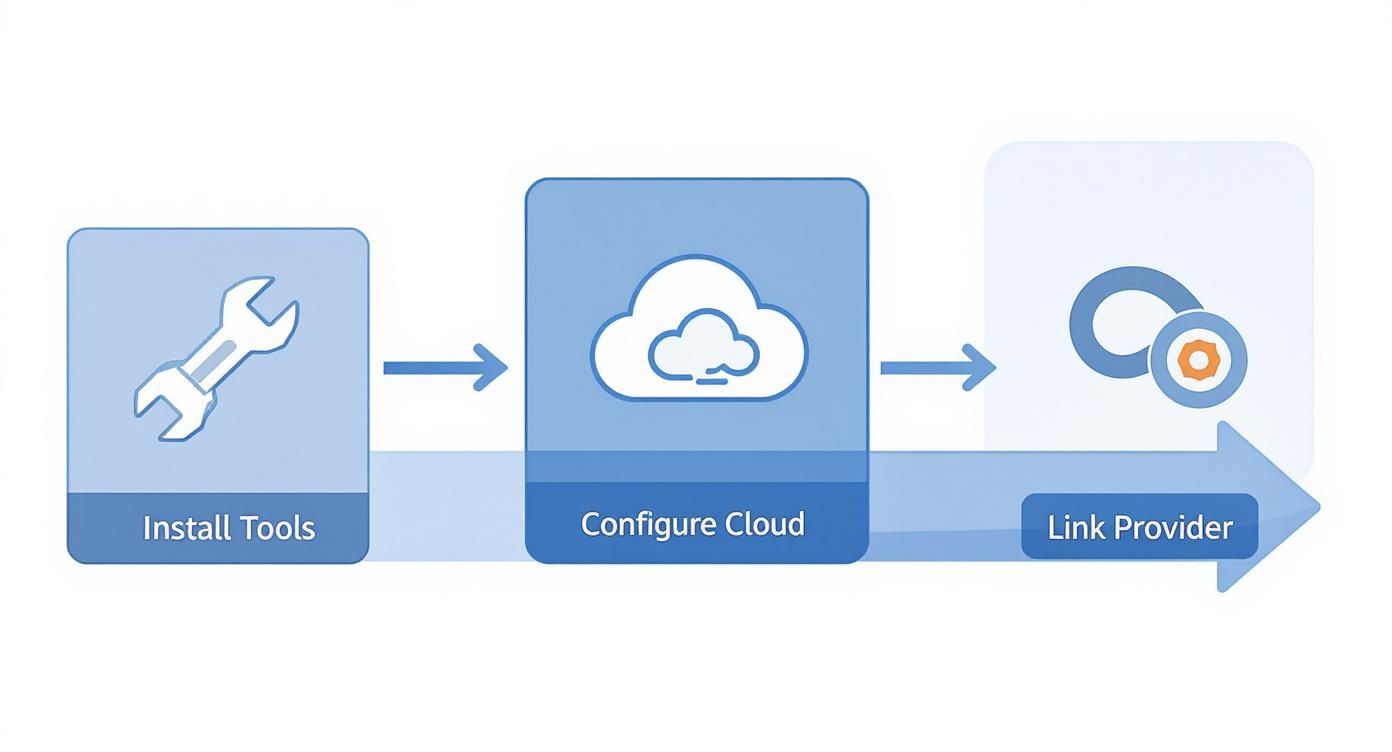
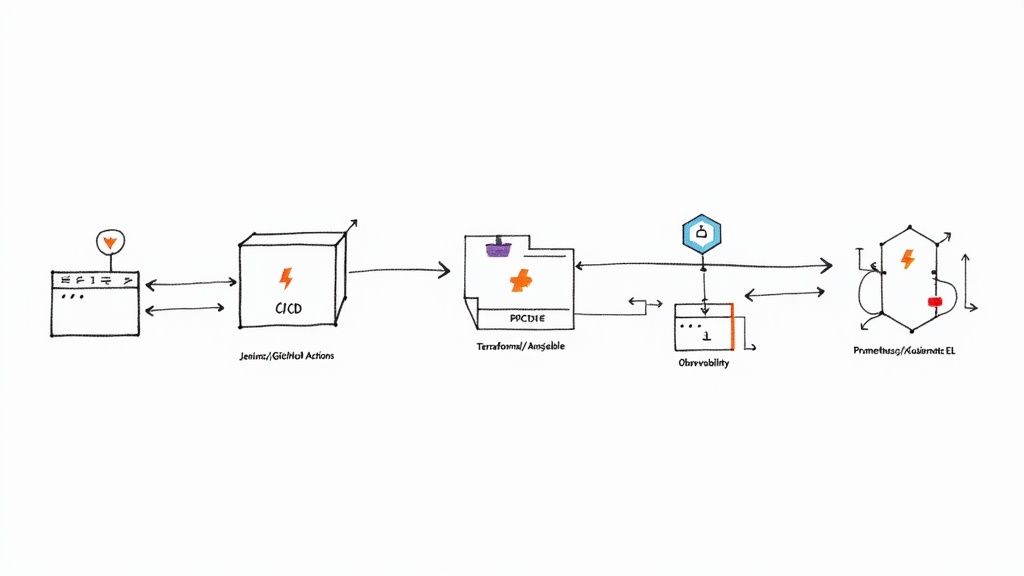
Ready to optimize your DevOps and reduce infrastructure spend? The experts at OpsMoon provide top-tier remote engineers to manage your Kubernetes, Terraform, and CI/CD pipelines. Start with a free work planning session to build a clear roadmap for cost-effective, scalable operations. Learn more and book your free consultation at opsmoon.com.