Author: opsmoon

  • 9 Infrastructure as Code Best practices for 2025

    9 Infrastructure as Code Best practices for 2025

    Adopting Infrastructure as Code (IaC) is more than just scripting; it's a fundamental shift in how we build, deploy, and manage modern systems. By defining infrastructure in declarative configuration files, teams can automate provisioning, eliminate configuration drift, and create reproducible environments. But without a solid foundation of best practices, IaC can introduce its own brand of complexity, risk, and technical debt, turning a powerful enabler into a source of friction. The difference between a high-performing IaC strategy and a brittle one often comes down to the disciplined application of proven principles.

    This guide moves beyond the basics, providing a technical deep-dive into the nine most critical infrastructure as code best practices that elite DevOps teams use to achieve velocity, reliability, and security at scale. Your Infrastructure as Code strategy should be built upon a solid understanding of fundamental SDLC best practices, as treating your infrastructure definitions with the same rigor as your application code is paramount. We will explore specific, actionable techniques that address the entire lifecycle of your infrastructure, from initial commit to production deployment and beyond.

    Whether you're refining your Terraform workflows, automating Kubernetes deployments with Helm, or managing cloud resources with Pulumi, these strategies will provide the blueprint you need. You will learn how to:

    • Structure your code for modularity and reuse.
    • Implement robust testing and validation pipelines.
    • Manage state and secrets securely and effectively.
    • Integrate IaC into a seamless CI/CD workflow.

    This isn't a theoretical overview. It's a practical playbook for building robust, maintainable, and highly automated cloud environments that can scale with your organization's demands. Let’s dive into the core practices that separate the successful from the struggling.

    1. Version Control Everything: Treat Infrastructure as a First-Class Citizen

    The foundational principle of Infrastructure as Code (IaC) is to manage and provision infrastructure through machine-readable definition files, rather than physical hardware configuration or interactive configuration tools. This first and most crucial of all infrastructure as code best practices is to treat those definition files with the same discipline and rigor as application source code. This begins by committing every infrastructure artifact to a version control system (VCS) like Git.

    Placing your Terraform configurations, CloudFormation templates, Ansible playbooks, or Kubernetes manifests in a Git repository establishes a single source of truth. This creates an immutable, auditable log of every single change made to your environment. You can pinpoint exactly who changed what, when they changed it, and why, transforming infrastructure management from an opaque, manual process into a transparent engineering discipline.

    Why This Is a Foundational Practice

    Version control is the bedrock upon which other advanced practices like CI/CD, GitOps, and automated testing are built. Without it, collaboration becomes chaotic, rollbacks are manual and risky, and disaster recovery is a matter of guesswork. It enables parallel development using branching strategies, ensures quality through peer reviews via pull requests, and provides the stability needed to build complex systems.

    For example, a DevOps team can use a dedicated Git repository for their Terraform modules, enforcing a rule that no change is merged to the main branch without at least one approval. This simple workflow prevents configuration drift and unilateral changes that could cause an outage.

    Actionable Implementation Tips

    To effectively implement version control for your infrastructure, follow these technical guidelines:

    • Adopt a Branching Strategy: Use a model like GitFlow or a simpler trunk-based development flow. Create feature branches for new infrastructure (e.g., feature/add-redis-cache) and use pull/merge requests to review, test, and approve changes before integrating them.
    • Write Atomic, Descriptive Commits: A commit message like feat(vpc): add egress-only internet gateway for private subnets is far more valuable than updated network stuff. This provides clear, searchable history.
    • Use Git Tags for Releases: Tag commits that represent a stable, deployable version of your infrastructure (e.g., v1.2.0). This helps align infrastructure versions with specific application releases.
    • Leverage Pre-Commit Hooks: Integrate tools like tfsec for security scanning, tflint for linting, and terraform fmt for formatting. These hooks run automatically before a commit is created, catching errors and enforcing standards early.

    2. Embrace Immutable Infrastructure: Eliminate Configuration Drift

    Immutable infrastructure is a powerful paradigm where servers and other infrastructure components are never modified after they are deployed. Instead of logging in to patch a running server or reconfigure an application, you build a completely new version of that component, deploy it, and then terminate the old one. This approach, another critical infrastructure as code best practice, treats infrastructure components as ephemeral, replaceable artifacts.

    By adopting this model, you fundamentally eliminate configuration drift, the slow, untracked accumulation of changes that makes environments inconsistent and unpredictable. Every deployment starts from a known, version-controlled state, ensuring that your staging environment is an exact replica of production, which drastically simplifies debugging and testing.

    Immutable Infrastructure

    Why This Is a Foundational Practice

    Immutability turns deployments and rollbacks into simple, low-risk atomic operations. An update is just a new set of resources, and a rollback is as easy as deploying the previous version. This practice, popularized by companies like Netflix and foundational to containerization with Docker and Kubernetes, brings unprecedented predictability and reliability to infrastructure management. It moves teams away from complex, error-prone "in-place" updates toward a more declarative, idempotent operational model.

    For instance, a team using Kubernetes doesn't ssh into a running container to apply a patch. Instead, they build a new container image with the patch, update the Deployment manifest to reference the new image tag, and let Kubernetes manage a rolling update, safely replacing old Pods with new ones.

    Actionable Implementation Tips

    To effectively adopt an immutable infrastructure model, focus on creating and managing deployment artifacts:

    • Package Applications as Immutable Units: Use tools like Packer to build versioned Amazon Machine Images (AMIs) or create container images with Docker. These artifacts should contain the application and all its dependencies, ensuring a self-contained, ready-to-run unit.
    • Implement Blue-Green or Canary Deployments: Leverage these advanced deployment strategies to safely transition traffic from the old infrastructure version to the new one. This allows for zero-downtime updates and provides an immediate rollback path if issues are detected.
    • Decouple State from Compute: Stateful data (like databases, user uploads, or session logs) must be stored externally on managed services like Amazon RDS, S3, or ElastiCache. This allows your compute instances or containers to be terminated and replaced without data loss.
    • Automate Artifact Promotion: Create a CI/CD pipeline that automatically builds, tests, and validates your immutable images. A successful build should result in a versioned, tagged artifact that is then promoted through different environments (dev, staging, prod).

    3. Strive for Environment Parity: Eliminate the "It Works on My Machine" Problem

    A classic source of deployment failures and bugs is the subtle-yet-critical divergence between development, staging, and production environments. Environment parity, a core tenet of modern DevOps and one of the most impactful infrastructure as code best practices, directly addresses this by ensuring that all environments are as identical as possible. The goal is to provision every environment from the same IaC templates, with the only differences being configuration parameters like resource sizes, secrets, and domain names.

    This approach, popularized by frameworks like the Twelve-Factor App methodology, minimizes surprises during deployment. When your staging environment mirrors production's architecture, network topology, and service integrations, you can be highly confident that code validated in staging will behave predictably in production. IaC is the key enabler, turning the complex task of replicating environments into a repeatable, automated process.

    Why This Is a Foundational Practice

    Environment parity transforms your pre-production environments from loose approximations into high-fidelity simulators of production. This drastically reduces the risk of environment-specific bugs that are costly and difficult to debug post-release. By codifying the entire environment, you eliminate configuration drift caused by manual "hotfixes" or undocumented changes, ensuring that every deployment target is a known, consistent state.

    For instance, a team using Terraform can manage multiple AWS accounts (dev, staging, prod) using the same set of modules. The production environment might be provisioned with a t3.large RDS instance, while staging uses a t3.medium and dev a t3.small. While the instance sizes differ for cost-saving, the networking rules, IAM policies, and database configurations remain identical, preserving architectural integrity across the pipeline.

    Actionable Implementation Tips

    To effectively achieve and maintain environment parity, apply these technical strategies:

    • Use Variables and Parameter Files: Externalize all environment-specific configurations. Use Terraform's .tfvars files, CloudFormation parameter files, or Helm values.yaml files for each environment. The core IaC logic should remain unchanged.
    • Leverage IaC Workspaces or Stacks: Tools like Terraform Workspaces or Pulumi Stacks are designed to manage multiple instances of the same infrastructure configuration. Each workspace or stack maps to an environment (e.g., dev, stg, prod) and manages its own separate state file.
    • Automate Environment Provisioning: Integrate your IaC toolchain into your CI/CD pipeline to create and destroy ephemeral environments for pull requests. This allows for testing changes in a perfect, isolated replica of production before merging.
    • Keep Topologies Identical: While resource scaling (CPU, memory) can differ to manage costs, the architectural topology should not. If production has a load balancer, a web fleet, and a database, your staging and development environments should too, even if the "fleet" is just a single small instance.

    4. Infrastructure Testing and Validation

    Just as application code requires rigorous testing before being deployed to production, so does your infrastructure code. One of the most critical infrastructure as code best practices is to establish a comprehensive testing and validation strategy. This involves creating automated checks that run against your IaC definitions to catch syntax errors, logical flaws, security vulnerabilities, and compliance violations before they impact your live environment.

    Infrastructure Testing and Validation

    Treating infrastructure code as a testable artifact fundamentally shifts the operational mindset from reactive fire-fighting to proactive quality assurance. Instead of discovering a misconfigured security group after a breach, you can identify the issue during a CI pipeline run. This practice builds confidence in your deployments, accelerates release velocity, and significantly reduces the risk of costly, service-impacting errors.

    Why This Is a Foundational Practice

    Without automated testing, every infrastructure change is a high-stakes gamble. Manual reviews are prone to human error and cannot scale effectively as infrastructure complexity grows. A robust testing pyramid for IaC, including static analysis, unit, and integration tests, provides a safety net that ensures infrastructure is deployed correctly, securely, and consistently every time. This discipline is essential for achieving true continuous delivery and maintaining operational stability.

    For example, a platform engineering team can use Terratest to write Go-based integration tests for their Terraform modules. A test could be designed to spin up an AWS S3 bucket using the module, verify that server-side encryption is enabled by default, and then tear down the resource. This automated check guarantees that all buckets provisioned by this module adhere to the company's security policy.

    Actionable Implementation Tips

    To effectively integrate testing and validation into your IaC workflow, follow these technical guidelines:

    • Start with Static Analysis and Linting: Integrate tools like tflint or cfn-lint directly into your CI pipeline and pre-commit hooks. These tools perform fast checks for syntax errors, deprecated resources, and common misconfigurations without deploying any infrastructure.
    • Implement Policy-as-Code for Compliance: Use frameworks like Open Policy Agent (OPA) with Conftest or Sentinel by HashiCorp. This allows you to define and enforce specific governance rules, such as "all EBS volumes must be encrypted" or "EC2 instances cannot use the 0.0.0.0/0 security group ingress rule."
    • Use Ephemeral Test Environments: For integration and end-to-end tests, spin up short-lived environments that mirror production. Tools like Ansible Molecule for role testing or Terratest for Terraform are designed to provision infrastructure, run validation checks, and then automatically destroy the resources to control costs.
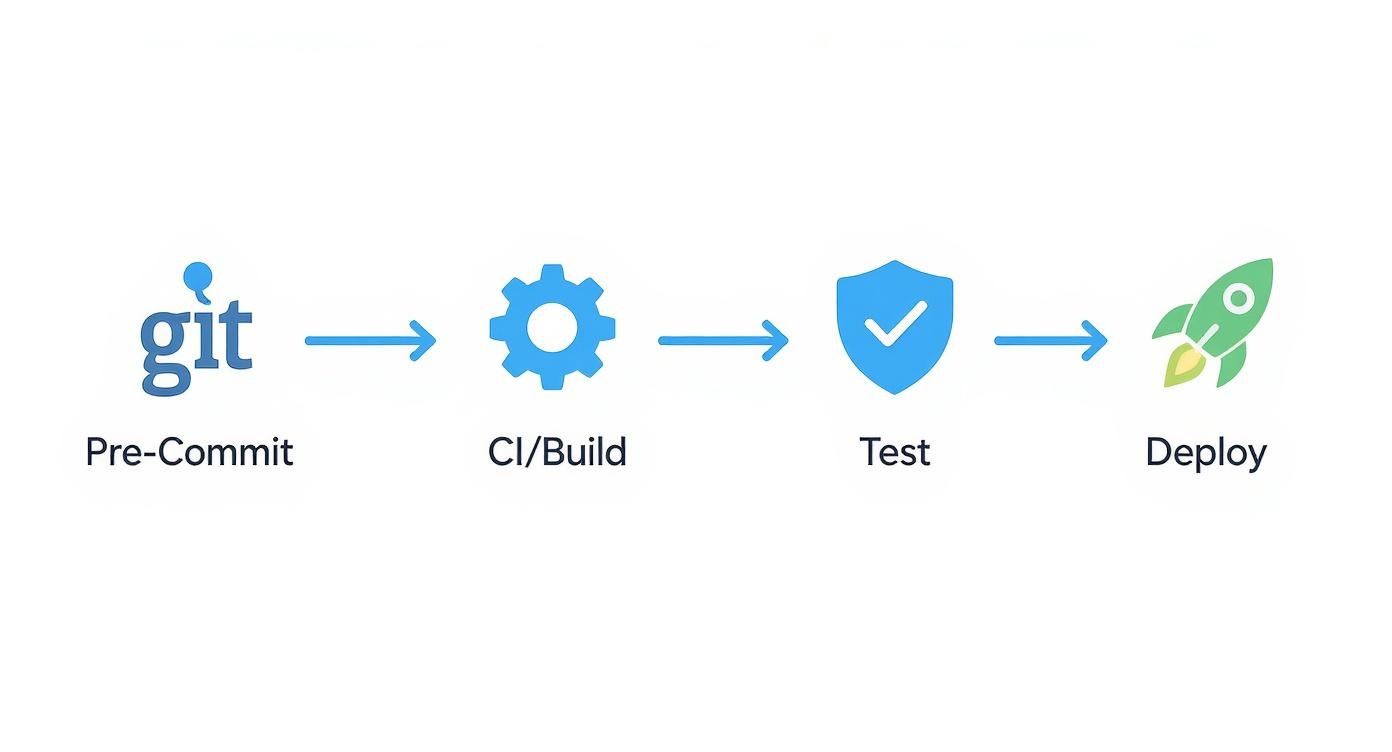
    • Integrate Testing into CI/CD Pipelines: Embed your testing stages directly into your CI/CD pipeline. A typical pipeline should follow a sequence of lint -> validate -> plan -> test (in a temporary environment) -> deploy. This ensures that no untested code reaches your production environment.

    5. Modular and Reusable Code

    As infrastructure environments grow in complexity, managing monolithic configuration files becomes untenable. Adopting a modular approach is one of the most impactful infrastructure as code best practices for achieving scale and maintainability. This practice involves structuring your code into smaller, reusable, and composable modules that encapsulate specific functionality, like a VPC network, a database instance, or a Kubernetes cluster configuration.

    By breaking down your infrastructure into logical, self-contained units, you transform your codebase from a sprawling script into a clean, well-organized library of building blocks. A team can define a standard module for deploying an application's backend services, which can then be instantiated consistently across development, staging, and production environments with different input parameters. This greatly reduces duplication, simplifies maintenance, and enforces organizational standards.

    Why This Is a Foundational Practice

    Modular code is the key to managing complexity and ensuring consistency at scale. It prevents configuration drift by providing standardized, versioned components that teams can trust. Instead of reinventing the wheel for every project, engineers can leverage a catalog of pre-approved modules, accelerating delivery and reducing the likelihood of human error. This pattern is so fundamental that major IaC tools have built entire ecosystems around it, such as the Terraform Registry and Ansible Galaxy.

    This approach also simplifies updates and refactoring. If you need to update the logging configuration for all RDS databases, you only need to modify the central RDS module. Once the new module version is published, every project that consumes it can be updated in a controlled, predictable manner.

    Actionable Implementation Tips

    To effectively create and manage modular infrastructure code, consider these technical guidelines:

    • Design for Single Responsibility: Each module should do one thing and do it well. For example, a module for an AWS S3 bucket should only create the bucket and its associated policies, not the IAM roles that access it.
    • Use Semantic Versioning: Tag your modules with versions (e.g., v1.2.0) in their Git repository. This allows consuming projects to pin to a specific, stable version, preventing unexpected changes from breaking their deployments.
    • Provide Clear Documentation and Examples: Every module should have a README.md file that explains its purpose, lists all input variables and outputs, and includes a clear usage example. See these infrastructure as code examples for a practical look at how modules are structured.
    • Implement Input Validation and Sensible Defaults: Your module should validate incoming variables to catch errors early and provide sane default values wherever possible to make it easier to use. For instance, a security group module could default to denying all ingress traffic.

    6. Secrets and Configuration Management: Secure Your Sensitive Data

    One of the most critical infrastructure as code best practices is the secure handling of sensitive data. Hardcoding secrets like API keys, database passwords, or private certificates directly into your IaC files is a severe security vulnerability. Once committed to version control, this sensitive information becomes exposed to anyone with repository access and can persist in the Git history even if removed later. Effective secrets management separates sensitive data from your declarative code, injecting it securely only when and where it is needed.

    This practice involves using dedicated secret management tools to store, control, and audit access to tokens, passwords, and other credentials. Your infrastructure code then references these secrets dynamically during runtime, rather than storing them in plain text. This approach not only prevents credential leakage but also centralizes secrets management, making rotation and auditing a streamlined, policy-driven process. It is a non-negotiable step for building secure, compliant, and production-ready infrastructure.

    Why This Is a Foundational Practice

    Failing to properly manage secrets undermines the security of your entire stack. A leaked credential can provide an attacker with a direct entry point into your cloud environment, databases, or third-party services. Centralized secret stores like HashiCorp Vault, AWS Secrets Manager, or Azure Key Vault provide a secure, encrypted, and access-controlled source of truth for all sensitive configuration. This decouples the lifecycle of your secrets from your code, enabling automated rotation and fine-grained access policies without requiring code changes.

    For instance, a Kubernetes deployment manifest can be configured to pull a database password from Azure Key Vault at pod startup. The manifest itself contains only a reference to the secret, not the value. This ensures developers can manage deployments without ever needing to see or handle the production password, drastically reducing the attack surface. For deeper insights into securing your CI/CD pipeline, you can learn more about comprehensive DevOps security best practices.

    Actionable Implementation Tips

    To implement robust secrets management in your IaC workflows, follow these technical guidelines:

    • Use a Dedicated Secret Store: Integrate your IaC tools with a specialized service. Use the AWS Secrets Manager data source in Terraform, the secrets-store.csi.k8s.io driver in Kubernetes, or native integrations with Azure Key Vault in ARM templates.
    • Implement Least-Privilege Access: Configure IAM roles or policies that grant your CI/CD pipeline or deployment compute instances the minimum permissions required to retrieve only the specific secrets they need for a task.
    • Automate Secret Rotation: Leverage the built-in rotation capabilities of your secrets manager. For example, configure AWS Secrets Manager to automatically rotate RDS database credentials every 30 days, ensuring credentials have a limited lifetime.
    • Scan for Secrets in CI/CD: Integrate automated secret scanning tools like gitleaks or truffleHog into your pre-commit hooks and CI pipeline. This acts as a safety net to catch any credentials that are accidentally hardcoded before they are merged.

    7. State Management and Backend Configuration

    Most modern IaC tools, like Terraform and Pulumi, rely on a state file to map real-world resources to your configuration. This state file tracks metadata about your managed infrastructure, acting as a crucial bridge between your code and the provisioned environment. Another essential entry in our list of infrastructure as code best practices is to actively manage this state, moving it away from your local machine and into a secure, centralized location.

    Using a remote backend is the standard solution for state management in any collaborative setting. A remote backend is a shared storage service (like an AWS S3 bucket, Azure Blob Storage, or Google Cloud Storage) configured to store the state file. This ensures that every team member operates with the same, most up-to-date view of the infrastructure, preventing conflicts and data loss.

    Why This Is a Foundational Practice

    Local state management is a recipe for disaster in team environments. If a state file is stored only on a developer's laptop, it can be accidentally deleted, become out of sync, or lead to multiple engineers unknowingly making conflicting changes to the same resources, causing corruption. Proper state management with remote backends and locking mechanisms is non-negotiable for collaborative, production-grade IaC.

    For instance, a team using Terraform can configure an AWS S3 backend with a DynamoDB table for state locking. When one engineer runs terraform apply, a lock is placed in the DynamoDB table. If another team member attempts to run an apply at the same time, the operation will fail until the lock is released, preventing "race conditions" that could corrupt the state and the infrastructure itself.

    Actionable Implementation Tips

    To implement robust state management, follow these technical guidelines:

    • Always Use Remote Backends: For any project involving more than one person, configure a remote backend from day one. Do not commit state files directly to your version control system; add *.tfstate and *.tfstate.backup to your .gitignore file.
    • Enable State Locking: Choose a backend that supports state locking, such as AWS S3 with DynamoDB, Azure Blob Storage with native locking, or HashiCorp Consul. This is your primary defense against concurrent state modifications.
    • Encrypt State at Rest: State files contain potentially sensitive information about your infrastructure. Ensure the remote backend is configured to encrypt data at rest (e.g., using S3 server-side encryption).
    • Logically Organize State Files: Avoid a single, monolithic state file for your entire infrastructure. Instead, break it down by environment, region, or component (e.g., prod/us-east-1/vpc/terraform.tfstate). Tools like Terragrunt can help automate this organization.

    8. Continuous Integration and Deployment (CI/CD)

    Just as application code benefits from automated build and deployment pipelines, your infrastructure code requires the same level of automation and rigor. Implementing CI/CD for IaC is a cornerstone of modern DevOps and one of the most impactful infrastructure as code best practices. It involves creating automated pipelines that validate, test, plan, and apply infrastructure changes whenever code is pushed to your version control system.

    By integrating IaC into a CI/CD pipeline, you transform infrastructure management from a manual, error-prone task into a systematic, repeatable, and audited process. This automation ensures every change is consistently vetted against your standards before it reaches production, dramatically reducing the risk of misconfigurations and configuration drift.

    Why This Is a Foundational Practice

    Automating infrastructure deployments through CI/CD pipelines enforces consistency and provides a clear, controlled path to production. It removes the "it works on my machine" problem by running IaC tools like Terraform or CloudFormation in a standardized, ephemeral environment. This practice codifies your deployment process, making it transparent and easy for new team members to understand and contribute to.

    For instance, a GitHub Actions workflow can be configured to automatically run terraform plan on every pull request, posting the output as a comment. This gives reviewers an exact preview of the proposed changes, allowing them to approve or deny the change with full confidence before it is merged and applied to the production environment.

    Actionable Implementation Tips

    To build robust and secure CI/CD pipelines for your infrastructure, follow these technical guidelines:

    • Start Simple and Iterate: Begin with a basic pipeline that only performs validation (e.g., terraform validate) and linting (tflint). Gradually add more complex stages like automated testing, security scanning with tools like tfsec, and plan generation.
    • Implement Approval Gates: For sensitive environments like production, add a manual approval step in your pipeline. This ensures that a human reviews the planned changes (the terraform plan output) before the pipeline proceeds with the apply stage.
    • Securely Manage Credentials: Never hardcode secrets or credentials in your IaC files or pipeline definitions. Use the CI/CD platform's built-in secret management tools, such as GitHub Secrets, GitLab CI/CD variables, or a dedicated vault solution like HashiCorp Vault.
    • Use Pipeline Templates: To maintain consistency across multiple projects and teams, create reusable pipeline templates or shared actions. This approach standardizes your deployment process and makes it easier to enforce global security and compliance policies. To go deeper, learn more about CI/CD pipeline best practices on opsmoon.com.

    9. Documentation and Self-Describing Code

    Infrastructure code that is difficult to understand is difficult to maintain, extend, and troubleshoot. This ninth entry in our list of infrastructure as code best practices focuses on making your codebase approachable and sustainable by combining explicit documentation with self-describing code. This means not only creating external guides but also writing code that explains itself through clarity and convention.

    This dual approach ensures that another engineer, or even your future self, can quickly grasp the purpose, design, and operational nuances of your infrastructure. Instead of relying solely on reverse-engineering complex configurations during an outage, your team can consult well-maintained documentation and readable code, dramatically reducing mean time to resolution (MTTR) and improving collaboration.

    Why This Is a Foundational Practice

    Undocumented infrastructure is a form of technical debt that accrues interest rapidly. It creates knowledge silos, increases onboarding time for new team members, and makes peer reviews less effective. By embedding documentation directly within your IaC repository and adopting clean coding habits, you create a living, single source of truth that evolves alongside your infrastructure, preventing configuration drift between what is documented and what is deployed.

    For example, a Terraform module for a production database should have a comprehensive README.md file detailing its input variables, outputs, and usage examples. Simultaneously, the resource names within the code, like aws_db_instance.prod_postgres_primary, should immediately convey their purpose without requiring external lookup.

    Actionable Implementation Tips

    To effectively document your infrastructure and write self-describing code, follow these technical guidelines:

    • Adopt Descriptive Naming Conventions: Use a consistent and clear naming scheme for resources, variables, modules, and files. A name like variable "web_app_instance_count" is far more informative than var_a.
    • Keep Documentation Close to Code: Store documentation, like README.md files for modules and Architecture Decision Records (ADRs), in the same Git repository as the code it describes. This ensures they are versioned together.
    • Use Code Comments for the "Why," Not the "What": Your code should describe what it is doing. Use comments to explain complex logic, business justifications, or compromises (e.g., # Increased timeout due to slow upstream API response - JIRA-123).
    • Document Module Interfaces: For every reusable module (Terraform, Ansible role, etc.), provide a clear README.md that documents all input variables and output values, including their types, defaults, and a usage example.
    • Leverage IaC Tooling for Documentation: Use tools like terraform-docs to automatically generate documentation from your code, ensuring it never goes stale. CloudFormation templates support detailed Description fields for parameters, which appear directly in the AWS console.

    To further enhance your IaC documentation, you can explore detailed insights on technical documentation best practices.

    Best Practices Comparison Matrix for IaC

    Practice Implementation Complexity Resource Requirements Expected Outcomes Ideal Use Cases Key Advantages
    Version Control Everything Moderate Version control systems (Git) Full change tracking, auditability Collaborative infrastructure development Enables rollback, compliance, code reviews
    Immutable Infrastructure High Immutable images/artifacts Consistent, drift-free environments Deployments requiring predictability and security Eliminates drift, eases rollback, improves security
    Environment Parity Moderate Multi-environment IaC setups Consistent behavior across environments Multi-stage deployments (dev/staging/prod) Reduces environment-specific bugs
    Infrastructure Testing and Validation High Testing frameworks and CI/CD Early error detection, compliance Regulated environments and critical infrastructure Improves quality, reduces manual testing
    Modular and Reusable Code Moderate to High Module libraries and versioning Reusable, maintainable code Large teams/projects requiring standardization Reduces duplication, accelerates development
    Secrets and Configuration Management Moderate Secret management services Secure handling of sensitive data Security-critical deployments Prevents secrets leaks, supports rotation
    State Management and Backend Configuration Moderate Remote backends and locking Consistent state, team collaboration Team-based IaC workflows Prevents conflicts, enables disaster recovery
    Continuous Integration and Deployment (CI/CD) High CI/CD pipelines and automation Automated, consistent deployments Automated infrastructure delivery Reduces errors, accelerates delivery
    Documentation and Self-Describing Code Low to Moderate Documentation tools, discipline Maintainable, understandable code Teams focused on knowledge sharing and compliance Reduces onboarding time, supports audits

    Build Your Foundation for Scalable DevOps with OpsMoon

    Transitioning from manual infrastructure management to a mature Infrastructure as Code (IaC) practice is a significant undertaking, but the rewards are transformative. Throughout this guide, we've explored the core pillars that separate fragile, high-maintenance IaC from robust, scalable systems. Embracing these infrastructure as code best practices is not merely about adopting new tools; it's about fundamentally shifting your team's mindset towards treating infrastructure with the same discipline and rigor as application code.

    The journey begins with establishing an unshakable foundation. By committing every configuration to version control, you create a single source of truth that enables audibility, rollback capabilities, and collaborative development. This principle, combined with the pursuit of immutable infrastructure, eradicates configuration drift and ensures that every environment is a predictable, reproducible artifact built from your codebase.

    From Principles to Production-Ready Pipelines

    Moving beyond foundational concepts, the true power of IaC is unlocked through systematic execution and automation. The practices of maintaining strict environment parity and implementing a comprehensive infrastructure testing strategy are critical. These two disciplines work in tandem to eliminate the "it works on my machine" problem, catching bugs and misconfigurations long before they can impact production users. Validating your code with static analysis, unit tests, and integration tests turns your CI/CD pipeline into a quality gatekeeper for your infrastructure.

    This level of automation and quality control is only sustainable with clean, well-structured code. The principles of modular and reusable code are paramount. Breaking down complex infrastructure into smaller, composable modules (like Terraform modules or CloudFormation nested stacks) not only reduces duplication but also accelerates development and lowers the cognitive load on your engineers.

    Key Takeaway: The goal is to build a "factory" for your infrastructure. Each component should be a standardized, tested, and versioned artifact that can be assembled reliably through an automated pipeline, not a unique, handcrafted piece of art.

    Securing and Scaling Your IaC Practice

    As your infrastructure grows in complexity, so do the challenges of managing it securely and collaboratively. This is where advanced practices become non-negotiable. Implementing a robust strategy for secrets and configuration management using tools like HashiCorp Vault or AWS Secrets Manager is essential to prevent sensitive data from ever touching your version control system.

    Similarly, disciplined state management, using remote backends with locking mechanisms, is the only way to prevent conflicts and data corruption when multiple engineers are making changes simultaneously. This, integrated into a mature CI/CD pipeline, forms the automated backbone of your operations. Every git push should trigger a plan, a series of validation tests, and a manual or automatic apply, ensuring every change is peer-reviewed and deployed consistently. Finally, clear documentation and self-describing code close the loop, making your systems understandable and maintainable for a growing team.

    Ultimately, mastering these infrastructure as code best practices is the key to unlocking true DevOps agility. It transforms your infrastructure from a brittle, static liability into a dynamic, resilient, and programmable asset that directly enables business velocity and innovation.


    Ready to implement these best practices with world-class expertise? OpsMoon connects you with the top 0.7% of freelance DevOps and platform engineers who specialize in building secure, scalable, and automated infrastructure. Start with a free work planning session to get a clear roadmap for your IaC journey by visiting OpsMoon.

  • Top 8 Best Practices for Continuous Integration in 2025

    Top 8 Best Practices for Continuous Integration in 2025

    Continuous Integration is no longer an optional luxury but a foundational pillar of modern software delivery. Moving beyond textbook definitions, we'll dive into the technical bedrock of elite CI pipelines. This guide provides a curated roundup of the most critical, actionable best practices for continuous integration, designed for engineers and leaders who want to build, test, and deploy code with greater speed and confidence. Each practice is a building block for creating a resilient, efficient, and fully automated software factory.

    Implementing these technical strategies requires a deep understanding of process and collaboration, often forming a core part of mastering DevOps team roles and responsibilities. The goal is to establish a system where small, frequent code changes are automatically verified, enabling teams to detect integration errors as early as possible. This approach dramatically reduces the risk and complexity associated with large, infrequent merges, ultimately accelerating the delivery lifecycle without sacrificing quality.

    This article bypasses high-level theory to deliver specific, tactical advice. We will explore eight essential practices, from maintaining a single source repository and automating the build to the critical discipline of fixing broken builds immediately. Let's examine the technical strategies that separate high-performing engineering teams from the rest.

    1. Commit Code Frequently in Small, Logical Batches

    A core principle of effective Continuous Integration is a high-frequency commit cadence. Instead of working on large, long-lived feature branches for days or weeks, developers should integrate small, logical changes into the shared mainline (e.g., main or trunk) multiple times per day. This practice, often called atomic commits, is the heartbeat of a healthy CI pipeline. Each commit represents a single, complete unit of work that passes local tests before being pushed.

    1. Commit Code Frequently in Small, Logical Batches

    This approach minimizes the risk of complex merge conflicts, the dreaded "merge hell" that arises when integrating massive changes. When commits are small, pinpointing the source of a build failure or a new bug becomes exponentially faster. This practice is one of the most fundamental best practices for continuous integration because it creates a consistent, predictable flow of code into the system, enabling rapid feedback and early issue detection.

    Why This Is a Foundational CI Practice

    Frequent, small commits directly reduce integration risk. Large-scale integrations are complex, unpredictable, and difficult to troubleshoot. By contrast, a small commit that breaks the build is immediately identifiable and can often be fixed in minutes with a git revert <commit-hash>. This rapid feedback loop builds developer confidence and accelerates the entire development lifecycle. Industry leaders like Google and Netflix have built their engineering cultures around this concept, processing thousands of small, independent commits daily to maintain velocity and stability at scale.

    "The whole point of Continuous Integration is to avoid the pain of big-bang integrations. If you aren't integrating at least daily, you aren't really doing CI."

    Actionable Implementation Tips

    • Decompose Large Features: Break down epic-level tasks into the smallest possible vertical slices that can be built, tested, and committed independently. A single commit might only add a new API endpoint without any business logic, followed by another commit adding the logic, and a third adding tests.
    • Utilize Feature Flags: Merge incomplete features into the mainline by wrapping them in feature flags using libraries like LaunchDarkly or Unleash. This decouples code deployment from feature release, allowing you to integrate continuously without exposing unfinished work to users.
    • Establish Commit Standards: Enforce clear commit message formats like Conventional Commits (feat: add user login endpoint). Use Git hooks (e.g., with Husky) to lint commit messages before they are created, ensuring consistency and enabling automated changelog generation.
    • Commit Tested, Working Code: Before pushing, run a pre-commit hook that executes core unit tests. A simple script can prevent pushing code that is known to be broken: npm test && git push or a more robust pre-push hook.

    2. Maintain a Single Source Repository

    A foundational pillar of Continuous Integration is consolidating all project assets into a single source repository, often called a monorepo. This practice dictates that all source code, configuration files (Jenkinsfile, .gitlab-ci.yml), build scripts (pom.xml, package.json), database schemas, and IaC definitions (main.tf) reside in one centralized version control system. This creates a single, authoritative source of truth, ensuring that every developer, build agent, and deployment pipeline works from the identical, up-to-date codebase.

    Maintain a Single Source Repository

    This centralized approach simplifies dependency management and streamlines the build process. When the application, its tests, and its build scripts are all versioned together, a single git clone command is all that’s needed to create a complete, buildable development environment. This is one of the most critical best practices for continuous integration because it provides the consistency and visibility required for a reliable, automated pipeline.

    Why This Is a Foundational CI Practice

    A single repository provides unparalleled atomic commit capabilities across multiple services or components. Refactoring an API? The changes to the server and all its clients can be committed in a single transaction, ensuring they are tested and deployed together. This eliminates the complex orchestration and risk of version mismatches common in multi-repo setups. Tech giants like Google with its Piper system and Microsoft's massive Git repository for Windows have demonstrated that this model can scale effectively, providing unified visibility and simplifying large-scale code changes.

    "Your CI system needs a single point of entry to build everything. If your code, tests, and scripts are scattered, you don't have a single source of truth; you have a recipe for disaster."

    Actionable Implementation Tips

    • Version Everything: Store not just source code but also infrastructure-as-code scripts (Terraform, Ansible), build configurations (e.g., Jenkinsfile), and database migration scripts (e.g., using Flyway or Liquibase) in the repository.
    • Adopt Monorepo Tooling: For large-scale projects, use specialized tools like Nx, Turborepo, or Bazel to manage dependencies and enable efficient, partial builds and tests based on changed paths. These tools prevent the CI from rebuilding and retesting the entire monorepo on every commit.
    • Standardize Branching Strategy: Implement a clear, consistent branching strategy like GitHub Flow (feature branches off main) and protect the main branch with rules requiring pull request reviews and passing status checks before merging.
    • Choose a Distributed VCS: Use a modern Distributed Version Control System (DVCS) like Git. Its powerful branching and merging capabilities are essential for managing contributions in a centralized repository.

    3. Automate the Build Process

    The cornerstone of any CI system is a fully automated, one-step build process. This means the entire sequence—from fetching dependencies and compiling source code to running static analysis and packaging the application into a Docker image or JAR file—should be executable with a single, scriptable command. Automation eradicates inconsistencies and human error inherent in manual builds, ensuring every single commit is built and validated in exactly the same way.

    Automate the Build Process

    This practice is non-negotiable for achieving true Continuous Integration because it makes the build process reliable, repeatable, and fast. When builds are automated, they can be triggered automatically by a webhook from your Git provider upon every git push, providing immediate feedback on integration health. This systematic approach is one of the most critical best practices for continuous integration, turning the build from a manual chore into a seamless, background process.

    Why This Is a Foundational CI Practice

    An automated build transforms the development pipeline into a predictable, self-verifying system. It serves as the first line of defense, catching syntax errors, dependency issues, and compilation failures moments after they are introduced. Tech giants like Netflix and Amazon rely on sophisticated, fully automated build infrastructures to handle thousands of builds daily, enabling their engineers to iterate quickly and with confidence. This level of automation is essential for managing complexity and maintaining velocity at scale.

    "A build that cannot be run from a single command is not a real build. It's just a set of instructions somebody has to follow, and people are terrible at following instructions."

    Actionable Implementation Tips

    • Select the Right Build Tools: Use declarative build automation tools appropriate for your technology stack, such as Maven or Gradle for Java, MSBuild for .NET, or npm scripts with Webpack/Vite for JavaScript applications.
    • Implement Build Caching: Speed up subsequent builds dramatically by caching dependencies and unchanged build outputs. In a Docker-based build, structure your Dockerfile to leverage layer caching effectively by placing frequently changed commands (like COPY . .) as late as possible.
    • Parallelize Build Steps: Identify independent tasks in your build script (like running unit tests and linting) and configure your CI server (e.g., using parallel stages in a Jenkinsfile or parallel jobs in GitLab CI) to execute them concurrently.
    • Integrate Quality Gates: Embed static code analysis (SonarQube, Checkstyle), security scans (Snyk, Trivy), and code formatters (Prettier, Spotless) directly into the automated build script to enforce standards and fail the build if thresholds are not met.

    4. Make Your Build Self-Testing

    A core tenet of Continuous Integration is that a build must validate its own correctness. This is achieved by embedding a comprehensive, automated test suite directly into the build process. Every time new code is integrated, the CI pipeline automatically executes a series of tests, such as unit, integration, and component tests. If any single test fails, the CI server must return a non-zero exit code, which marks the entire build as broken and prevents the flawed artifact from being stored or deployed.

    Make Your Build Self-Testing

    This automated validation is one of the most critical best practices for continuous integration because it provides immediate, objective feedback on the health of the codebase. Instead of relying on manual QA cycles days later, developers know within minutes if their change introduced a regression. This instant feedback loop dramatically reduces the cost of fixing bugs. The value of this automation is a clear example of workflow automation benefits in modern software development.

    Why This Is a Foundational CI Practice

    A self-testing build acts as an automated contract that enforces quality standards with every commit. It ensures that no matter how small the change, it adheres to the established expectations of functionality and stability. This prevents the gradual erosion of code quality, a common problem in large, fast-moving projects. Companies like Etsy, which runs over 40,000 tests on every commit, rely on this practice to deploy code multiple times a day with high confidence. It codifies quality and makes it a non-negotiable part of the development workflow.

    "The build is the ultimate arbiter of truth. If the tests don't pass, the code is broken. Period."

    Actionable Implementation Tips

    • Implement the Test Pyramid: Structure your test suite with a large base of fast, in-memory unit tests (JUnit, Jest), a smaller layer of integration tests that verify interactions between components, and a minimal number of slow end-to-end UI tests (Cypress, Playwright).
    • Utilize Parallel Test Execution: Configure your test runner (mvn -T 4 for Maven, or Jest's --maxWorkers flag) to execute tests in parallel. For larger suites, use CI features to shard tests across multiple build agents.
    • Set Code Coverage Thresholds: Enforce a minimum code coverage percentage (e.g., 80%) using tools like JaCoCo or Istanbul. Configure your CI pipeline to fail the build if a commit causes coverage to drop below this threshold.
    • Use Test Containers: Leverage libraries like Testcontainers to programmatically spin up ephemeral Docker containers for dependencies (e.g., PostgreSQL, Redis) during your integration tests, ensuring a clean, consistent, and production-like test environment.

    5. Everyone Commits to Mainline Every Day

    This principle takes the concept of frequent commits a step further by establishing a team-wide discipline: every developer integrates their work into the shared mainline branch (e.g., main or trunk) at least once per day. This approach, a cornerstone of Trunk-Based Development, is designed to eliminate long-lived feature branches, which are a primary source of integration friction, complex merges, and delayed feedback. It ensures that the integration process is truly continuous.

    This daily commit cadence forces developers to break down work into extremely small, manageable pieces that can be completed and integrated within a single workday. It is one of the most impactful best practices for continuous integration because it maximizes collaboration and keeps the entire team synchronized with the latest codebase. When everyone's changes are integrated daily, the main branch always represents the current, collective state of the project, making it easier to build, test, and release on demand.

    Why This Is a Foundational CI Practice

    Committing to the mainline daily drastically reduces the time and complexity of merging code. The longer a branch lives in isolation, the more it diverges from the mainline, leading to painful merge conflicts and regression bugs. By enforcing a daily integration rhythm, teams prevent this divergence entirely. This model has been battle-tested at an immense scale by tech giants like Google and Meta, where thousands of engineers successfully contribute to a single monorepo daily. It creates an environment of shared ownership and collective responsibility for the health of the main branch.

    "If a branch lives for more than a few hours, it is a fossil. The value of your work is tied to its integration with everyone else's."

    Actionable Implementation Tips

    • Implement Branch by Abstraction: For large-scale refactoring, use the Branch by Abstraction pattern. Introduce a new implementation behind an interface, migrate callers incrementally via a series of small commits, and then remove the old implementation—all without a long-lived branch.
    • Use Feature Flags for Incomplete Work: This is the most critical enabler for this practice. Merge unfinished features into the mainline, but keep them hidden from users behind a runtime configuration flag. This decouples integration from release.
    • Keep Feature Branches Ephemeral: If feature branches are used, they should exist for less than a day before being merged. A git merge --squash can be used to combine the small, incremental commits on the branch into a single, logical commit on the mainline.
    • Establish a Team Agreement: Ensure the entire team understands and commits to this practice. Set up tooling like a Git pre-push hook that warns developers if their branch is too far behind main, encouraging them to rebase frequently (git pull --rebase origin main).

    6. Fix Broken Builds Immediately

    A core discipline in any mature CI environment is treating a broken build as a "stop-the-line" event. The moment the main branch fails to build or pass its essential tests, fixing it must become the absolute highest priority for the entire development team. No new features should be worked on, and no pull requests should be merged until the build is green again. This practice ensures the central codebase remains stable and always in a potentially releasable state.

    This principle preserves the trust and value of the CI pipeline itself. If builds are frequently broken, developers lose confidence in the feedback loop, and the mainline ceases to be a reliable source of truth. Adhering to this rule is one of the most critical best practices for continuous integration because it reinforces accountability and maintains the integrity of the development process, preventing the accumulation of technical debt.

    Why This Is a Foundational CI Practice

    Inspired by the "Andon Cord" from the Toyota Production System, this practice prevents a single error from cascading into a system-wide failure. A broken build blocks all other developers from integrating their work, creating a significant bottleneck. By addressing the break immediately, the team minimizes downtime and ensures the integration pipeline remains open. Atlassian and Spotify use sophisticated notification systems and rotating "Build Police" roles to ensure the person who broke the build, or a designated expert, fixes it within minutes.

    "A broken build is like a stop sign for the entire team. You don't ignore it and drive through; you stop, fix the problem, and then proceed. It’s a non-negotiable part of maintaining flow."

    Actionable Implementation Tips

    • Implement Build Radiators: Set up large, visible monitors in the office or a shared digital dashboard (e.g., using Grafana) displaying the real-time status of the build pipeline. A glaring red screen is a powerful, unambiguous signal that demands immediate attention.
    • Establish a 'Sheriff' or 'Build Master' Role: Create a rotating role responsible for monitoring the build. This person is the first responder, tasked with either fixing the break, reverting the offending commit, or coordinating the fix with the committer.
    • Configure Instantaneous Alerts: Your CI server should immediately notify the team via a dedicated, high-signal channel like a #ci-alerts Slack channel, Microsoft Teams, or PagerDuty the moment a build fails. The notification should include a direct link to the failed build log and identify the commit hash and author.
    • Consider Automated Rollbacks: Configure your CI pipeline to automatically git revert the offending commit from the mainline if the build fails. This instantly restores a green build while the problematic code is fixed offline on a separate branch. This approach is a key indicator of a highly mature process, as highlighted in various DevOps maturity assessment models.

    7. Keep the Build Fast

    The primary goal of a CI pipeline is to provide rapid feedback. If developers have to wait an hour to find out if their commit broke the build, the feedback loop is broken, and productivity plummets. A fast build process, ideally completing in under ten minutes, is essential for maintaining a high-frequency commit cadence. When builds are quick, developers are encouraged to commit more often, receive immediate validation, and can address issues while the context is still fresh.

    Slow builds act as a bottleneck, discouraging integration and creating a drag on the entire development lifecycle. This practice is one of the most critical best practices for continuous integration because the speed of the build directly dictates the speed of the development team. A fast build is not a luxury; it is a fundamental requirement for achieving agility.

    Why This Is a Foundational CI Practice

    A build time of under ten minutes is a widely accepted industry benchmark. This target ensures that developers can get feedback within a single "focus block," preventing context switching. Slow builds lead developers to batch larger changes to avoid the long wait, which reintroduces the very integration risks CI was designed to prevent. Companies like Shopify have famously documented their journey of reducing build times from over an hour to just a few minutes, directly correlating the improvement to increased developer productivity and deployment frequency.

    "A slow build is a broken build. The value of CI diminishes exponentially as the feedback loop time increases. Aim for a coffee-break build, not a lunch-break build."

    Actionable Implementation Tips

    • Profile Your Build: Use build profilers (e.g., Gradle's --scan or mvn -Dprofile). Analyze the output to identify exactly which tasks, plugins, or tests are consuming the most time. Use this data to target your optimization efforts.
    • Implement Parallel Test Execution: Configure your test runner to execute tests in parallel. For CI, use features like GitLab's parallel keyword or CircleCI's test splitting to distribute your test suite across multiple, containerized build agents.
    • Utilize Caching Aggressively: Leverage dependency caching (e.g., .m2/, node_modules/), build layer caching in Docker, and incremental builds. Tools like Google's Bazel or Nx are built around advanced caching to ensure only affected projects are rebuilt.
    • Optimize Hardware & Infrastructure: Run your CI agents on powerful hardware with fast SSDs and ample RAM. Use ephemeral, auto-scaling runners on cloud platforms (e.g., GitHub Actions hosted runners, AWS EC2 Spot Instances) to provide elastic compute capacity that matches your workload.

    8. Test in a Clone of the Production Environment

    A CI pipeline's reliability is only as good as the environment in which it runs tests. If the testing environment diverges significantly from production, you create a breeding ground for "it works on my machine" syndromes. The goal is to eliminate environmental variables as a source of bugs by ensuring your testing environment is a high-fidelity replica of production, from the operating system and dependency versions to network configurations and security policies.

    This practice ensures that tests are run against the same constraints and infrastructure characteristics that the application will encounter live. Adopting this approach is one of the most critical best practices for continuous integration because it provides the highest possible confidence that code proven to work in the pipeline will behave predictably after deployment. It transforms testing from a theoretical exercise into a realistic dress rehearsal.

    Why This Is a Foundational CI Practice

    Testing in a production-like environment directly mitigates the risk of environment-specific defects, which are notoriously difficult to debug post-deployment. Issues related to mismatched library versions, subtle OS differences, or IAM permission errors can be caught and resolved early. Companies like Airbnb and Salesforce rely on this principle, using containerization and sophisticated environment management to replicate their complex production stacks, ensuring that what passes CI has a high probability of succeeding in the real world.

    "Your Continuous Integration tests are a promise to the business. Testing in a production clone ensures that promise is based on reality, not on a loosely related development environment."

    Actionable Implementation Tips

    • Use Infrastructure as Code (IaC): Employ tools like Terraform, CloudFormation, or Pulumi to define both your production and testing environments from the same version-controlled codebase. Use different variable files (.tfvars) for each environment but reuse the same modules to prevent configuration drift.
    • Implement Containerization: Package your application and its dependencies into containers using Docker and define your multi-service application stack using Docker Compose. This creates a portable, consistent runtime environment that can be deployed identically across all environments.
    • Automate Environment Provisioning: Integrate dynamic environment creation into your CI/CD pipeline. For each pull request, use your IaC scripts to spin up a fresh, ephemeral "review app" environment for testing and destroy it automatically upon merging to control costs.
    • Monitor for Environment Drift: Implement automated checks that periodically run a terraform plan or use configuration management tools to compare the deployed state of your testing/staging environment against its IaC definition and alert the team when discrepancies are detected.

    Continuous Integration Best Practices Comparison

    Practice Implementation Complexity Resource Requirements Expected Outcomes Ideal Use Cases Key Advantages
    Commit Code Frequently Moderate (requires discipline) Low to Moderate (tools + culture) Reduced merge conflicts, faster feedback Fast-paced development, Agile teams Minimizes integration hell, faster feature delivery
    Maintain a Single Source Repository Moderate to High (infrastructure + maintenance) High (storage, backup, tools) Single source of truth, version consistency Collaborative large teams, mono/micro repos Eliminates version confusion, enables collaboration
    Automate the Build Process High (setup and scripting) Moderate to High (build servers) Consistent, error-free builds Multi-language projects, continuous integration Eliminates manual errors, speeds up builds
    Make Your Build Self-Testing High (test suite maintenance) Moderate to High (test infrastructure) Early bug detection, high code quality Critical quality assurance, CI/CD pipelines Prevents regressions, builds confidence
    Everyone Commits to Mainline Every Day Moderate (team discipline) Low to Moderate Reduced integration complexity, continuous integration Teams practicing trunk-based development Minimizes merge conflicts, supports continuous deployment
    Fix Broken Builds Immediately Moderate (team discipline + notifications) Low to Moderate (monitoring tools) Stable main branch, quick issue resolution High-reliability projects, DevOps teams Maintains releasable codebase, reduces debugging time
    Keep the Build Fast High (optimization and tooling) Moderate to High (infrastructure) Rapid feedback, frequent commits Large teams, rapid development cycles Improves productivity, reduces context switching
    Test in a Clone of the Production Environment High (environment setup & management) High (infrastructure and data) Fewer production bugs, realistic testing Complex, large-scale systems, critical apps Catches environment-specific bugs, increases reliability

    From Best practices to Business Impact

    Implementing a robust continuous integration pipeline is not merely a technical checkbox; it is a fundamental cultural and operational shift. The eight core principles we've explored, from frequently committing code to a single source repository to ensuring fast, self-testing builds, collectively create a powerful engine for software delivery. Each practice builds upon the others, forming a cohesive system that minimizes risk, maximizes developer velocity, and enhances code quality.

    The journey begins with discipline. Encouraging daily commits to the mainline, fixing broken builds immediately, and keeping the build fast are not just suggestions, they are the non-negotiable pillars of a high-performing CI culture. When your team internalizes these habits, the feedback loop tightens dramatically. Developers can integrate and validate changes in minutes, not days, preventing the painful, complex merges that plague slower-moving teams. This rapid validation cycle is the cornerstone of agile development and a prerequisite for true continuous delivery.

    Turning Technical Excellence into Strategic Advantage

    Adopting these best practices for continuous integration is about more than just shipping code faster. It's about building a more resilient, predictable, and responsive engineering organization. When you can trust that every commit to main is production-ready, you de-risk the entire development process. Testing in a clone of the production environment ensures that what works in the pipeline will work for your users, eliminating last-minute surprises and costly deployment failures.

    This level of automation and reliability directly translates into significant business value. It frees up your most skilled engineers from manual testing and deployment tasks, allowing them to focus on innovation and feature development. The strategic adoption of CI can unlock significant competitive advantages, mirroring the broader discussion on key business process automation benefits seen across other organizational functions. Ultimately, a mature CI process reduces your time-to-market, allowing you to respond to customer needs and market changes with unparalleled speed and confidence. This is the ultimate goal: transforming technical best practices into a tangible, sustainable business impact.


    Ready to elevate your CI/CD pipeline from a simple tool to a strategic asset? The expert freelance platform engineers and SREs at OpsMoon specialize in designing, building, and optimizing elite DevOps workflows tailored to your business needs. Learn more at OpsMoon and connect with the talent that can accelerate your DevOps maturity.

  • A Technical Guide to Kubernetes Consulting Services

    A Technical Guide to Kubernetes Consulting Services

    When you hear "Kubernetes consulting," what comes to mind? Is it a glorified help desk for when your pods enter a CrashLoopBackOff state? The reality is much deeper. Think of it as a strategic partnership that brings in the expert architectural design, heavy-lifting engineering, and operational wisdom you need to succeed with cloud-native infrastructure.

    These services exist to bridge the massive skills gap that most organizations face, turning Kubernetes from a complex beast into a genuine business advantage—a platform for reliable, scalable application delivery.

    What Exactly is a Kubernetes Consulting Service?

    Let's use a technical analogy. Imagine you're building a distributed system from scratch. You wouldn't just provision VMs and hope for the best. You'd bring in a specialized systems architect and a team of Site Reliability Engineers (SREs).

    In this world, Kubernetes consulting services are your architects and master builders. They don't just patch security vulnerabilities (CVEs); they design the entire cloud-native foundation, map out the complex systems like the CNI plugin and CSI drivers (networking and storage), and ensure the whole structure is secure, efficient, and ready to scale horizontally.

    This isn't your typical IT support contract. It's a focused engagement to build a resilient, automated platform that your developers can trust and build upon. The entire point is to make Kubernetes a launchpad for innovation, not an operational headache that consumes all your engineering resources.

    More Than Just a Help Desk: It's a Partnership

    One of the biggest misconceptions is seeing consultants as just an outsourced support team. A real consulting partnership is far more integrated and strategic. It’s all about building long-term capability within your team and ensuring your Kubernetes investment delivers on its promise of velocity and reliability.

    So, what does that look like in practice?

    • A Strategic Blueprint: A good consultant starts by understanding your business goals and existing application architecture. They'll create a cloud-native adoption roadmap that lays out every technical step, from choosing a CNI plugin to implementing a GitOps workflow for production deployments.
    • Rock-Solid Engineering: They build a production-grade Kubernetes foundation from the ground up. This means getting the tricky parts right from day one—networking with Calico or Cilium, persistent storage via CSI drivers, and multi-AZ control plane security. This proactive approach saves you from the painful misconfigurations that cause instability and security holes later on.
    • Automation at the Core: Their work is centered on building robust automation. We're talking slick CI/CD pipelines defined in code, Infrastructure as Code (IaC) using Terraform for provisioning, and comprehensive monitoring with a Prometheus/Grafana stack. The goal is to eliminate manual toil and let your team ship code faster.

    This focus on strategy and automation is a huge reason why the market is exploding. The entire Kubernetes ecosystem is projected to jump from USD 2.57 billion in 2025 to USD 7.07 billion by 2030. That's a massive shift, and you can explore more data on this growth trajectory to see how consulting is fueling this adoption.

    The official Kubernetes project homepage itself talks about the platform being planet-scale, future-proof, and portable. Expert consultants are the ones who help translate those big ideas into your production reality. They make sure your setup actually lives up to the hype.

    Breaking Down Core Technical Capabilities

    Image

    High-level promises are one thing, but the real value of kubernetes consulting services is in the deep technical work. These aren't just advisors who hand you a PowerPoint deck; they're hands-on engineers who build, secure, and fine-tune the complex machinery of your cloud-native platform.

    Let's pull back the curtain and look at the specific, tangible skills you should expect from a top-tier partner. This is where theory is replaced by practice. A consultant’s job is to translate your business goals into a production-ready, resilient, and efficient Kubernetes environment. That means getting their hands dirty with everything from architectural blueprints to long-term cost management.

    Designing a Multi-Stage Adoption Roadmap

    Jumping into Kubernetes headfirst is a recipe for disaster. A successful journey requires a carefully planned, multi-stage roadmap that aligns technical milestones with business objectives. An expert consultant won't just start building—they'll start by assessing your current infrastructure, your applications' architecture (e.g., monolith vs. microservices), and your team's existing skill set.

    From there, they'll architect a phased adoption plan. This isn't just a document; it's a technical blueprint for success.

    • Phase 1: Proof of Concept (PoC): First, you validate the core architecture. They'll deploy a non-critical, stateless application to a test cluster to validate the CNI, ingress controller, and logging/monitoring stack. This builds confidence and surfaces early-stage "gotchas."
    • Phase 2: Initial Production Workloads: Next, you migrate low-risk but meaningful applications, including a stateful service, to a production-grade cluster. This is where you establish initial monitoring dashboards, alerting rules, and runbooks for incident response.
    • Phase 3: Scaled Adoption: Finally, you start onboarding complex, business-critical services. At this stage, the focus shifts to hardening security with NetworkPolicies and PodSecurityStandards, refining CI/CD pipelines for zero-downtime deployments, and optimizing resource requests and limits.

    This phased approach prevents the "big bang" failures that so often derail ambitious platform engineering projects. It ensures your team builds skills and institutional knowledge incrementally. A lot of this work involves optimizing deployments across various cloud computing services.

    Engineering a Production-Ready Cluster

    Building a Kubernetes cluster that can handle production traffic is a highly specialized skill. It goes way beyond running a simple kubeadm init command. Consultants bring the hard-won experience needed to engineer a resilient, secure, and performant foundation from day one.

    This foundational work touches on several critical domains:

    • Networking Configuration: This means implementing a robust Container Network Interface (CNI) like Calico for its powerful NetworkPolicies or Cilium for eBPF-based performance and observability. It also includes setting up proper network policies to control ingress and egress traffic between pods—your first and most important line of defense.
    • Storage Integration: They'll configure persistent storage solutions using Container Storage Interface (CSI) drivers for your specific cloud provider (e.g., AWS EBS CSI driver). This ensures your stateful apps, like databases, have reliable, high-performance storage that can be provisioned dynamically.
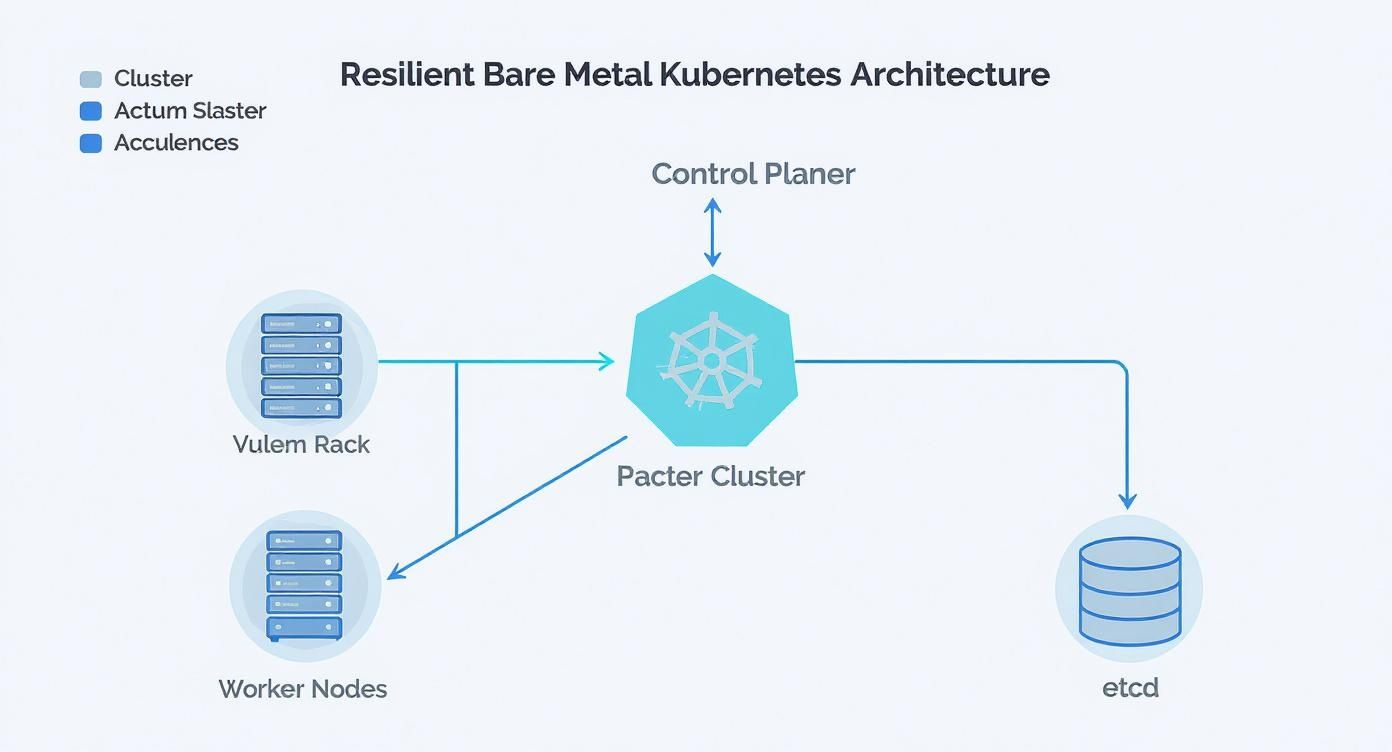
    • High Availability (HA) Architecture: This involves designing a multi-master control plane (at least 3 nodes) and spreading worker nodes across multiple availability zones. This engineering work prevents single points of failure and keeps your cluster's API server responsive even if a cloud provider's AZ experiences an outage.

    A production-ready cluster isn't defined by its ability to run kubectl get pods. It's defined by its ability to recover from failure, defend against threats, and scale predictably under load. Getting this right is the core engineering challenge.

    Integrating GitOps for Declarative CI/CD

    Modern software delivery is about automation and consistency. Consultants will help you implement GitOps workflows, which use Git as the single source of truth for everything—both your application code and your infrastructure configuration. This is a massive shift from imperative, script-based deployment methods.

    Using tools like Argo CD or Flux, they create a fully declarative CI/CD pipeline that works something like this:

    1. A developer pushes a container image tag change or a new Kubernetes manifest to a Git repository.
    2. The GitOps controller running inside the cluster constantly watches the repository and detects the change.
    3. The controller automatically compares the desired state (what's in Git) with the actual state of the cluster and applies any changes needed to make them match using the Kubernetes API.

    This workflow gives you a perfect audit trail (git log), makes rollbacks as simple as a git revert, and dramatically cuts down on the risk of human error from manual kubectl apply commands. It empowers your development teams to ship code faster and with more confidence. For teams looking to bring in this level of expertise, exploring a complete list of Kubernetes services can provide a clear path forward.

    Hardening Security and Implementing FinOps

    Security and cost control can't be afterthoughts. They have to be baked into your platform from the very beginning. A good Kubernetes consulting service brings deep expertise in both of these critical areas.

    On the security front, consultants implement a defense-in-depth strategy. This includes using admission controllers like OPA/Gatekeeper to enforce policies before a pod is even created and integrating security scanners like Trivy or Grype directly into the CI/CD pipeline to catch vulnerabilities early.

    At the same time, they introduce FinOps (Cloud Financial Operations) practices to keep your cloud bill from spiraling out of control. This isn't just about watching the budget; it's a technical discipline that involves:

    • Implementing Resource Quotas and Limits: Setting precise CPU and memory requests and limits for all workloads to prevent resource contention and waste.
    • Right-Sizing Nodes: Analyzing workload patterns with tools like the Vertical Pod Autoscaler (VPA) to pick the most cost-effective virtual machine instances for your cluster nodes.
    • Cost Monitoring and Allocation: Using tools like Kubecost or OpenCost to get a granular view of how much each team, application, or namespace is costing. This makes chargebacks and showbacks a reality.

    The table below breaks down these core technical offerings and the real-world business value they deliver.

    Core Kubernetes Consulting Service Offerings

    Service Category Key Activities & Technical Focus Business Impact
    Strategic Roadmap & Architecture Platform assessment, phased adoption planning, PoC development, cloud provider selection, and overall system design. Aligns technical investment with business goals, reduces adoption risk, and ensures a scalable, future-proof foundation.
    Production Cluster Engineering High-availability setup, CNI/CSI integration, control plane hardening, ingress controller configuration, and node provisioning. Creates a stable, resilient, and performant platform that minimizes downtime and can handle production-level traffic from day one.
    CI/CD & GitOps Integration Building declarative pipelines with tools like Argo CD/Flux, integrating automated testing, and establishing Git as the single source of truth. Increases deployment speed and frequency, reduces manual errors, improves system reliability, and provides a full audit trail for changes.
    Security & Compliance Implementing network policies, RBAC, pod security standards, secret management (e.g., Vault), and integrating vulnerability scanning into pipelines. Strengthens security posture, protects sensitive data, helps meet compliance requirements (like SOC 2 or HIPAA), and reduces attack surface.
    Observability & Monitoring Deploying Prometheus/Grafana stack, setting up logging with Fluentd/Loki, implementing distributed tracing with Jaeger, and creating actionable alerts. Provides deep visibility into system health and performance, enabling proactive problem detection and faster incident resolution.
    FinOps & Cost Optimization Implementing cost monitoring tools (Kubecost), right-sizing nodes and workloads, setting resource quotas, and using spot instances with autoscalers. Prevents cloud spend overruns, provides granular cost visibility for chargebacks, and maximizes the ROI of your cloud infrastructure.

    Ultimately, these technical capabilities are the building blocks of a successful cloud-native platform. They represent the difference between a Kubernetes project that struggles to get off the ground and one that becomes a true business enabler.

    Comparing Kubernetes Engagement Models

    Picking the right partnership model is as important as the technology itself. When you start looking for kubernetes consulting services, you're not just buying an expert's time; you're establishing a relationship. The engagement model shapes how work is executed, how knowledge is transferred, and the ultimate success of the initiative.

    You'll encounter a few common models: project-based work, staff augmentation, and fully managed services. Each is designed for a different business need, team structure, and strategic objective. Let’s get into the technical specifics of each so you can determine the best fit.

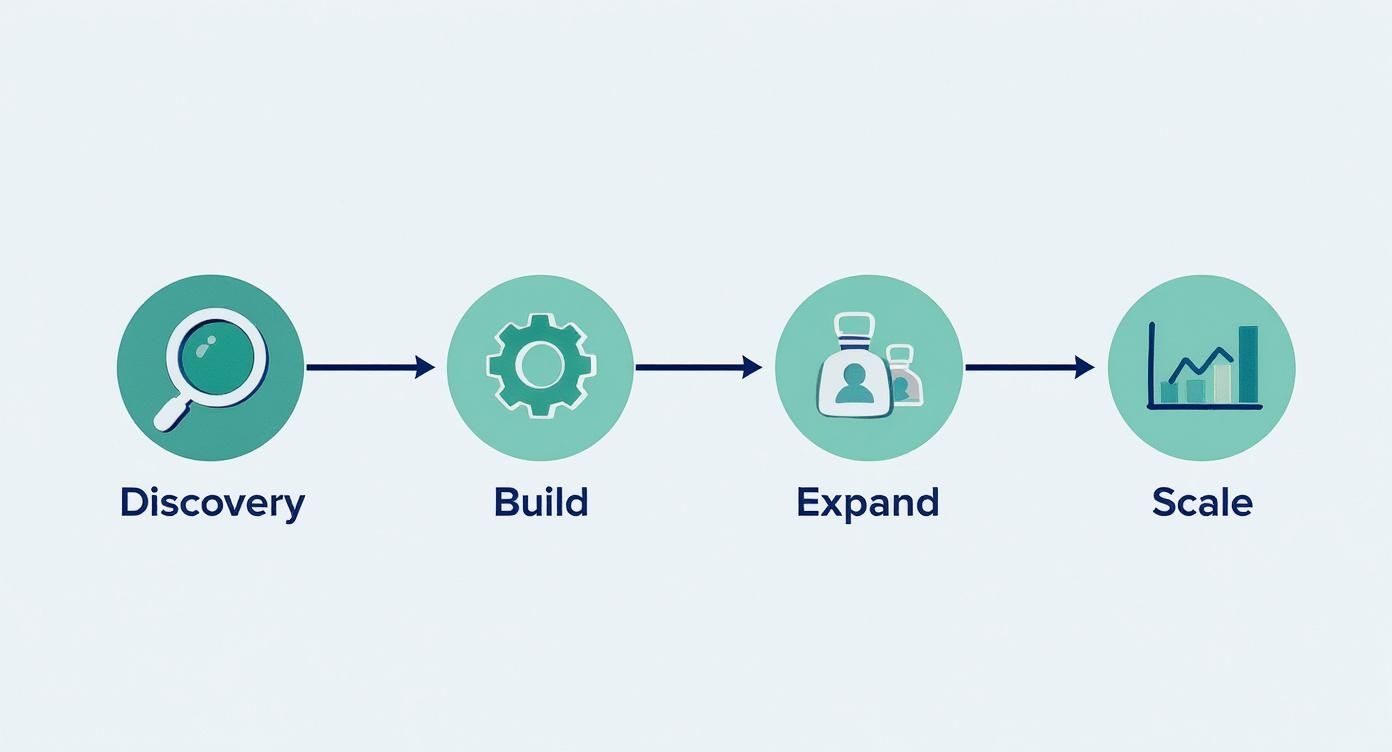
    This infographic lays out what you can typically get from these different models, from sketching out your initial architecture and migrating apps over to handling the day-to-day grind of operations.

    Image

    As you can see, whether you need a blueprint, hands-on migration support, or someone to manage the entire platform long-term, there's a service model designed for it.

    Project-Based Engagements

    A Project-Based Engagement is ideal when you have a specific, well-defined goal with a clear start and end. Think of it like contracting a firm to build and deliver a CI/CD pipeline. You agree on the design, timeline, and deliverables before work begins.

    The consultant takes complete ownership of delivering that outcome, managing the project from start to finish.

    • Ideal Use Case: Building a new Kubernetes platform from scratch, migrating a critical legacy application from VMs to containers, or conducting a security audit against the CIS Kubernetes Benchmark.
    • Technical Execution: The consulting firm assigns a dedicated team, often with a project manager and engineers, who execute against a detailed Statement of Work (SOW). Your team provides initial requirements, participates in regular technical reviews, and performs user acceptance testing (UAT).
    • Knowledge Transfer: This typically occurs at the project's conclusion through comprehensive documentation (e.g., architecture diagrams, runbooks) and formal handover sessions. It's structured but less organic than other models.

    The primary advantage here is predictability in scope, cost, and timeline. The downside is reduced flexibility if requirements change mid-project.

    Staff Augmentation

    With Staff Augmentation, you embed one or more expert consultants directly into your engineering team. They don’t work in a silo; they participate in your daily stand-ups, contribute to your sprints, and report to your engineering managers just like any other team member.

    This model is perfect when you need to accelerate a project or fill a specific skill gap immediately—like bringing in a security specialist for a quarter or a networking expert to resolve a complex CNI issue.

    This model isn't about outsourcing a task; it's about insourcing expertise. The real goal is to amplify your team's capabilities and accelerate your roadmap by leveraging specialized skills you lack in-house.

    The key benefit is continuous, organic knowledge sharing. Your engineers learn advanced techniques and best practices by working shoulder-to-shoulder with the experts every day. This model is also highly flexible—you can scale the consultant's involvement up or down as project needs evolve.

    Managed Services

    Finally, the Managed Services model is for organizations that want to completely offload the operational burden of running a Kubernetes platform. Instead of building and maintaining it yourself, you entrust a partner to guarantee its uptime, security, and performance, all backed by a Service Level Agreement (SLA).

    This is the "you build the apps, we'll handle the platform" approach. Your team focuses 100% on application development, knowing that the underlying infrastructure is professionally managed 24/7. This service covers everything from patching kubelet versions and responding to PagerDuty alerts to performance tuning and capacity planning. As Kubernetes becomes more common in fields like finance and healthcare, expert firms are key for managing these complex operations. You can learn more about the growth in the expanding Kubernetes solutions market and its trajectory.

    To make the choice clearer, here’s a side-by-side look.

    Engagement Model Comparison

    Criteria Project-Based Staff Augmentation Managed Services
    Ideal For Defined projects with clear start/end dates (e.g., platform build) Accelerating internal teams and filling skill gaps Outsourcing platform operations and focusing on applications
    Cost Structure Fixed price or time & materials for a specific scope Hourly or daily rate for embedded experts Monthly recurring fee, often tiered by cluster size or usage
    Knowledge Transfer Formal; occurs at project completion via documentation Continuous; organic learning through daily collaboration Minimal by design; focuses on operational offloading
    Control Level High on outcome, low on day-to-day execution High; consultants are integrated into your team structure Low on infrastructure, high on application development

    Ultimately, selecting the right model is a strategic decision that must align with your team's current capabilities, budget, and business objectives. For a deeper dive into how we put these models into practice, check out our overview of expert Kubernetes consulting.

    Translating Technical Work Into Business Value

    The most technically elegant Kubernetes platform is meaningless if it doesn't positively impact the business. While your engineers are rightly focused on pod eviction rates, API latency, and security patches, the C-suite is asking a different question: "What's our ROI on this platform?"

    A sharp kubernetes consulting services provider acts as the translator, bridging the gap between complex technical execution and the business outcomes leaders care about. It's about connecting the dots from an engineer's kubectl command to tangible financial results.

    Accelerating Feature Delivery and Innovation

    In a competitive market, speed is a key differentiator. A major goal of any Kubernetes engagement is to reduce the lead time for changes—the time from a git commit to code running in production. Consultants achieve this by building highly efficient, automated CI/CD pipelines.

    Consider a team stuck with manual deployments that require a multi-page checklist and a weekend maintenance window. They might deploy new features once a month. A consultant can redesign the entire workflow using GitOps principles with tools like Argo CD, enabling multiple, low-risk deployments per day.

    This isn't just a tech upgrade; it's a strategic weapon. A 10x increase in deployment frequency lets you test ideas faster, react to customer feedback instantly, and out-innovate competitors who are still stuck in the slow lane.

    Enhancing System Reliability and Reducing Toil

    Every minute of downtime costs money and erodes customer trust. Consultants enhance reliability by implementing robust observability stacks and proactive incident response plans. This marks a fundamental shift from reactive firefighting to a preventative, SRE-driven approach.

    Here’s how they execute this:

    • Defining Service Level Objectives (SLOs): They work with you to set clear, measurable targets for system performance (e.g., "99.95% of API requests should complete in under 200ms").
    • Automating Alerting: Smart alerts are configured in Prometheus's Alertmanager to flag potential issues before they breach an SLO and cause a full-blown outage.
    • Reducing Operational Toil: Routine, manual tasks like node scaling or certificate rotation are automated. Instead of spending their days on repetitive work, your engineers can focus on feature development.

    Even cutting down toil by just 15-20% can free up thousands of engineering hours over a year—time that gets funneled directly back into innovation.

    Mitigating Risk and Hardening Security

    A single security breach can be catastrophic, leading to financial losses, reputational damage, and regulatory fines. Kubernetes consultants implement a defense-in-depth strategy that significantly reduces this risk.

    This goes far beyond basic security scans. It involves implementing advanced measures like NetworkPolicy resources to isolate services, admission controllers that automatically block non-compliant workloads, and vulnerability scanning integrated directly into the CI/CD pipeline. This proactive hardening turns your platform into a much more resilient environment.

    The business value is clear: preventing the average data breach, which can cost millions.

    Optimizing Cloud Spend with FinOps

    Without rigorous oversight, cloud costs can spiral out of control. A significant value-add from consultants is implementing FinOps—a practice that brings financial accountability to the variable spend model of the cloud.

    Consultants use specialized tools to gain granular visibility into resource consumption, quickly identifying waste from oversized nodes or idle workloads. They then implement technical guardrails, like ResourceQuotas and Horizontal Pod Autoscalers (HPAs), to ensure you’re only paying for what you need.

    It’s not uncommon for a focused FinOps engagement to uncover 20-30% in potential cloud cost savings within the first few months.

    And it doesn't stop at the infrastructure level. The best partners also help teams adopt modern workflows, incorporating things like AI-powered productivity tools to make everyone more efficient. By tying every technical decision back to a quantifiable business result, consultants build an undeniable case for investing in a world-class Kubernetes platform.

    How To Select The Right Consulting Partner

    Image

    Selecting a partner for your Kubernetes journey is one of the most critical technical decisions you'll make. The right choice accelerates adoption, hardens your infrastructure, and upskills your entire team.

    The wrong choice can lead to costly architectural mistakes, security vulnerabilities, and a platform that creates more operational toil than it solves.

    This isn't about finding another vendor. It's about finding a true partner who understands your engineering culture and business objectives. A proper evaluation requires a deep, technical vetting process to ensure they have the real-world expertise to deliver.

    Assess Deep Technical Expertise

    First and foremost: raw technical skill. Kubernetes is a vast ecosystem, and superficial knowledge is insufficient when mission-critical services are at stake. You need a team with proven, deep-seated expertise.

    Industry certifications provide a baseline of knowledge.

    • Certified Kubernetes Administrator (CKA): This certifies an engineer has the skills for the day-to-day administration of a Kubernetes cluster. This should be considered table stakes for any hands-on consultant.
    • Certified Kubernetes Security Specialist (CKS): This advanced certification demonstrates expertise in securing container-based applications and the Kubernetes platform itself. If security is a top priority, this is a key indicator of capability.

    But don't stop at certifications. Scrutinize their experience with your specific tech stack. Have they delivered projects on your chosen cloud provider (AWS, GCP, Azure)? Do they have production experience implementing the same service mesh you’re considering, like Istio or Linkerd? Their direct experience in your kind of environment is a huge predictor of success.

    Evaluate Methodologies and Philosophies

    How a consulting firm works is just as important as what they know. Any modern kubernetes consulting services provider should be experts in methodologies that emphasize automation, consistency, and collaboration. Their commitment to effective project management principles ensures they’ll deliver on time and on budget.

    Here’s what to look for:

    • Infrastructure as Code (IaC): They must be experts in tools like Terraform or Pulumi. Ask to see how they structure their code and manage state for complex environments. All infrastructure should be defined declaratively in version control, not created manually via a UI.
    • GitOps: This is non-negotiable for modern CI/CD. The partner must be able to explain exactly how they use tools like Argo CD or Flux to make Git the single source of truth for all cluster state. This is fundamental to achieving auditable, visible, and revertible changes.

    A partner’s commitment to IaC and GitOps isn't just a technical preference; it's a cultural one. It signals a dedication to building repeatable, scalable, and resilient systems that minimize human error and empower your development teams.

    This focus on best practices has to extend to security. The global market for Kubernetes security is projected to hit nearly USD 10.7 billion by 2031, which shows how seriously the industry is taking container security risks. A potential partner's security posture is absolutely paramount.

    Ask Targeted Technical Questions

    The interview is your opportunity to move beyond slide decks and evaluate their real-world problem-solving skills. Come prepared with a list of targeted, open-ended technical questions that reveal their architectural reasoning and hands-on experience.

    Here are a few powerful questions to get you started:

    1. Scenario Design: "Describe how you would design a multi-tenant cluster for three separate internal teams. How would you enforce strict security and resource boundaries between them using native Kubernetes constructs like namespaces, resource quotas, and network policies?"
    2. Troubleshooting: "A developer reports their application is experiencing intermittent high latency, but only in the production cluster. Walk me through your step-by-step diagnostic process, from kubectl commands to checking Prometheus metrics."
    3. Security Hardening: "We need to ensure no container in our cluster ever runs as the root user. How would you enforce this policy across all namespaces automatically using a policy engine like OPA/Gatekeeper or Kyverno?"
    4. Cost Optimization: "Our staging cluster's cloud bill is significantly higher than expected. What tools and strategies would you use to identify the primary cost drivers and implement optimizations?"

    The quality of their answers—the specific tools they mention (e.g., ksniff, pprof), the trade-offs they consider, and the clarity of their explanation—will tell you everything you need to know about their real capabilities. Choosing the right partner is a massive investment in your platform's future, so putting in the time for a thorough, technical evaluation is worth every minute.

    Here are some of the technical questions that pop up most often when engineering teams start talking to Kubernetes consultants. We'll get straight to the point and give you clear, practical answers so you know what to expect.

    How Do Consultants Handle Our Existing Infrastructure and Tooling?

    A major concern for teams is that a consultant will demand a complete overhaul of their existing tools. A good partner works with your current setup, not against it.

    The first step is a discovery phase to understand your existing CI/CD pipelines, monitoring stack, and IaC tooling. The goal is to integrate and improve, not to rip and replace for the sake of it.

    If your team is already skilled with Jenkins and Terraform, for instance, they'll build on that foundation. They might introduce best practices like version-controlled Jenkins Pipelines (Jenkinsfile) or structured Terraform modules for reusability, but it's an evolution, not a disruptive overhaul.

    What Is the Process for Migrating a Legacy Application to Kubernetes?

    Migrating a monolithic application from on-premises servers to Kubernetes is a complex operation. Simply containerizing it ("lift-and-shift") often fails to realize the benefits of the platform. Consultants typically follow a structured approach to determine the best migration path.

    The process generally breaks down into these technical steps:

    1. Assessment: They analyze the application's architecture, dependencies, and state management. This determines whether a simple "rehost" is feasible or if a more involved "refactor" is needed to break it into smaller, cloud-native services.
    2. Containerization: The application and its dependencies are packaged into Docker images. A multi-stage Dockerfile is created to produce a minimal, secure runtime image.
    3. Manifest Creation: They author the Kubernetes manifests—YAML files for Deployments, Services, ConfigMaps, and PersistentVolumeClaims. This is where critical configurations like liveness/readiness probes, resource requests/limits, and security contexts are defined.
    4. CI/CD Integration: The new containerized workflow is integrated into the CI/CD pipeline. This automates the build, test, and deployment process, ensuring consistent promotion through environments (dev, staging, prod).

    This methodical approach minimizes risk and ensures the application is configured to be resilient and scalable in its new environment.

    How Is Security Handled During and After the Engagement?

    Security is not a final step; it's integrated throughout the entire process. Any competent consultant will adopt a "shift-left" security philosophy, building security controls in from the beginning.

    The core idea is to build security into the platform's DNA, not just bolt it on at the end. This means automating security checks, enforcing strict policies, and designing a multi-layered defense that protects your workloads from development all the way to production.

    This defense-in-depth strategy includes several technical layers:

    • Infrastructure Hardening: This means configuring the underlying cloud infrastructure and Kubernetes components (like the API server and etcd) to meet industry standards like the CIS benchmarks.
    • Workload Security: They'll implement Pod Security Standards and use admission controllers to automatically block insecure configurations, such as containers attempting to run as the root user or mount sensitive host paths.
    • Network Segmentation: Using NetworkPolicy resources, they create a zero-trust network by default. Pods can only communicate with other services if explicitly allowed, limiting the blast radius of a potential compromise.
    • Supply Chain Security: Image scanners like Trivy are integrated directly into the CI/CD pipeline. This catches known vulnerabilities (CVEs) in your container images before they are ever deployed to the cluster.

    By the time the engagement concludes, your team receives not just a secure platform but also the knowledge and tools to maintain that security posture. For a deeper dive, check out our guide on Kubernetes security best practices.

    What Does Knowledge Transfer and Team Upskilling Look Like?

    The ultimate goal of a great consulting partnership is to make themselves redundant. This is achieved through a deliberate, continuous knowledge transfer process designed to upskill your internal team.

    This is not a single handover meeting. It’s an ongoing effort that includes:

    • Paired Engineering Sessions: Your engineers work side-by-side with the consultants, solving real technical problems and learning by doing. This is the most effective way to transfer practical skills.
    • Comprehensive Documentation: While everything is documented as code (IaC, GitOps manifests), this is supplemented with clear architectural diagrams, decision records, and operational runbooks.
    • Architectural Reviews: Regular sessions where consultants explain the "why" behind their technical choices. This provides your team with the deep context needed to operate, troubleshoot, and evolve the platform independently.

    When the engagement is over, your team doesn't just hold the keys to a new platform. They have the deep institutional knowledge and confidence to truly own it.


    We've covered some of the most common questions that come up, but every situation is unique. To help clear up a few more, here's a quick FAQ table.

    Frequently Asked Questions About Kubernetes Consulting

    Question Detailed Answer
    What's the typical duration of an engagement? It varies widely based on scope. A small project like a cluster audit might take 2-4 weeks. A full platform build or a large-scale migration could take anywhere from 3-9 months. The key is defining clear milestones and goals from the start.
    Do consultants need full access to our systems? Consultants need enough access to do their job, but it's always based on the principle of least privilege. They'll work with your security team to get role-based access control (RBAC) permissions that are scoped only to the necessary resources and environments.
    How do we measure the ROI of consulting? ROI is measured against the business goals you set. This could be faster deployment frequency (DORA metrics), reduced infrastructure costs through optimization, improved system uptime (SLOs), or fewer security incidents. Good consultants help you define and track these metrics.
    Can you help with just one part of our stack, like CI/CD? Absolutely. Engagements can be highly focused. Many teams bring in experts specifically to modernize their CI/CD pipelines for Kubernetes, set up observability with tools like Prometheus, or harden their security posture. You don't have to sign up for a massive overhaul.

    Hopefully, these answers give you a clearer picture of what a technical partnership looks like in practice. The right consultant becomes an extension of your team, focused on building both a great platform and your team's ability to run it.


    Ready to transform your cloud native strategy with expert guidance? At OpsMoon, we connect you with the top 0.7% of DevOps talent to build, secure, and optimize your Kubernetes environment. Schedule your free work planning session today and let's map out your path to success.

  • Top 10 Best Cloud Cost Optimization Tools for 2025

    Top 10 Best Cloud Cost Optimization Tools for 2025

    Navigating the complexities of cloud billing is a critical challenge for modern DevOps and finance teams. Unchecked, cloud spend can quickly spiral out of control, eroding margins and hindering innovation. The solution lies in moving from reactive cost analysis in spreadsheets to proactive, automated optimization. This requires a robust FinOps culture supported by the right technology. To truly master cloud spend, it's essential to not only leverage the right FinOps toolkit but also implement powerful cloud cost optimization strategies.

    This guide dives deep into the 12 best cloud cost optimization tools available today, moving beyond marketing claims to provide a technical, actionable analysis. We cut through the noise to deliver an in-depth resource tailored for CTOs, platform engineers, and DevOps leaders who need to make informed decisions. We'll explore native cloud provider tools, specialized third-party platforms, and Kubernetes-focused solutions, examining their core architectures, implementation nuances, and specific use cases.

    Inside this comprehensive review, you will find:

    • Detailed profiles of each tool, complete with screenshots and direct links.
    • Technical breakdowns of key features, from cost allocation models to automated rightsizing.
    • Practical use cases showing how to apply each tool to specific engineering challenges.
    • Honest assessments of limitations and potential implementation hurdles.

    Our goal is to help you select the precise solution that aligns with your technical stack, team structure, and business objectives. We'll show you how to build a cost-efficient, high-performance cloud infrastructure by choosing the right platform for your unique needs.

    1. AWS Marketplace – Cloud cost management solutions hub

    The AWS Marketplace isn't a single tool but rather a centralized procurement hub where you can discover, trial, and deploy a wide array of third-party cloud cost optimization tools. Its primary value proposition is streamlining vendor management and billing. Instead of juggling multiple contracts and invoices, you can subscribe to various solutions and have all charges consolidated directly into your existing AWS bill. This is particularly effective for teams already deeply embedded in the AWS ecosystem.

    AWS Marketplace – Cloud cost management solutions hub

    This platform simplifies the technical and financial overhead of adopting new software. For engineering leaders, this means faster access to tooling, as procurement can often be handled via private offers within the Marketplace, leveraging pre-approved AWS spending commitments. This approach significantly reduces the friction of onboarding a new vendor, making it one of the best cloud cost optimization tools for organizations seeking operational efficiency.

    Key Considerations

    • Procurement Model: The ability to use AWS credits or Enterprise Discount Program (EDP) commitments to purchase third-party software is a major draw.
    • Vendor Selection: While extensive, the catalog naturally favors tools with strong AWS integrations. You may find fewer options for multi-cloud or non-AWS-specific solutions.
    • User Experience: The interface provides standardized listings, making it easy to compare features and initiate trials. However, detailed pricing often requires requesting a private offer directly from the vendor.
    Feature Analysis
    Centralized Billing Consolidates software costs into your AWS invoice, simplifying accounting and budget tracking.
    Private Offers Enables negotiation of custom pricing and terms directly with vendors, fulfilled through AWS.
    Simplified Deployment Many listings offer one-click deployment via CloudFormation templates, accelerating implementation.

    Practical Tip: Before committing, use the free trial option available for many tools. This allows you to evaluate a solution's real-world impact on your infrastructure without financial risk. Integrating these platforms is a key part of holistic cloud infrastructure management services that focus on both performance and cost.

    Website: aws.amazon.com/marketplace

    2. AWS Cost Explorer

    AWS Cost Explorer is the native, no-extra-license tool integrated directly into the AWS Management Console for visualizing, understanding, and managing your AWS costs and usage. It serves as the foundational layer for cost analysis within the AWS ecosystem, providing default reports and customizable views with daily or monthly granularity. Its main advantage is its seamless integration, offering immediate insights without the need for third-party subscriptions or complex setup.

    AWS Cost Explorer

    For engineering teams and CTOs, Cost Explorer is the first stop for identifying spending trends, forecasting future expenses, and detecting anomalies. You can filter and group data using tags, accounts, or services to pinpoint which resources are driving costs. While it provides a solid baseline, advanced analysis often requires combining its data with other tools. For instance, teams frequently build more sophisticated dashboards by programmatically extracting raw billing data from AWS to feed into external business intelligence platforms.

    Key Considerations

    • Accessibility: As a native tool, it’s available to all AWS customers without a separate subscription, making it a zero-friction starting point for cost management.
    • Data Granularity: While daily and monthly views are free, enabling hourly and resource-level granularity incurs a small fee, which is crucial for detailed performance-to-cost analysis.
    • Automation Limitations: The tool is primarily for visualization and exploration. Implementing automated cost-saving actions based on its findings typically requires custom development using the AWS SDK or third-party solutions.
    Feature Analysis
    Cost Visualization Offers pre-configured and custom reports to track spending trends, helping identify unexpected cost spikes.
    Forecasting Engine Predicts future costs based on historical usage patterns, aiding in budget planning and financial modeling.
    Filtering & Grouping Allows deep dives into cost data by filtering by service, linked account, region, or cost allocation tags.

    Practical Tip: Leverage cost allocation tags from day one. By tagging resources with identifiers like project, team, or environment, you can use Cost Explorer to generate highly specific reports that attribute spending directly to business units, which is essential for accurate chargebacks and accountability.

    Website: aws.amazon.com/aws-cost-management/aws-cost-explorer/

    3. Microsoft Azure Cost Management + Billing

    As Microsoft's native FinOps suite, Azure Cost Management + Billing is the foundational tool for organizations operating primarily on the Azure cloud. It provides a comprehensive set of capabilities for monitoring, controlling, and optimizing Azure spending directly within the portal. Its greatest strength lies in its seamless integration with the Azure ecosystem, offering granular visibility into consumption data and robust governance features without requiring any third-party licenses.

    The platform is designed for enterprise-grade control, enabling engineering leaders to set budgets with proactive alerts, detect spending anomalies, and allocate costs precisely using tag inheritance and shared cost-splitting rules. For deep, customized analysis, its integration with Power BI allows teams to build sophisticated dashboards and reports, making it one of the best cloud cost optimization tools for data-driven financial governance within an Azure-centric environment.

    Key Considerations

    • Native Integration: Being a first-party service, it offers unparalleled access to Azure billing data and resource metadata, with no extra licensing fees.
    • Multi-Cloud Limitations: While it has some capabilities to ingest AWS cost data, its most powerful features for optimization and governance are exclusive to Azure resources.
    • Data Latency: Cost data is refreshed periodically throughout the day, not in real-time, which can introduce a slight delay in detecting immediate spending spikes.
    Feature Analysis
    Budget & Anomaly Alerts Set spending thresholds and receive automated notifications for unexpected cost increases or overruns.
    Cost Allocation Use powerful rules to split shared costs and distribute expenses accurately across teams or projects.
    Power BI Integration Connects directly to a rich dataset for creating custom, interactive financial reports and dashboards.

    Practical Tip: Leverage the automated export feature to schedule regular data dumps into an Azure Storage account. This creates a historical cost dataset that you can query directly or feed into other business intelligence tools for long-term trend analysis beyond the portal's default retention periods.

    Website: learn.microsoft.com/azure/cost-management-billing/costs/overview-cost-management

    4. Google Cloud cost management stack (Budgets/Alerts + Recommender)

    Google Cloud’s native cost management stack offers a powerful, built-in suite of tools for teams operating primarily within the GCP ecosystem. It combines proactive budget setting and alerting with intelligent, automated recommendations to curb unnecessary spending. This integrated approach allows engineering leaders to enforce financial governance directly within the platform where resources are consumed, making it a foundational element of any GCP-centric cost optimization strategy.

    Google Cloud cost management stack (Budgets/Alerts + Recommender)

    The core components, Cloud Billing Budgets and the Recommender API, work together to provide both manual control and machine-learning-driven insights. Budgets can be configured to trigger notifications at specific spending thresholds, and more advanced users can automate actions-like disabling billing or throttling resources-using Pub/Sub notifications. This makes Google's native offering one of the best cloud cost optimization tools for organizations that value deep platform integration and automated responses without third-party licensing costs.

    Key Considerations

    • Platform Integration: As a native solution, these tools are deeply woven into the GCP console, providing context-aware recommendations and seamless access to cost data.
    • Automation Hooks: The use of Pub/Sub topics for budget alerts enables sophisticated, event-driven automation, such as triggering Cloud Functions to resize instances or shut down non-critical projects.
    • Scope Limitations: The entire stack is inherently GCP-specific. Teams with multi-cloud or hybrid environments will need a separate, overarching tool for a complete financial overview.
    Feature Analysis
    Budgets & Alerts Set granular budgets by project, service, or label, with programmatic alerts via email and Pub/Sub.
    Recommender API Provides AI-driven suggestions for rightsizing VMs, deleting idle resources, and purchasing commitments.
    Cost Analysis Reports Visualize spending trends with detailed, customizable reports that can be exported to BigQuery for deeper analysis.

    Practical Tip: Leverage the Recommender API to automatically identify and act on optimization opportunities. You can script the process of applying rightsizing recommendations to development environments during off-peak hours, ensuring you capture savings without manual intervention.

    Website: cloud.google.com/billing

    5. CloudZero

    CloudZero positions itself as a cost intelligence platform, moving beyond simple spend monitoring to map cloud costs directly to business metrics. Its core strength lies in translating complex infrastructure spend into understandable unit costs, such as cost-per-customer or cost-per-feature. This approach empowers engineering and finance teams to collaborate effectively by tying technical decisions directly to business value and profitability.

    CloudZero

    This platform is particularly powerful for SaaS companies where understanding tenant-level profitability is critical. By aggregating data from AWS, PaaS providers like Snowflake, and Kubernetes, CloudZero provides a holistic view of the COGS for specific product features. For engineering leaders, this shifts the conversation from "How much are we spending?" to "What is the ROI on our spend?", making it one of the best cloud cost optimization tools for organizations focused on unit economics.

    Key Considerations

    • Business-Centric Metrics: The focus on unit costs (e.g., cost per tenant, per API call) provides actionable data for pricing, engineering, and product strategy.
    • Tagging Dependency: Achieving maximum value from the platform requires a mature and consistent resource tagging strategy across your infrastructure.
    • Pricing Model: Pricing often scales with your cloud spend, especially when purchased via the AWS Marketplace, which can be a significant factor for large-scale operations.
    Feature Analysis
    Unit Cost Telemetry Maps costs to specific business units, enabling precise COGS analysis for SaaS products.
    Anomaly Detection Proactively alerts teams to unexpected cost spikes, allowing for rapid investigation and remediation.
    Shared Cost Allocation Intelligently distributes shared infrastructure and Kubernetes costs to the appropriate teams or features.

    Practical Tip: Start by focusing on a single, high-value product or feature to map its unit cost. This provides a tangible win and a clear blueprint for expanding cost intelligence across your entire organization. This level of detail is a cornerstone of advanced cloud cost optimization strategies aimed at improving gross margins.

    Website: https://www.cloudzero.com/

    6. Harness Cloud Cost Management

    Harness Cloud Cost Management is a FinOps platform designed to drive automated savings through intelligent resource management. Its core strength lies in its ability to automatically shut down idle non-production resources, a feature it calls AutoStopping. This directly targets a major source of wasted cloud spend in development and testing environments, making it a powerful tool for engineering teams focused on efficiency.

    Harness Cloud Cost Management

    The platform extends its automation capabilities to commitment orchestration for AWS Savings Plans and Reserved Instances, ensuring that you maximize discounts without manual analysis. For teams heavily invested in containerization, Harness provides deep visibility into Kubernetes costs, offering granular breakdowns and rightsizing recommendations. This focus on automation makes it one of the best cloud cost optimization tools for organizations with dynamic, ephemeral infrastructure.

    Key Considerations

    • Automation Focus: The AutoStopping feature is a key differentiator, providing immediate and tangible savings on ephemeral resources that are often overlooked.
    • Pricing Model: Harness offers transparent, spend-based pricing tiers, which can be procured directly or through the AWS Marketplace for consolidated billing.
    • Implementation: Achieving full functionality for features like AutoStopping requires deploying a Harness agent and configuring appropriate permissions within your cloud environment.
    Feature Analysis
    AutoStopping Automatically detects and shuts down idle resources like VMs and Kubernetes clusters, saving costs on non-production workloads.
    Commitment Orchestration Maximizes the utilization of Savings Plans and RIs by automating purchasing and management based on usage patterns.
    Kubernetes Cost Visibility Provides detailed cost allocation for containers, pods, and namespaces, enabling precise chargebacks and rightsizing.

    Practical Tip: Start by implementing AutoStopping in a single development or staging environment to quantify its impact. This provides a clear business case for a broader rollout. Integrating such automated tools is a sign of a mature DevOps culture, which you can evaluate with a DevOps maturity assessment.

    Website: www.harness.io/

    7. Apptio Cloudability

    Apptio Cloudability is an enterprise-grade FinOps platform, now part of IBM, designed for large organizations navigating complex multi-cloud environments. Its core strength lies in providing granular cost visibility, allocation, and forecasting, enabling mature financial governance. The platform ingests and normalizes billing data from AWS, Azure, and GCP, translating arcane cloud bills into clear, business-centric financial reports. This makes it a powerful tool for finance and IT leaders aiming to implement robust showback and chargeback models.

    Unlike tools focused purely on engineering-led optimization, Cloudability bridges the gap between finance, IT, and engineering. Its integration with Turbonomic allows it to connect cost data with performance metrics, offering resource optimization actions grounded in both financial impact and application health. For large enterprises, this dual focus makes it one of the best cloud cost optimization tools for establishing a holistic, data-driven FinOps practice that aligns technology spending with business value.

    Key Considerations

    • Target Audience: Geared towards large enterprises with dedicated FinOps teams or mature cloud financial management processes.
    • Implementation: Requires a significant setup effort to configure business mappings, reporting structures, and integrations. This is not a plug-and-play solution.
    • Pricing Model: Typically sold via custom enterprise contracts, making it less accessible for small to medium-sized businesses.
    Feature Analysis
    Advanced Reporting Delivers highly customizable dashboards for showback/chargeback, breaking down costs by team, product, or cost center.
    Container Cost Insights Provides detailed visibility into Kubernetes costs, allocating shared cluster expenses back to specific teams or applications.
    Financial Planning Robust forecasting and budgeting modules allow teams to plan cloud spend accurately and track variance against targets.

    Practical Tip: Leverage Cloudability's Business Mapping feature early in the implementation. By defining custom dimensions based on your organization's tagging strategy, you can create reports that directly align cloud costs with specific business units or projects, making the data instantly actionable for non-technical stakeholders.

    Website: www.apptio.com/products/cloudability/

    8. Flexera One – Cloud Cost Optimization

    Flexera One is an enterprise-grade, multi-cloud management platform that excels in providing deep governance and financial controls. It moves beyond simple cost visibility to offer a robust policy-driven approach to cloud financial management. For organizations managing complex, multi-cloud environments, Flexera One provides the guardrails needed to enforce budget adherence, detect anomalies, and implement chargeback models, making it one of the best cloud cost optimization tools for mature cloud operations.

    Flexera One – Cloud Cost Optimization

    The platform is particularly well-suited for Managed Service Providers (MSPs) and large enterprises that require granular control and automation. Its ability to manage billing across different clouds and provide detailed cost allocation helps finance and engineering teams align on spending. A unique feature is the integration with Greenpixie, which provides tangible sustainability insights by translating cloud usage into CO2e emissions data, a growing priority for many businesses.

    Key Considerations

    • Pricing Model: Flexera One operates on a contract-based pricing model, which can represent a significant investment. It is available directly or through the AWS Marketplace, offering flexible procurement options.
    • Target Audience: The extensive feature set is designed for large-scale operations and may be overly complex for smaller teams or startups with straightforward cloud footprints.
    • Governance Focus: Its primary strength lies in its extensive library of over 90 cost policies, which automate the detection and remediation of wasteful spending patterns.
    Feature Analysis
    Policy-Driven Automation Leverages 90+ pre-built policies to automatically identify cost-saving opportunities and anomalies.
    Multi-Cloud Governance Provides a single pane of glass for cost allocation, budgeting, and chargeback across AWS, Azure, and GCP.
    Sustainability Reporting Integrated Greenpixie data offers CO2e emissions tracking to help achieve corporate green initiatives.

    Practical Tip: Leverage the platform's budgeting and forecasting tools to set proactive alerts. Configure notifications to be sent to specific team Slack channels or email distribution lists when a project's spending forecast exceeds its budget, enabling rapid intervention before costs escalate.

    Website: www.flexera.com/products/flexera-one/cloud-cost-optimization

    9. Spot by NetApp

    Spot by NetApp delivers a powerful automation suite engineered to dramatically reduce compute costs by intelligently managing cloud infrastructure. It excels at automating the use of spot instances, Reserved Instances (RIs), and Savings Plans, ensuring you get the lowest possible price for your workloads without sacrificing performance or availability. For engineering leaders, Spot abstracts away the complexity of managing diverse pricing models, making it one of the best cloud cost optimization tools for achieving hands-off savings.

    Spot by NetApp

    The platform's flagship products, like Ocean for Kubernetes and Elastigroup for other workloads, provide predictive autoscaling and fallbacks to on-demand instances when spot capacity is unavailable. This proactive approach allows teams to confidently run production and mission-critical applications on spot instances, a task that is often too risky to manage manually. The system continuously analyzes your usage patterns and automates the buying and selling of RIs and Savings Plans to maximize your commitment coverage.

    Key Considerations

    • Automation Focus: Spot is designed for teams that prefer to automate cost management rather than perform manual analysis and tuning. It requires granting significant permissions to your cloud account to execute its automated actions.
    • Pricing Model: Its pricing is typically based on a percentage of the savings it generates or a charge per vCPU-hour. This can be complex to forecast but directly ties the tool's cost to its value.
    • Technical Integration: The tool integrates deeply into your environment, especially with Kubernetes via Ocean, to manage pod scheduling and node scaling for optimal cost and performance.
    Feature Analysis
    Spot Instance Automation Predicts interruptions and gracefully migrates workloads to other spot pools or on-demand instances, providing an SLA for availability.
    Commitment Management (Eco) Automates the entire lifecycle of RIs and Savings Plans, including buying, selling, and modification, to maintain high utilization.
    Kubernetes Autoscaling (Ocean) Optimizes container deployments by right-sizing pods and using the most cost-effective mix of spot, reserved, and on-demand nodes.

    Practical Tip: Start by deploying Spot's Elastigroup on a non-production, stateless workload. This allows you to safely evaluate its spot instance management capabilities and quantify the potential savings before rolling it out to more critical systems.

    Website: spot.io

    10. CAST AI

    CAST AI is an automation platform designed specifically for Kubernetes cost optimization, offering a powerful suite of tools that work across AWS, GCP, and Azure. Its core function is to analyze Kubernetes workloads in real time and automatically adjust the underlying compute resources to match demand precisely. This is achieved through a combination of intelligent instance selection, rightsizing of pod requests, and advanced scheduling that ensures maximum resource utilization.

    CAST AI

    For engineering teams running EKS, GKE, or AKS, CAST AI delivers immediate value by automating complex cost-saving strategies that are difficult to implement manually. Its algorithms continuously rebalance workloads onto the most cost-effective Spot, On-Demand, or Reserved Instances without compromising availability. This makes it one of the best cloud cost optimization tools for organizations that have heavily invested in containerization and are looking to drive down their cloud spend without manual intervention.

    Key Considerations

    • Kubernetes Focus: The platform is purpose-built for Kubernetes, providing deep, container-aware optimization that generic tools often lack. It is not suitable for non-containerized workloads.
    • Automation Level: It goes beyond recommendations by actively managing cluster capacity, automatically provisioning and de-provisioning nodes as needed.
    • Pricing Transparency: CAST AI offers a clear, publicly available pricing model, including a free tier for cost monitoring and a savings-based model for its automation features, which aligns its success with the customer's.
    Feature Analysis
    Autonomous Rightsizing Continuously analyzes pod resource requests and adjusts them to eliminate waste and prevent throttling.
    Spot Instance Automation Manages Spot Instance lifecycle, including interruption handling and fallback to On-Demand, to maximize savings.
    Intelligent Bin-Packing Optimizes pod scheduling to pack workloads onto the fewest nodes possible, reducing idle capacity.

    Practical Tip: Start with the free read-only agent to get a detailed savings report. This report analyzes your current cluster configuration and provides a precise estimate of potential savings, offering a data-driven business case before you enable any automated optimization features.

    Website: cast.ai/pricing

    11. ProsperOps

    ProsperOps provides an autonomous cloud cost optimization service focused specifically on managing AWS Savings Plans and Reserved Instances (RIs). The platform automates the complex process of analyzing compute usage and executing commitment purchases to maximize savings without requiring manual intervention. Its core value is shifting the burden of commitment management from FinOps teams to an automated, algorithm-driven system that continuously optimizes discount instruments.

    ProsperOps

    This tool is one of the best cloud cost optimization tools for teams that want a "set it and forget it" solution for their AWS compute spend. Rather than merely providing recommendations, ProsperOps executes the strategy on your behalf, dynamically adjusting commitments as your usage patterns change. Its unique pay-for-performance model, where it takes a percentage of the actual savings it generates, directly aligns its success with your financial outcomes.

    Key Considerations

    • Automation Level: The service is fully autonomous after initial setup, handling all aspects of commitment portfolio management, including buying, selling, and converting RIs.
    • Pricing Model: The outcomes-based pricing (a percentage of savings) eliminates upfront costs and ensures you only pay for tangible results.
    • Focus Area: Its specialization is its strength and limitation. It excels at compute commitment optimization but does not address other cost areas like storage, data transfer, or idle resource management.
    Feature Analysis
    Autonomous Management Continuously blends and optimizes Savings Plans and RIs to maintain high coverage and savings rates with zero manual effort.
    Risk-Aware Strategies Uses algorithms to manage commitment terms, effectively de-risking long-term lock-in by managing a dynamic portfolio of instruments.
    Savings Analytics Provides clear FinOps reporting that tracks Effective Savings Rate (ESR) and demonstrates the value generated by the service.

    Practical Tip: Before onboarding, use your AWS Cost Explorer to understand your baseline compute usage and current Savings Plan/RI coverage. This will help you accurately evaluate the net savings ProsperOps delivers on top of your existing efforts and quantify its ROI.

    Website: https://prosperops.com/

    12. Kubecost

    Kubecost is an open-core cost monitoring and optimization solution built specifically for Kubernetes environments. It provides engineering teams with granular visibility into containerized spending, breaking down costs by namespace, deployment, service, label, and even individual pods. This level of detail empowers developers and platform engineers to understand the financial impact of their architectural decisions directly within their native workflows. It stands out by accurately allocating shared and out-of-cluster resources back to the correct teams.

    The platform is designed for self-hosting, giving organizations full control over their cost data, a crucial factor for security-conscious teams. Kubecost translates complex cloud bills from AWS, GCP, and Azure into a clear, Kubernetes-centric context, making it one of the best cloud cost optimization tools for organizations scaling their container strategy. Its actionable recommendations for rightsizing cluster nodes and workloads help prevent overprovisioning before it impacts the bottom line.

    Key Considerations

    • Deployment Model: Can be installed directly into your Kubernetes cluster in minutes with a simple Helm chart. The core data remains within your infrastructure.
    • Target Environment: Its strength lies entirely within Kubernetes. Organizations with significant non-containerized workloads will need a separate tool to gain a complete cost overview.
    • Pricing: A powerful free and open-source tier provides core cost allocation. Paid plans unlock advanced features like long-term metric retention, SAML/SSO integration, and enterprise-grade support.
    Feature Analysis
    Granular Cost Allocation Breaks down K8s costs by any native concept like namespace, pod, or label for precise showback and chargeback.
    Rightsizing Recommendations Actively analyzes workload utilization to suggest changes to container requests and limits, reducing waste.
    Multi-Cloud and On-Prem Ingests billing data from major cloud providers and supports on-premise clusters for a unified view of all Kubernetes spending.

    Practical Tip: Start with the free, open-source version to establish a baseline of your Kubernetes spending. Use its cost allocation reports to identify your most expensive namespaces and workloads, creating an immediate, data-driven priority list for optimization efforts.

    Website: www.kubecost.com

    Cloud Cost Optimization Tools Comparison

    Solution Core Features User Experience / Quality Value Proposition Target Audience Price & Licensing
    AWS Marketplace – Cloud cost management solutions hub Centralized catalog, procurement, billing Simplifies vendor management, easy trials One-stop-shop for AWS-aligned tools US-based enterprises Vendor-dependent pricing, private offers
    AWS Cost Explorer Cost visualization, forecasting, API access Native AWS tool, no extra subscription Baseline tool with deep AWS billing integration AWS users No separate license, small API fees
    Microsoft Azure Cost Management + Billing Budgets, anomaly alerts, Power BI integration Enterprise-grade reporting, strong governance Built-in Azure FinOps suite Azure users Included with Azure account
    Google Cloud cost management stack Budgets, alerts, recommender insights No extra cost, integrated recommendations Native GCP spend optimization Google Cloud users Free with GCP account
    CloudZero Cost per customer/feature telemetry Product-level insights, AWS Marketplace purchases SaaS economics focus SaaS and product teams Pricing scales with AWS spend
    Harness Cloud Cost Management AutoStopping, commitment orchestration, Kubernetes Automates savings, transparent Marketplace pricing Automated savings for complex environments AWS/Kubernetes users Transparent tier pricing via Marketplace
    Apptio Cloudability Advanced reporting, chargeback, forecasting Robust enterprise controls Enterprise-grade FinOps Large enterprises Enterprise pricing, custom contracts
    Flexera One – Cloud Cost Optimization Cost policies, anomaly detection, sustainability Broad enterprise governance Multi-cloud optimization and governance Enterprises, MSPs Contract-based pricing
    Spot by NetApp Automated RI/Savings Plans management, autoscaling Hands-off compute savings Strong compute cost automation Automation-focused teams Savings share or vCPU-hour pricing
    CAST AI Kubernetes rightsizing, Spot automation, real-time Transparent pricing, free monitoring tier Kubernetes cost automation Kubernetes users Public pricing with free tier
    ProsperOps Savings Plans and RI optimization Outcomes-based pricing, minimal management Optimizes AWS compute commitments AWS users focused on savings Pay-for-performance based on savings
    Kubecost Kubernetes cost allocation, savings, budgets/alerts Free tier, self-hosted and SaaS options Popular K8s cost management Kubernetes operators Free tier, paid enterprise subscriptions

    Integrating FinOps Tools into Your DevOps Workflow

    The journey through the landscape of the best cloud cost optimization tools reveals a clear truth: there is no single, perfect solution for every organization. Your ideal toolset depends entirely on your specific cloud environment, technical maturity, and organizational structure. From the foundational, native services like AWS Cost Explorer and Google Cloud's cost management stack to sophisticated, AI-driven platforms such as CAST AI and ProsperOps, the options are as diverse as the challenges they aim to solve. The key is not just to select a tool but to build a comprehensive strategy around it.

    A recurring theme across our analysis of platforms like CloudZero, Harness, and Kubecost is the critical need for granular visibility. Abstract, high-level spending reports are no longer sufficient. Modern engineering teams require unit cost economics, allowing them to attribute every dollar of cloud spend to a specific feature, customer, or product line. This level of detail transforms cost from an opaque, top-down metric into a tangible piece of feedback that developers can act upon directly within their workflows.

    From Tool Selection to Strategic Implementation

    Choosing a tool is the starting point, not the finish line. The real challenge lies in weaving cost-awareness into the very fabric of your engineering culture. This process, often called FinOps, is a cultural and operational shift that empowers engineers with the data and autonomy to make cost-conscious decisions. Simply deploying a tool without changing your processes will yield limited results.

    To truly succeed, consider these critical implementation factors:

    • Integration with CI/CD: The most effective cost optimization happens pre-production. Integrate cost estimation and anomaly detection directly into your CI/CD pipelines. Tools that provide this feedback loop, like Harness, can prevent costly architectural decisions from ever reaching production.
    • Defining Ownership and Governance: Who is responsible for acting on cost recommendations? Establish clear ownership at the team or service level. Create automated policies and governance rules to enforce budgets and tag compliance, preventing cost issues before they escalate.
    • Automating Savings: Manual intervention is not a scalable strategy. Leverage the powerful automation capabilities of tools like Spot by NetApp for instance management or ProsperOps for Savings Plan and Reserved Instance optimization. The goal is to create a self-healing, cost-efficient infrastructure that requires minimal human oversight.
    • Kubernetes-Specific Focus: If your workloads are containerized, a generic cloud cost tool will miss critical nuances. Solutions like Kubecost and CAST AI are purpose-built to provide pod-level cost allocation and automated node right-sizing, addressing the unique challenges of managing Kubernetes expenses.

    Making the Right Choice for Your Team

    To navigate this complex decision, start by evaluating your organization's primary pain points.

    • For multi-cloud or complex environments: Platforms like Flexera One or Apptio Cloudability offer robust, enterprise-grade capabilities for managing diverse cloud estates.
    • For engineering-led FinOps cultures: CloudZero and Harness excel at providing the granular, contextualized cost data that developers need to understand the impact of their code.
    • For heavy Kubernetes users: Prioritize specialized tools like CAST AI or Kubecost that offer deep container-level visibility and automated optimization.
    • For maximizing commitment discounts: ProsperOps provides a focused, "set it and forget it" solution for automating Reserved Instances and Savings Plans, delivering predictable savings with minimal effort.

    Ultimately, the goal is to create a symbiotic relationship between your DevOps practices and financial objectives. By embedding cost visibility and optimization directly into the software delivery lifecycle, you transform cloud cost management from a reactive, firefighting exercise into a proactive, strategic advantage. This integrated approach ensures that as you innovate and scale faster, you also do so more efficiently and profitably.


    Navigating the implementation of these powerful tools and fostering a true FinOps culture requires specialized expertise. OpsMoon provides access to the top 0.7% of global DevOps and SRE talent who can help you select, integrate, and manage the best cloud cost optimization tools for your unique needs. Let OpsMoon help you build a cost-efficient, scalable cloud infrastructure today.

  • 7 Actionable Legacy System Modernization Strategies for 2025

    7 Actionable Legacy System Modernization Strategies for 2025

    Legacy systems, once the bedrock of an organization, often become a significant drain on resources, hindering innovation and agility. They accrue technical debt, increase operational costs, and expose businesses to security risks. However, the path forward is not always a complete overhaul. Effective legacy system modernization strategies are not one-size-fits-all; they require a nuanced approach tailored to specific business goals, technical constraints, and risk tolerance.

    This guide provides a deep, technical dive into seven distinct strategies for modernizing your applications and infrastructure. We will analyze the specific implementation steps, technical considerations, pros, cons, and real-world scenarios for each, empowering you to make informed decisions. Moving beyond theoretical concepts, this article offers actionable blueprints you can adapt for your own technology stack.

    You will learn about methods ranging from a simple 'Lift and Shift' (Rehosting) to the incremental 'Strangler Fig' pattern. We will cover:

    • Rehosting
    • Refactoring
    • Replatforming
    • Repurchasing (SaaS)
    • Retiring
    • Retaining
    • The Strangler Fig Pattern

    Our goal is to equip you with the knowledge to build a robust roadmap for your digital transformation journey, ensuring scalability, security, and long-term performance.

    1. Lift and Shift (Rehosting)

    The Lift and Shift strategy, also known as Rehosting, is one of the most direct legacy system modernization strategies available. It involves moving an application from its existing on-premise or legacy hosting environment to a modern infrastructure, typically a public or private cloud, with minimal to no changes to the application's core architecture or code. This approach prioritizes speed and cost-efficiency for the initial migration, essentially running the same system on a new, more capable platform.

    A classic example is GE's massive migration of over 9,000 applications to AWS, where rehosting was a primary strategy to exit data centers quickly and realize immediate infrastructure savings. This allowed them to shut down 30 of their 34 data centers, demonstrating the strategy's power for rapid, large-scale infrastructure transformation.

    When to Use This Approach

    Lift and Shift is ideal when the primary goal is to quickly exit a physical data center due to a lease expiring, a merger, or a desire to reduce infrastructure management overhead. It's also a pragmatic first step for organizations new to the cloud, allowing them to gain operational experience before undertaking more complex modernization efforts like refactoring or rebuilding. If an application is a "black box" with lost source code or specialized knowledge, rehosting may be the only viable option to move it to a more stable environment.

    This infographic summarizes the key characteristics of a rehosting project.

    Infographic showing key data about Lift and Shift (Rehosting)

    As the data shows, the primary benefit is speed and minimal disruption, making it a low-risk entry into cloud adoption.

    Implementation Considerations

    Successful rehosting requires meticulous planning. Before the move, you must conduct thorough dependency mapping to identify all interconnected systems, databases, and network configurations. When considering the 'Lift and Shift' approach, moving existing on-premise systems can be streamlined with a comprehensive data center migration checklist to ensure no critical components are overlooked.

    Key implementation tips include:

    • Utilize Automated Tools: Employ tools like AWS Application Discovery Service, Azure Migrate, or Google Cloud's StratoZone to automatically map servers, dependencies, and performance baselines. Use migration services like AWS Server Migration Service (SMS) or Azure Site Recovery to replicate and move VMs with minimal downtime.
    • Plan for Post-Migration Optimization: Treat rehosting as phase one. Budget and plan for subsequent optimization phases to right-size instances using cloud provider cost explorers and trusted advisor tools. The goal is to move from a static, on-premise capacity model to a dynamic, cloud-based one by implementing auto-scaling groups and load balancers.
    • Implement Robust Testing: Create a detailed testing plan that validates functionality, performance, and security in the new cloud environment before decommissioning the legacy system. This should include integration tests, load testing with tools like JMeter or Gatling to match on-premise performance baselines, and security penetration testing against the new cloud network configuration.

    2. Refactoring (Re-architecting)

    Refactoring, also known as Re-architecting, is one of the more intensive legacy system modernization strategies. It involves significant code restructuring and optimization to align a legacy application with modern, cloud-native principles without altering its external behavior or core business logic. This approach goes beyond a simple migration, aiming to improve non-functional attributes like performance, scalability, and maintainability by fundamentally changing the internal structure of the code.

    A prominent example is Spotify's journey from a monolithic architecture to a microservices model hosted on Google Cloud. This strategic re-architecture allowed their development teams to work independently and deploy features more rapidly, enabling the platform to scale and innovate at a massive pace. The move was crucial for handling their explosive user growth and complex feature set.

    When to Use This Approach

    Refactoring is the best choice when the core business logic of an application is still valuable, but the underlying technology is creating significant bottlenecks, incurring high maintenance costs, or hindering new feature development. This strategy is ideal for mission-critical applications where performance and scalability are paramount. You should consider refactoring when a simple lift and shift won't solve underlying architectural problems, but a full rewrite is too risky or expensive. It allows you to incrementally improve the system while it remains operational.

    This approach is fundamentally about paying down technical debt. Addressing these underlying issues is a key part of successful modernization, and you can learn more about how to manage technical debt to ensure long-term system health.

    Implementation Considerations

    A successful refactoring project requires a deep understanding of the existing codebase and a clear vision for the target architecture. It's a significant engineering effort that demands meticulous planning and execution.

    Key implementation tips include:

    • Start with an Application Assessment: Begin with a thorough code audit and dependency analysis. Use static analysis tools like SonarQube to identify complex, tightly coupled modules ("hotspots") and calculate cyclomatic complexity. This data-driven approach helps prioritize which parts of the monolith to break down first.
    • Adopt an Incremental Strategy: Avoid a "big bang" refactor. Use techniques like the Strangler Fig Pattern to gradually route traffic to new, refactored services. Decouple components by introducing message queues (e.g., RabbitMQ, Kafka) between services instead of direct API calls, de-risking the process and ensuring business continuity.
    • Invest in Comprehensive Testing: Since you are changing the internal code structure, a robust automated testing suite is non-negotiable. Implement a testing pyramid: a strong base of unit tests (using frameworks like JUnit or PyTest), a layer of service integration tests, and a focused set of end-to-end tests to verify that the refactored code maintains functional parity.
    • Integrate DevOps Practices: Use refactoring as an opportunity to introduce or enhance CI/CD pipelines using tools like Jenkins, GitLab CI, or GitHub Actions. Containerize the refactored services with Docker and manage them with an orchestrator like Kubernetes to achieve true deployment automation and scalability.

    3. Replatforming (Lift-Tinker-Shift)

    Replatforming, often called "Lift-Tinker-Shift," represents a strategic middle ground among legacy system modernization strategies. It goes beyond a simple rehost by incorporating targeted, high-value optimizations to the application while migrating it to a new platform. This approach allows an organization to start realizing cloud benefits, such as improved performance or reduced operational costs, without the significant time and expense of a complete architectural overhaul (refactoring or rebuilding).

    This strategy involves making specific, contained changes to the application to better leverage cloud-native capabilities. For instance, a common replatforming move is migrating a self-managed, on-premise Oracle database to a managed cloud database service like Amazon RDS for PostgreSQL or Azure SQL Database. This swap reduces administrative overhead and improves scalability, delivering tangible benefits with minimal code modification.

    Replatforming (Lift-Tinker-Shift)

    As shown, replatforming offers a balanced approach, gaining cloud advantages without the full commitment of a rewrite.

    When to Use This Approach

    Replatforming is the ideal strategy when the core application architecture is fundamentally sound, but the organization wants to achieve measurable benefits from a cloud migration beyond infrastructure cost savings. It's perfect for situations where a full refactor is too costly or risky in the short term, but a simple lift-and-shift offers insufficient value. If your team has identified clear performance bottlenecks, such as database management or inefficient caching, replatforming allows you to address these "low-hanging fruit" during the migration process. It's a pragmatic step that unlocks immediate ROI while setting the stage for future, more in-depth modernization efforts.

    Implementation Considerations

    A successful replatforming project hinges on identifying the right components to "tinker" with. The goal is to maximize impact while minimizing the scope of change to prevent scope creep. When a key part of your replatforming initiative involves moving databases, a structured approach is critical. You can learn more about this by reviewing database migration best practices to ensure a smooth transition.

    Key implementation tips include:

    • Focus on High-Impact Optimizations First: Prioritize changes that deliver the most significant value. For example, replace a file-system-based session state with a distributed cache like Redis or Memcached. Swap a custom messaging queue with a managed cloud service like AWS SQS or Azure Service Bus. Implement auto-scaling groups to handle variable traffic instead of static server capacity.
    • Leverage Platform-as-a-Service (PaaS): Actively seek opportunities to replace self-managed infrastructure components with managed PaaS offerings. This offloads operational burdens like patching, backups, and high availability to the cloud provider, freeing up engineering time for value-added work.
    • Implement Cloud-Native Observability: Swap legacy monitoring and logging tools (e.g., Nagios, on-prem Splunk) for cloud-native solutions like Amazon CloudWatch, Azure Monitor, or Datadog. This provides deeper insights into application performance and health through integrated metrics, logs, and traces in the new environment.
    • Document All Changes: Meticulously document every modification made during the replatforming process, including changes to connection strings, environment variables, and infrastructure configurations. Store this information in a version-controlled repository (e.g., Git) alongside your infrastructure-as-code scripts.

    4. Repurchasing (Replace with SaaS)

    Repurchasing, often referred to as Replace, is a legacy system modernization strategy that involves completely retiring a legacy application and replacing it with a third-party Software-as-a-Service (SaaS) or Commercial-Off-The-Shelf (COTS) solution. Instead of trying to fix or migrate custom-built software, this approach opts for adopting a market-proven, vendor-supported platform that delivers the required business functionality out of the box. This shifts the burden of development, maintenance, and infrastructure management to the SaaS provider, allowing the organization to focus on its core business.

    Repurchasing (Replace with SaaS)

    Prominent examples include replacing a custom-built sales tracking system with Salesforce CRM, swapping a clunky on-premise HR platform for Workday, or modernizing an aging IT helpdesk with ServiceNow. The key is to find a commercial product whose functionality closely aligns with the organization's business processes, making it a powerful choice among legacy system modernization strategies.

    When to Use This Approach

    Repurchasing is the best strategy when a legacy application supports a common business function, such as finance, HR, or customer relationship management, for which robust SaaS solutions already exist. If an application is overly expensive to maintain, built on obsolete technology, or no longer provides a competitive advantage, replacing it is often more strategic than investing further resources into it. For certain functions like customer support, replacing legacy systems by repurchasing a modern SaaS offering, such as various virtual assistant solutions for customer service, can be a highly effective modernization path.

    Implementation Considerations

    A successful replacement project hinges on rigorous due diligence and change management. The focus shifts from technical development to vendor evaluation, data migration, and process re-engineering to fit the new system.

    Key implementation tips include:

    • Conduct Thorough Requirements Analysis: Develop a detailed requirements-gathering document (RGD) and use it to create a scoring matrix. Evaluate potential vendors against technical criteria (API capabilities, security certifications like SOC 2), functional requirements, and total cost of ownership (TCO), not just licensing fees.
    • Plan a Comprehensive Data Migration Strategy: Data migration is a project in itself. Develop a detailed plan for data cleansing, transformation (ETL), and loading into the new platform's data schema. Use specialized ETL tools like Talend or Informatica Cloud, and perform multiple dry runs in a staging environment to validate data integrity before the final cutover.
    • Invest Heavily in Change Management: Adopting a new SaaS solution means changing how people work. Invest in comprehensive user training, create clear documentation, and establish a support system to manage the transition and drive user adoption. Implement a phased rollout (pilot group first) to identify and address user friction points.
    • Maintain Integration Capabilities: The new SaaS platform must coexist with your remaining systems. Prioritize solutions with well-documented REST or GraphQL APIs. Use an integration platform as a service (iPaaS) like MuleSoft or Boomi to build and manage the data flows between the new SaaS application and your existing technology stack.

    5. Retiring (Decommissioning)

    Among the most impactful legacy system modernization strategies, Retiring, or Decommissioning, is the deliberate process of shutting down applications that no longer provide significant business value. This approach involves a strategic decision to completely remove a system from the IT portfolio, often because its functionality is redundant, its technology is obsolete, or the cost of maintaining it outweighs its benefits. Rather than investing in a migration or update, decommissioning eliminates complexity and frees up valuable resources.

    A powerful example is Ford's initiative to consolidate its numerous regional HR systems. By identifying overlapping capabilities, Ford was able to retire multiple legacy platforms in favor of a single, unified system, drastically reducing operational costs and simplifying its global HR processes. This demonstrates how decommissioning is not just about deletion but about strategic consolidation and simplification.

    When to Use This Approach

    Decommissioning is the optimal strategy when a thorough portfolio analysis reveals applications with low business value and high maintenance costs. It is particularly effective after mergers and acquisitions, where redundant systems for functions like finance or HR are common. This approach is also ideal for applications whose functionality has been fully absorbed by more modern, comprehensive platforms like an ERP or CRM system. If an application supports a business process that is no longer relevant, retiring it is the most logical and cost-effective action.

    This strategy is a powerful way to reduce technical debt and simplify your IT landscape, allowing focus to shift to systems that drive genuine business growth.

    Implementation Considerations

    A successful decommissioning project requires more than just "pulling the plug." It demands a structured and communicative approach to minimize disruption and risk. Before removing a system, perform a comprehensive business impact analysis to understand exactly who and what will be affected by its absence.

    Key implementation tips include:

    • Implement a Data Archival Strategy: Do not delete historical data. Establish a clear plan for archiving data from the retired system into a secure, accessible, and cost-effective cold storage solution, such as Amazon S3 Glacier or Azure Archive Storage. Ensure the data format is non-proprietary (e.g., CSV, JSON) for future accessibility.
    • Ensure Regulatory Compliance: Verify that the decommissioning process, especially data handling and archival, adheres to all relevant industry regulations like GDPR, HIPAA, or Sarbanes-Oxley. Document the entire process, including data destruction certificates for any decommissioned hardware, to create a clear audit trail.
    • Communicate with Stakeholders: Develop a clear communication plan for all users and dependent system owners. Inform them of the decommissioning timeline, the rationale behind the decision, and any alternative solutions or processes they need to adopt. Provide read-only access for a set period before the final shutdown.
    • Document the Decision Rationale: Formally document why the system is being retired, including the cost-benefit analysis (TCO vs. value), the results of the impact assessment, and the data archival plan. This documentation is invaluable for future reference and for explaining the decision to leadership and auditors.

    6. Retaining (Revisit Later)

    The Retaining strategy, often called "Revisit Later," is a conscious and strategic decision to do nothing with a specific legacy system for the time being. This approach acknowledges that not all systems are created equal, and modernization resources should be focused where they deliver the most significant business value. It involves actively choosing to keep an application in its current state, postponing any modernization investment until a more opportune time. This is not neglect; it's a calculated move within a broader portfolio of legacy system modernization strategies.

    A prime example is found in the airline industry, where many core reservation systems, often decades-old mainframes running on COBOL, are retained. While customer-facing websites and mobile apps are continuously rebuilt and modernized, the underlying booking engine remains untouched due to its stability, complexity, and the sheer risk associated with changing it. The business value is created at the user-experience layer, making the modernization of the core system a lower priority.

    When to Use This Approach

    Retaining a system is the right choice when the cost and risk of modernization far outweigh the current business value it provides. This is common for systems with low usage, those slated for decommissioning in the near future, or applications that are stable and perform their function without causing significant issues. It's a pragmatic approach for organizations with limited budgets or technical teams, allowing them to concentrate their efforts on modernizing high-impact, customer-facing, or revenue-generating applications first. If a system "just works" and is not a direct impediment to business goals, retaining it can be the most sensible financial decision.

    Implementation Considerations

    Effectively retaining a system requires active management, not passive avoidance. The goal is to contain its risk and cost while you modernize elsewhere.

    Key implementation tips include:

    • Establish Clear Retention Criteria: Create a formal framework for deciding which systems to retain. This should include metrics like business criticality, maintenance cost (TCO), security vulnerability level (CVSS scores), and user count. This provides a data-driven basis for the decision.
    • Implement "Ring-Fencing": Isolate the legacy system to prevent its issues from affecting other modernized components. Use an API gateway to create an anti-corruption layer (ACL) that exposes only necessary data and functions. This buffer layer allows modern applications to interact with the legacy system via clean, well-defined contracts without being tightly coupled to its outdated architecture.
    • Schedule Regular Reassessments: The decision to retain is not permanent. Institute a mandatory review cycle, perhaps quarterly or annually, to re-evaluate if the conditions have changed. Key triggers for reassessment include new security vulnerabilities, a significant increase in maintenance costs, or a shift in business strategy that increases the system's importance.
    • Maintain Knowledge and Documentation: As a system ages, institutional knowledge is a major risk. Document its architecture, dependencies, and operational procedures meticulously in a central wiki or knowledge base (e.g., Confluence). Ensure that at least two engineers are cross-trained on its maintenance and incident response to avoid a single point of failure (SPOF).

    7. Strangler Fig Pattern

    The Strangler Fig Pattern is one of the most powerful and risk-averse legacy system modernization strategies. Named by Martin Fowler, this approach draws an analogy from the strangler fig plant that grows around a host tree, eventually replacing it. Similarly, this pattern involves incrementally building new functionality around the legacy system, gradually intercepting and routing calls to new services until the old system is "strangled" and can be safely decommissioned. This method allows for a controlled, piece-by-piece transformation without the high risk of a "big bang" rewrite.

    Strangler Fig Pattern

    A prime example is Monzo Bank's transition from a monolithic core banking system to a distributed microservices architecture. By implementing the Strangler Fig Pattern, Monzo could develop and deploy new services independently, routing specific functions like payments or account management to the new components while the legacy core remained operational. This strategy enabled them to innovate rapidly while ensuring continuous service availability for their customers.

    When to Use This Approach

    The Strangler Fig Pattern is ideal for large, complex, and mission-critical legacy systems where a complete shutdown for replacement is not feasible due to business continuity risks. It's the perfect choice when modernization needs to happen over an extended period, allowing development teams to deliver value incrementally. This approach is particularly effective when migrating a monolith to a microservices architecture, as it provides a structured path for decomposing the application domain by domain.

    This video from Martin Fowler provides a detailed explanation of the pattern and its application.

    As the pattern demonstrates, it mitigates risk by allowing for gradual, validated changes over time.

    Implementation Considerations

    Successful execution of the Strangler Fig Pattern hinges on an intelligent routing layer and careful service decomposition. This pattern is foundational to many successful microservices migrations; for a deeper dive, explore these common microservices architecture design patterns that complement this strategy.

    Key implementation tips include:

    • Use an API Gateway: Implement an API gateway (e.g., Kong, Apigee) or a reverse proxy (e.g., NGINX, HAProxy) to act as the "facade" that intercepts all incoming requests. This layer is critical for routing traffic, applying policies, and directing requests to either the legacy monolith or a new microservice based on URL path, headers, or other criteria.
    • Start at the Edge: Begin by identifying and rebuilding functionality at the edges of the legacy system, such as a specific user interface module or a single API endpoint. These components often have fewer dependencies and can be replaced with lower risk, providing an early win and demonstrating the pattern's value.
    • Maintain Data Consistency: Develop a robust data synchronization strategy. As you build new services that own their data, you may need temporary solutions like an event-driven architecture using Kafka to broadcast data changes, or a data virtualization layer to provide a unified view of data residing in both old and new systems.
    • Implement Robust Monitoring: Establish comprehensive monitoring and feature flagging from day one. Use tools like Prometheus and Grafana to track the latency and error rates of new services. Employ feature flags (using services like LaunchDarkly) to dynamically control traffic routing, allowing you to instantly roll back to the legacy system if a new service fails.

    Legacy Modernization Strategies Comparison

    Strategy Implementation Complexity Resource Requirements Expected Outcomes Ideal Use Cases Key Advantages
    Lift and Shift (Rehosting) Low Minimal code changes, automated tools Fast migration, preserves legacy logic Quick cloud migration, minimal disruption Fastest approach, low initial risk
    Refactoring (Re-architecting) High Significant development effort, expert skills Optimized, scalable, cloud-native applications Long-term modernization, performance boost Maximum benefit, improved maintainability
    Replatforming (Lift-Tinker-Shift) Medium Moderate coding and platform changes Partial modernization with improved efficiency Balanced modernization, ROI-focused Better ROI than lift-and-shift, manageable risk
    Repurchasing (Replace with SaaS) Low to Medium Vendor solution adoption, data migration Eliminates custom code maintenance, SaaS benefits When suitable SaaS solutions exist Eliminates technical debt, rapid deployment
    Retiring (Decommissioning) Low to Medium Analysis and archival resources Cost savings by removing unused systems Obsolete or redundant applications Cost reduction, simplified IT environment
    Retaining (Revisit Later) Low Minimal ongoing maintenance Maintains legacy with potential future upgrade Low-impact systems, resource constraints Focus on high-priority modernization, cost-effective
    Strangler Fig Pattern High Incremental development, complex routing Gradual system replacement with minimal disruption Gradual migration, risk-controlled modernization Minimal disruption, continuous operation

    From Strategy to Execution: Partnering for Success

    Navigating the landscape of legacy system modernization strategies requires more than just understanding the theory behind each approach. As we've explored, the path you choose, whether it's a straightforward Rehost, an intricate Refactor, or a gradual transition using the Strangler Fig pattern, carries significant implications for your budget, timeline, and future technical capabilities. The decision is not merely a technical one; it is a strategic business decision that directly impacts your ability to innovate, scale, and compete in a rapidly evolving digital marketplace.

    A successful modernization project hinges on moving from a well-defined strategy to flawless execution. This transition is where many initiatives falter. The complexities of data migration, maintaining business continuity, managing stakeholder expectations, and orchestrating new cloud-native tooling demand specialized expertise and meticulous planning. Choosing the wrong path can lead to budget overruns and technical debt, while the right strategy, executed perfectly, unlocks immense value.

    Key Takeaways for Your Modernization Journey

    To ensure your efforts translate into tangible business outcomes, keep these core principles at the forefront:

    • Align Strategy with Business Goals: The "best" modernization strategy is the one that most effectively supports your specific business objectives. Don't chase trends; select an approach like Replatforming or Repurchasing because it solves a concrete problem, such as reducing operational costs or accelerating feature delivery.
    • Embrace Incremental Change: For complex systems, a phased approach like the Strangler Fig pattern is often superior to a "big bang" rewrite. It de-risks the project by delivering value incrementally, allowing for continuous feedback and adaptation while minimizing disruption to core business operations.
    • Prioritize Data Integrity: Your data is one of your most valuable assets. Every strategy, from a simple Lift and Shift to a complete Rebuild, must include a robust plan for data migration, validation, and security to ensure a seamless and reliable transition.
    • Invest in Automation and Tooling: Modernization is an opportunity to build a foundation for future agility. Leverage Infrastructure as Code (IaC) tools like Terraform, containerization with Docker and Kubernetes, and robust CI/CD pipelines to automate deployment, enhance resilience, and empower your development teams.

    Ultimately, mastering these legacy system modernization strategies is about future-proofing your organization. It's about transforming your technology from a constraint into a catalyst for growth. By carefully selecting and executing the right approach, you create a resilient, scalable, and adaptable technical foundation that empowers you to respond to market changes with speed and confidence. This transformation is not just an IT project; it is a fundamental driver of long-term competitive advantage.


    Ready to turn your modernization plan into a reality? OpsMoon connects you with a curated network of elite, pre-vetted DevOps and Platform Engineering experts to execute your chosen strategy flawlessly. Schedule your free work planning session today and let us match you with the precise talent needed to accelerate your journey to the cloud.

  • Application Performance Monitoring Tools Comparison: A Technical Guide for Engineers

    Application Performance Monitoring Tools Comparison: A Technical Guide for Engineers

    When you start digging into an application performance monitoring tools comparison, you hit one truth pretty fast: the best tool is completely situational. It all comes down to your tech stack, your deployment architecture, and your team's operational maturity.

    Some tools are wizards at automated root cause analysis in a chaotic Kubernetes environment. Others are phenomenal at deep code-level profiling for a monolithic Java application. There's no one-size-fits-all answer. This guide provides a technical framework to help you make an informed decision.

    Why The Right APM Tool Is a Strategic Imperative

    Image

    Selecting an Application Performance Monitoring (APM) tool is a critical engineering decision, not just another item on a procurement checklist. With the proliferation of distributed systems, microservices, and ephemeral cloud-native environments, legacy, siloed monitoring approaches are fundamentally broken.

    A single user-facing request can now traverse dozens of services, message queues, and databases. Manually tracing a high-latency transaction through this distributed call graph during an incident is technically infeasible and a waste of valuable engineering time.

    This complexity directly impacts the business. A performance degradation that was once a minor annoyance can now cause cascading failures, leading to measurable revenue loss, increased customer churn, and a damaged brand reputation. A robust APM strategy provides the deep, actionable telemetry required to understand what is actually happening inside your production systems.

    The Core Pillars of Modern APM

    Modern APM is built on three foundational pillars of observability. A technical application performance monitoring tools comparison must start with an assessment of how a tool implements these concepts.

    • Distributed Tracing: This is the backbone of microservice analysis. It reconstructs the end-to-end journey of a request as it propagates across service boundaries, databases, and third-party APIs. By correlating parent and child spans, it transforms a series of isolated events into a coherent, causal narrative of a single transaction.
    • Real-User Monitoring (RUM): RUM provides client-side performance telemetry directly from the end-user's browser or mobile device. It captures critical metrics like First Contentful Paint (FCP), Largest Contentful Paint (LCP), and Interaction to Next Paint (INP), along with JavaScript errors, providing an unvarnished view of the actual user experience.
    • AIOps (AI for IT Operations): Modern applications generate a deluge of telemetry data (logs, metrics, traces). AIOps leverages machine learning algorithms to automate the analysis of this data. It performs tasks like dynamic baselining, anomaly detection, event correlation, and root cause identification, reducing the cognitive load on engineers.

    The market reflects this growing need for deep visibility. The application metrics and monitoring tools market, valued at USD 12.88 billion in 2025, is projected to rocket to USD 37.78 billion by 2035. This growth is fueled by the widespread adoption of microservices and the engineering demand for real-time, high-cardinality data analysis.

    A great APM tool does more than just spot errors; it helps you tackle deep-seated problems. It’s brilliant for uncovering the hidden cost of technical debt and legacy software. By quantifying the latency impact of a poorly designed module or an N+1 query pattern, it provides the hard data needed to justify refactoring efforts.

    Ultimately, choosing the right APM platform is about transforming an engineering team's posture from reactive firefighting to proactive, data-driven system optimization.

    Defining Your APM Evaluation Framework

    Image

    Before you begin a proof-of-concept for any specific application performance monitoring tools, you must establish a technical evaluation framework. It is easy to be swayed by slick user interfaces or marketing claims, but these do not reveal a tool's underlying capabilities or limitations.

    A well-defined framework forces you and your team to agree on a concrete set of technical requirements and success criteria for your specific environment. This ensures you make a data-driven choice based on technical merit, not vendor promises.

    Core Technical Capabilities

    The primary function of an APM tool is to provide deep visibility into your application's runtime behavior. Your first task is to assess the depth and quality of this visibility and its compatibility with your technology stack.

    Here are the technical fundamentals you must evaluate:

    • Code-Level Visibility: Can the tool's profiler pinpoint the exact function, method, or SQL query that is a performance bottleneck? Can it do this in production with minimal performance overhead? This is the critical difference between knowing a service endpoint is slow and knowing it's because of a specific inefficient algorithm or a database query missing an index.
    • Distributed Tracing Quality: How effectively does the tool propagate trace context across a polyglot environment—for example, from a Go service to a Python API via a Kafka message queue? Scrutinize its auto-instrumentation capabilities versus the amount of manual code modification required. A tool that automatically handles context propagation across different protocols (HTTP, gRPC, messaging) will dramatically reduce your mean time to resolution (MTTR).
    • Automated Root Cause Analysis: The best tools use AI/ML to go beyond simple alerting. You need to assess how effectively the platform correlates events, linking a user-facing symptom (e.g., high latency) back to a specific root cause like a new code deployment, a configuration change, or an infrastructure failure.

    A huge mistake I see teams make is underestimating the challenges of distributed tracing in a real-world, high-load environment. A demo with three clean microservices always looks great. But what happens when you have hundreds of services, trace sampling kicking in, and context being dropped by un-instrumented legacy components? That's the real test of a tool's robustness.

    Non-Functional Requirements and Scalability

    A tool's features are only one part of the equation. The other is how it integrates into your operational workflows and whether its architecture can scale with your application's growth.

    Consider these operational and deployment aspects:

    1. Deployment Model (Agent-Based vs. Agentless): Agent-based tools typically offer deeper insights (e.g., memory profiling, process-level metrics) but require installing and managing agents on every host or container. This introduces operational overhead and a potential point of failure. Agentless approaches, often leveraging standards like OpenTelemetry, offer greater flexibility and reduced footprint but may not provide the same depth of out-of-the-box visibility.
    2. Data Ingestion and Scalability: How does the platform's data ingestion pipeline handle massive telemetry bursts during peak traffic? Investigate its architecture for potential bottlenecks. Does it use a scalable message queue? Is its data store optimized for high-cardinality time-series data? A tool that drops data or experiences high query latency during a production incident has failed its primary mission.
    3. Extensibility and Integrations: No tool is an island. Verify the existence of robust, pre-built integrations with your existing toolchain—your CI/CD system (e.g., Jenkins, GitLab CI), alerting platforms (e.g., PagerDuty), and incident management software (e.g., Jira). Equally important, evaluate its APIs. Can you programmatically query telemetry data or configure alerting?

    Finally, you must look past the sticker price and calculate the real Total Cost of Ownership (TCO). This includes not just the license fee, but also data ingestion and retention costs, the engineering hours required for implementation and instrumentation, and the ongoing operational burden of maintenance and training.

    Key Evaluation Criteria for APM Tools

    To formalize your evaluation, use a clear checklist or scorecard. The table below summarizes key technical and business criteria to guide your decision-making process.

    Evaluation Category Key Features to Assess Business Impact
    Observability Depth Code-level profiling, database query analysis, support for polyglot tracing, infrastructure correlation. Reduces Mean Time to Resolution (MTTR) by pinpointing the exact source of performance issues.
    AI & Automation Automated root cause analysis, anomaly detection, predictive alerting, deployment change tracking. Frees up engineering time from manual troubleshooting; enables proactive problem-solving.
    Deployment & Scalability Agent vs. agentless options, data ingestion limits, architecture resilience, support for containers/serverless. Ensures the tool can grow with your application and won't become a bottleneck itself.
    Integration Ecosystem Pre-built integrations (Slack, PagerDuty, Jira), API quality and documentation, support for OpenTelemetry. Fits smoothly into existing workflows, preventing tool silos and manual data correlation.
    Cost & Ownership Licensing model (per host, per user), data retention costs, implementation effort, training requirements. Provides a clear picture of the Total Cost of Ownership (TCO), not just the upfront price.

    Using a structured framework like this ensures that every stakeholder, from engineering to finance, is evaluating the tools on the same terms. It moves the conversation from "Which one looks coolest?" to "Which one actually solves our problems most effectively?"

    Technical Deep Dive: A Side-by-Side APM Tool Comparison

    Alright, this is where the rubber meets the road. A real application performance monitoring tools comparison means getting technical and looking at how these platforms actually work under the hood. We're going to break down the core architectural philosophies and key technical differentiators of four major players: Dynatrace, New Relic, Datadog, and AppDynamics.

    Paying attention to these details is critical. One tool might excel at automatic service discovery in a dynamic Kubernetes environment, while another provides unparalleled transaction mapping for a complex, monolithic enterprise application. Your optimal choice depends entirely on your technology stack and engineering objectives.

    Architectural Philosophy and Data Collection

    The core of any APM tool is its telemetry collection mechanism. This fundamental architectural decision profoundly impacts the depth of visibility you get and the operational overhead you incur.

    • Dynatrace (OneAgent Approach): Dynatrace’s key differentiator is its OneAgent. You install this single binary on a host, and it automatically discovers and injects itself into running processes to capture traces, metrics, and logs. This provides deep, automatic visibility with minimal manual configuration, which is a significant advantage in complex, ephemeral environments.
    • New Relic (Agent-Based, Unified Telemetry): New Relic also uses language-specific agents but funnels all data into its central Telemetry Data Platform. The power here lies in its queryability (via NRQL), offering immense flexibility for creating custom dashboards and ad-hoc analysis. The trade-off is that it can require more initial effort to configure and deploy the various agents correctly.
    • Datadog (Unified Agent, Strong on Infrastructure): Datadog originated as an infrastructure monitoring platform and has expanded into APM. Its unified agent is exceptional at collecting metrics from hosts, containers, and a vast ecosystem of integrations. While its APM capabilities are robust, its architecture still reflects this infrastructure-centric heritage.
    • AppDynamics (Business Transaction Centric): AppDynamics, a part of Cisco, models the world around business transactions. It focuses on tracing a user-initiated workflow—like "Process Payment"—from end to end. This approach is highly effective for large enterprises where mapping application performance directly to business outcomes is a primary requirement.

    A key difference becomes clear right away: Dynatrace is all about automated discovery and dependency mapping out-of-the-box. Datadog prioritizes flexibility and tight integration with infrastructure data. New Relic gives you a powerful, queryable data firehose, and AppDynamics builds its entire universe around pre-defined business transactions.

    AI and Root Cause Analysis: The Battle of the Bots

    Modern applications are too complex for manual root cause analysis. This is where AIOps comes in, but the "intelligence" layer is a major point of differentiation among these tools.

    Dynatrace's Davis AI vs. Datadog's Watchdog

    This is one of the most significant technical comparisons in the APM space.

    • Davis (Dynatrace): Davis is a deterministic AI engine. It leverages the rich, real-time dependency map (Smartscape) generated by OneAgent to understand the precise cause-and-effect relationships within your stack. When an issue occurs, Davis doesn't just find correlations; it traces the causal path. It can state with high confidence, "This user-facing slowdown was caused by a garbage collection pause in this specific JVM, which was triggered by a memory leak introduced in the last deployment."
    • Watchdog (Datadog): Watchdog is a probabilistic machine learning engine. It continuously analyzes all telemetry streams to automatically detect anomalies and surface "unknown unknowns." It excels at identifying deviations from normal patterns in logs and metrics. However, its root cause analysis is more about highlighting strong statistical correlations than providing a single, definitive causal explanation like Davis.

    New Relic and AppDynamics also have powerful AI capabilities. New Relic’s applied intelligence helps detect anomalies and group related incidents, while AppDynamics' Cognition Engine focuses on connecting performance issues to their business impact. However, the philosophical divide between Davis's deterministic model and Watchdog's probabilistic one is a crucial decision point for many engineering teams. For tips on squeezing the most value out of these platforms, check out our guide on application performance optimization.

    This snapshot gives you an idea of how these architectural choices can play out in the real world, affecting metrics like accuracy and response time.

    Image

    You can see a clear trade-off. Tools that nail anomaly detection with high accuracy might have a slightly longer alert latency. It's a balance you'll need to weigh based on how sensitive your system is to both false alarms and slow responses.

    Practical Implementation and Extensibility

    A tool’s technical specs are meaningless if it's difficult to implement or doesn't integrate with your existing workflows. Practicality is paramount.

    Instrumentation Effort:

    • High Automation (Dynatrace): The OneAgent model significantly reduces the manual effort of instrumentation. Teams often report seeing meaningful data within minutes of installation.
    • Moderate Effort (New Relic, Datadog): These tools provide excellent auto-instrumentation, but achieving deep visibility often requires more fine-tuning, especially for custom application code or less common frameworks.
    • Configuration-Heavy (AppDynamics): Implementing AppDynamics, particularly defining all relevant business transactions, can be a substantial project. This upfront investment yields powerful business-centric reporting but requires significant initial engineering effort.

    Ecosystem and Integrations:
    Datadog is often considered the leader here, with a massive library of over 700 pre-built integrations. This makes it incredibly simple to ingest data from nearly any service or platform. New Relic and Dynatrace also have extensive integration catalogs, but Datadog's sheer breadth is a major technical advantage.

    While we're focused on APM, it helps to see how these fit into the bigger picture of IT infrastructure monitoring tools, which are often the foundation for these application-level insights.

    Situational Strengths and Weaknesses

    No single tool wins every time. Here’s a quick rundown of where each platform typically shines and where it might struggle, based on its technical DNA.

    Tool Primary Technical Strength Best-Fit Scenario Potential Weakness
    Dynatrace Automated, deterministic root cause analysis via OneAgent and Davis AI. Complex, dynamic microservices or Kubernetes environments where automation is key. Can feel like a "black box" because of the high automation; less flexible for custom queries than others.
    New Relic All-in-one Telemetry Data Platform with powerful query language (NRQL). Teams that want to build highly custom dashboards and run deep, ad-hoc queries across all telemetry. Can have a steeper learning curve; managing multiple agents can add overhead.
    Datadog Unmatched number of integrations and strong infrastructure-to-app correlation. Teams needing a single pane of glass for infra, logs, and APM, especially in diverse tech stacks. APM can feel less mature than its infra monitoring; probabilistic AI might not satisfy all users.
    AppDynamics Deep focus on business transaction monitoring and business impact analysis. Large enterprises that need to translate tech performance into clear business KPIs for stakeholders. Can be more complex and costly to implement; may be overkill for teams without a strong business-transaction focus.

    Ultimately, the best application performance monitoring tools comparison is one you run yourself with a proof-of-concept. Use this technical breakdown to shortlist the contenders, then put them to the test on a real, critical application. That’s the only way to see how their philosophies and features hold up in the unforgiving reality of your own environment.

    Decoding Pricing Models and Total Cost of Ownership

    Image

    Here's where things get tricky. An APM tool's real cost is almost never the number you see on the pricing page. That initial quote is merely the starting point. To conduct a meaningful application performance monitoring tools comparison, you must dissect the complex—and often opaque—pricing models that vendors employ.

    These models are frequently based on abstract or variable metrics that make a direct, apples-to-apples comparison difficult. Understanding these nuances is essential to avoid significant budget overruns.

    Common APM Pricing Metrics

    Most modern APM platforms use a blend of metrics, each with different cost implications depending on your architecture.

    • Per Host or Host Unit: A classic model where you are billed based on the number of servers or VMs being monitored. Beware of "host units." Some vendors weight these units by memory or CPU, so a single powerful host might consume 16 or 32 units, inflating costs unexpectedly.
    • Data Ingestion Volume: Many observability-focused platforms charge based on the volume of telemetry—traces, logs, metrics—ingested per month, typically measured in GB or TB. This offers flexibility but introduces budget volatility, as a buggy service generating excessive logs can lead to a massive, unplanned bill.
    • Custom Units: Vendors like Dynatrace use proprietary composite metrics like "Host Unit Hours," which factor in both host memory and monitoring duration. The goal is to align cost with actual usage, but it can make forecasting monthly spend a complex exercise.

    The biggest trap here is ignoring the hidden costs. Data overage fees, charges for extended data retention periods, and premium add-on modules for features like security or business analytics can easily double your projected spend. Always scrutinize the contract and service agreement details.

    Calculating the True Total Cost of Ownership

    To create a realistic budget, you must calculate the Total Cost of Ownership (TCO). This is a comprehensive financial and technical analysis that accounts for all direct and indirect expenses over the tool's lifecycle.

    Understanding fundamental software license management best practices is crucial for controlling your TCO. Your TCO framework must include key operational overheads that are often overlooked.

    TCO Calculation Framework:

    1. Implementation Effort: Quantify the engineering hours required for initial deployment. This includes deploying agents, configuring custom instrumentation for proprietary code, and integrating the tool into your CI/CD pipeline. This initial time investment is a significant, real cost.
    2. Team Training: A tool is ineffective if the team cannot use it proficiently. Factor in the time and resources for training, from basic dashboard navigation to mastering advanced query languages and alert configuration.
    3. Ongoing Maintenance: Assign a cost to the operational load of updating agents, managing user permissions, and fine-tuning alert configurations to reduce noise. This ongoing effort consumes valuable engineering cycles. This becomes especially clear during complex infrastructure changes, like a database migration, which often demand meticulous planning. For more on that, our article on database migration best practices offers some solid insights into managing that kind of technical overhead.

    By building a complete TCO model, you move beyond simple price comparison to a strategic financial decision. This ensures the chosen APM tool is not only a technical fit but also financially sustainable for your organization.

    Matching the Right APM Tool to Your Technical Use Case

    When you're doing an application performance monitoring tools comparison, the objective isn't to find the "best" tool in a vacuum—it's to find the optimal tool for your specific technical reality. What is a game-changer for a cloud-native startup could be a frustrating and expensive mismatch for a large financial institution. The right choice must align with your architecture, team skills, and business objectives.

    This alignment is more critical than ever. The APM market, valued at USD 9.04 billion in 2024, is projected to hit USD 21.30 billion by 2032. This growth is driven by the integration of AI/ML for predictive analytics and sophisticated anomaly detection. You can dig into the specifics in the full research from Data Bridge Market Research.

    Let's break down some real-world technical scenarios and identify the best-fit APM solutions.

    Use Case 1: The Cloud-Native Startup

    Your architecture is modern and ephemeral: Kubernetes, microservices, and serverless functions. Your primary technical requirements are speed of deployment and automated discovery. Your architecture changes constantly, and you lack a dedicated team to manage monitoring infrastructure.

    • Top Contender: Dynatrace
    • Why It Fits: The OneAgent technology is purpose-built for this scenario. It automatically discovers, instruments, and maps new services and containers as they are deployed, a critical feature in a dynamic environment. For a small engineering team, the deterministic root cause analysis from its Davis AI provides a clear, actionable signal without requiring hours of manual configuration or alert tuning.

    Use Case 2: The Large Enterprise with Legacy Systems

    You operate in a hybrid environment with modern microservices coexisting with on-premise, monolithic legacy applications. Your key requirements include robust security, support for complex multi-tiered applications, and strong data governance.

    • Top Contender: AppDynamics
    • Why It Fits: AppDynamics excels at mapping business transactions across both modern and legacy systems. Its strong support for on-premise deployments meets the stringent security and data residency requirements of many large enterprises. Critically, its ability to translate technical performance metrics (e.g., latency, error rates) into business KPIs (e.g., revenue impact) is vital for communicating with non-technical stakeholders. For these environments, folding solid DevOps security best practices into your monitoring strategy is essential.

    A key differentiator here is the operational model. A startup needs "set it and forget it" automation. An enterprise needs deep control, custom instrumentation for proprietary code, and robust reporting that speaks the language of business impact.

    Use Case 3: The E-commerce Platform

    For any e-commerce platform, every millisecond of latency can directly impact revenue. The end-user experience is paramount. Your primary focus is on Real User Monitoring (RUM) and correlating client-side performance with backend behavior.

    • Top Contender: New Relic
    • Why It Fits: New Relic provides a powerful combination of Browser (RUM) and APM monitoring. It allows you to trace a slow page load experienced by a user back to a specific, inefficient database query or a slow downstream service call. Its powerful query language (NRQL) is a significant advantage, enabling the creation of detailed dashboards that map performance metrics to business funnels, pinpointing where latency is causing customer abandonment.

    Use Case 4: The Performance-Critical Microservices Team

    Your team owns a set of high-throughput, low-latency microservices, such as a real-time bidding platform or a financial trading system. Your work revolves around deep, code-level diagnostics and the flexibility to correlate telemetry data from diverse sources.

    • Top Contender: Datadog
    • Why It Fits: Datadog's core strength is its unification of infrastructure metrics, application traces, and logs in a single platform. For a performance-centric team, this correlation is invaluable. You can seamlessly pivot from a latency spike in a trace to the CPU and memory metrics of the specific container that handled the request. Its vast library of integrations allows you to ingest data from virtually any component in your stack, providing unparalleled flexibility for deep-dive investigations.

    Common APM Questions from the Trenches

    When you're in the weeds comparing application performance monitoring tools, the same questions tend to pop up. These aren't just technical curiosities; the answers shape your entire implementation strategy and determine whether you actually get value from your new tool. Let's tackle the big ones I hear from engineering teams all the time.

    What's the Real Difference Between Monitoring, APM, and Observability?

    This question comes up constantly, and it’s easy to get tangled in the buzzwords. From a technical standpoint, it's an evolution in the ability to interrogate a system.

    • Monitoring is about tracking pre-defined metrics for known failure modes—the "known-unknowns." You know CPU is a potential bottleneck, so you create a dashboard and an alert for when usage exceeds 90%. It's reactive and based on past experience.

    • APM adds context. It connects the dots between different telemetry signals. It takes that high CPU alert and correlates it with a specific slow transaction, a high error rate, and a recent code deployment. It answers why the monitored metric matters to the application's performance.

    • Observability is the ability to debug novel failure modes—the "unknown-unknowns." It's not about having more dashboards; it's about having sufficiently rich, high-cardinality data (traces, logs, and structured events) that you can ask arbitrary new questions of your system in real-time, without having to ship new code or change instrumentation. Modern APM tools are increasingly built on this principle.

    How Hard Is It Really to Implement an APM Tool?

    The initial setup can be deceptively simple, but a full implementation is a significant engineering effort.

    A modern SaaS tool like Dynatrace with its OneAgent can begin delivering data within minutes. The auto-instrumentation can seem magical.

    However, a true enterprise rollout is a multi-stage project. You will be:

    • Developing custom instrumentation for proprietary libraries and frameworks.
    • Integrating the tool's data with your CI/CD pipeline to automatically tag deployments and correlate them with performance regressions.
    • Implementing a robust alerting strategy, carefully tuning thresholds and notification rules to minimize alert fatigue and ensure signals are actionable.

    Don’t make the classic mistake of confusing a quick install with a successful implementation. You absolutely need to budget time for a proof-of-concept on a single, important application. That phase alone can take a few weeks and usually needs dedicated engineering time to dial everything in correctly.

    Can't We Just Use Open Source Instead of Paying for a Commercial Tool?

    Yes, you can. A DIY observability stack using open-source tools like Prometheus for metrics, Grafana for visualization, Jaeger for distributed tracing, and the ELK Stack for logging is incredibly powerful and offers maximum control.

    However, this power comes at the cost of engineering hours. You are now responsible for the integration, scaling, maintenance, and security of what are effectively four or more separate, complex distributed systems. The trade-off is your team's time and focus.

    Commercial APM platforms provide a unified, managed, out-of-the-box experience. You are paying for the integration, the advanced features like AIOps and automated root cause analysis, and the enterprise-level support. For many organizations, the Total Cost of Ownership (TCO) of a commercial tool is lower once you factor in the engineering headcount required to operate a DIY open-source stack at scale.


    Putting together a solid observability stack and navigating an APM implementation is a major undertaking. OpsMoon connects you with top-tier DevOps and SRE experts who have done this a dozen times before. Start with a free work planning session to build your roadmap today.

  • 7 Key Infrastructure as Code Benefits for 2025

    7 Key Infrastructure as Code Benefits for 2025

    In modern software delivery, speed, reliability, and security are non-negotiable. Manually provisioning and managing infrastructure via cloud consoles or bespoke scripts is no longer a viable option; it's slow, error-prone, and impossible to scale effectively. This is where Infrastructure as Code (IaC) fundamentally changes the game. By defining and managing infrastructure—from networks and VMs to Kubernetes clusters and IAM policies—through machine-readable definition files, IaC applies proven software engineering practices like version control, testing, and modularity to your cloud or on-premise environments. The result isn't just automation, it's a strategic shift that unlocks unprecedented efficiency and control.

    This article dives deep into the most critical infrastructure as code benefits, providing technical examples, actionable code snippets, and real-world scenarios to help you move from theory to implementation. We'll explore how declarative tools like Terraform and CloudFormation or procedural tools like Ansible and Pulumi don't just build servers, but build a more resilient, cost-effective, and collaborative engineering culture. For a deeper dive into the tools that enable this level of control and automation in the Azure environment, exploring guides like the one on Mastering the Azure PowerShell Module can provide valuable insights. Prepare to see how codifying your infrastructure is the cornerstone of high-performing DevOps.

    1. Absolute Version Control and Auditable Change Tracking with GitOps

    One of the most profound infrastructure as code benefits is the ability to manage your cloud and on-premise resources with the same rigor software developers use for application code. By placing your infrastructure definitions (e.g., .tf files for Terraform, manifest.yaml for Kubernetes) in a version control system like Git, you transform infrastructure management from an opaque, manual task into a transparent, programmatic, and auditable process.

    Every change, whether it's adjusting a load balancer's health_check timeout, modifying a 0.0.0.0/0 ingress rule on a security group, or scaling a Kubernetes Deployment replica count, is committed to your repository. This creates a complete, immutable history of your infrastructure's evolution. Each git commit is timestamped, attributed to a specific author, and includes a message explaining the "why" behind the change, providing unparalleled visibility for debugging and compliance audits.

    How GitOps Revolutionizes Infrastructure Management

    GitOps takes this concept a step further by establishing Git as the single source of truth for your infrastructure's desired state. Instead of an engineer running terraform apply from their local machine, a GitOps operator (like Argo CD or Flux) continuously monitors a specific branch in your Git repository. When it detects a drift between the state defined in Git and the actual state of your live infrastructure, it automatically triggers a reconciliation loop to align the live environment with the repository's definition.

    This workflow enforces a strict, review-based process for all infrastructure modifications.

    • Proposing a Change: An engineer creates a new branch (git checkout -b feature/add-redis-cache) and submits a pull request (PR) with the proposed infrastructure change, such as adding a new aws_elasticache_cluster resource in a Terraform file.
    • Automated Validation: CI pipelines automatically run against the PR, performing static analysis (terraform validate), security scans with tools like tfsec or Checkov, and policy checks using Open Policy Agent (OPA) to ensure the change complies with organizational standards (e.g., mandatory tagging, no public S3 buckets).
    • Peer Review: Colleagues review the PR's diff, scrutinizing the terraform plan output posted as a comment by the CI system. They discuss potential impacts and suggest improvements directly within the context of the code.
    • Approval and Merge: Once approved, the PR is merged into the main branch (main or production). This merge event is the trigger. The GitOps operator detects the new commit hash, pulls the updated code, and automatically executes the terraform apply command to enact the change in the target environment.

    This systematic approach provides a clear audit trail directly within Git, making it easy to answer critical questions for compliance and debugging: Who changed what (git blame), when did they change it (git log), and why (git show <commit_hash>)? If a deployment introduces a high-latency issue, reverting it is as simple as executing git revert <commit_hash>, which triggers the GitOps operator to roll back the infrastructure to its previous known-good state.

    2. Consistency and Standardization Across Environments

    Another of the core infrastructure as code benefits is the ability to eradicate configuration drift and ensure uniformity across all your environments. By defining infrastructure using code, you create a single, authoritative blueprint that can be deployed repeatedly, guaranteeing that your development, staging, and production environments are functionally identical. This eliminates the notorious "it works on my machine" problem, which often stems from subtle, undocumented differences like a missing IAM permission or a different firewall rule between environments.

    This approach codifies best practices into reusable, version-controlled artifacts like Terraform modules or Helm charts. For instance, companies like Airbnb leverage standardized Terraform modules to provision consistent infrastructure for over 200 microservices. This means every new service gets the same networking (aws_vpc, aws_subnet), security (aws_security_group), and access (aws_iam_role) configuration by default, dramatically reducing human error and security vulnerabilities.

    How to Enforce Standardization with IaC

    Achieving consistency isn't just about using the same script; it's about building a system around reusable and validated patterns. By treating your infrastructure definitions as a product, you can enforce standards programmatically and scale best practices across the entire organization.

    This workflow turns infrastructure provisioning into a predictable and reliable factory-like process.

    • Create Reusable Modules: Develop a central library of versioned, reusable modules for common infrastructure patterns. For example, a vpc module in Terraform would abstract away the complexity of creating a VPC, subnets, route tables, and internet gateways. Consumers of the module only need to provide high-level inputs like cidr_block.
    • Use Parameterized Configurations: Abstract environment-specific values (like instance sizes, replica counts, or DNS names) into separate variable files. A common pattern in Terraform is to use dev.tfvars, stg.tfvars, and prod.tfvars files. The core IaC code remains identical, and the CI/CD pipeline applies the correct variable file for the target environment: terraform apply -var-file="prod.tfvars".
    • Implement Automated Template Testing: Integrate automated tests into your CI/CD pipeline. For IaC, this involves using tools like Terratest (for Go), which can spin up real infrastructure from your code in a temporary account, run assertions against it (e.g., check if a web server returns a 200 OK), and then automatically tear it down. This proves the module works as expected before publishing a new version.
    • Enforce Policy as Code: Use tools like Open Policy Agent (OPA) or Sentinel to codify and automatically enforce organizational standards. You can write a policy that states, "All aws_s3_bucket resources must have versioning_enabled = true and must not have a public read ACL." This policy is checked during the terraform plan stage in CI, failing the build if a violation is detected.

    This systematic approach ensures that every piece of infrastructure, from a single S3 bucket to a multi-region Kubernetes cluster, is provisioned according to your organization's exact standards, improving reliability and security while accelerating project onboarding.

    3. Faster Deployment and Provisioning

    One of the most transformative infrastructure as code benefits is the dramatic acceleration of resource provisioning and environment deployment. By codifying infrastructure, you replace slow, click-driven manual setup processes with high-speed, parallelized automation. Teams can spin up entire complex ecosystems—including networking (VPCs, subnets), storage (S3 buckets, EBS volumes), compute (EC2 instances, ECS services), and databases (RDS instances)—in a matter of minutes instead of the days or weeks it traditionally takes.

    This capability is a game-changer for business agility. For example, Shopify uses automated provisioning with IaC to flawlessly scale its massive infrastructure for peak traffic events like Black Friday. This speed isn't just about initial setup; it enables powerful workflows like creating ephemeral, production-identical environments for every pull request, allowing for comprehensive integration testing before code is ever merged.

    Faster Deployment and Provisioning

    How Automation Accelerates Time-to-Market

    IaC tools like Terraform, AWS CloudFormation, and Pulumi parse your declarative configuration files, build a dependency graph of your resources, and then execute the necessary API calls to the cloud provider in the most efficient order possible (e.g., creating resources with no dependencies in parallel). This programmatic approach unlocks powerful, high-velocity workflows that were previously impossible.

    This speed directly enables core DevOps practices like creating ephemeral environments for testing pull requests or conducting performance load tests against a production-identical stack, all without resource contention or manual effort.

    • Design for Reusability: Create modular templates (e.g., Terraform modules, Helm charts) for common infrastructure patterns. For example, a kubernetes-app module could encapsulate a Kubernetes Deployment, Service, Ingress, and HorizontalPodAutoscaler, allowing developers to deploy their applications with just a few lines of code.
    • Implement Validation Gates: Embed automated health checks and validation steps directly into your deployment pipelines. After terraform apply completes, run a script that uses curl to check an application's health endpoint or psql to verify a database connection. The pipeline only proceeds if these checks pass, preventing the promotion of a broken deployment.
    • Manage Dependencies: Leverage the built-in dependency resolution of IaC tools. Terraform automatically infers dependencies (e.g., an aws_instance depends on the aws_subnet it's in). You can also use depends_on to explicitly define non-obvious relationships, ensuring resources are always provisioned and configured in the correct sequence.
    • Employ Progressive Deployment: For large-scale changes, use CI/CD pipelines to orchestrate canary or blue-green deployments. For example, a pipeline can use Terraform to provision a new "blue" environment, run automated tests against it, and then use a weighted DNS record or load balancer rule to gradually shift traffic from the old "green" environment, minimizing risk.

    By treating infrastructure provisioning as a repeatable, automated engineering task, you can build and tear down environments on demand. This empowers developers, accelerates testing cycles, and ultimately delivers value to customers faster.

    4. Cost Optimization and Resource Management

    Beyond automation and version control, one of the most compelling infrastructure as code benefits is its direct impact on your bottom line. By defining resources programmatically, you gain granular control over allocation, enabling automated strategies that systematically eliminate waste and optimize cloud spend. This shifts cost management from a reactive, manual cleanup task to a proactive, integrated part of your development lifecycle.

    Every resource, from a db.t3.micro RDS instance to a 10-node Kubernetes cluster using m5.2xlarge instances, is specified in code. This codification allows you to enforce cost-conscious policies directly within your IaC templates and CI/CD pipelines, preventing over-provisioning before it ever happens. For example, instead of developers manually selecting oversized instances, you can define a policy that flags any aws_instance PR with a non-approved instance type.

    How IaC Enables Proactive Cloud Cost Control

    IaC provides the foundation for building a cost-aware engineering culture by making expenditure visible and controllable within the development workflow itself. Instead of receiving a surprise bill at the end of the month, teams can estimate costs during the planning phase and implement automated guardrails.

    The following infographic highlights key metrics that organizations often achieve by applying IaC to their financial governance.

    Infographic showing key data about Cost Optimization and Resource Management

    These figures demonstrate how programmatic control directly translates into significant savings, improved visibility, and greater resource efficiency. Here are some actionable strategies to achieve these results:

    • Implement Automated Tagging: Enforce a mandatory tagging policy within your IaC modules using a required_tags variable. Use tags like team, project, and cost-center to allocate costs accurately, which is critical for showback and chargeback in tools like the AWS Cost and Usage Report.
    • Schedule Environment Shutdowns: Use CI/CD jobs (e.g., a scheduled GitHub Action) to run IaC scripts that automatically shut down non-production environments (development, staging) outside of business hours. This can be achieved with terraform destroy for ephemeral environments or by scaling down ASGs to zero. Coursera famously saves over $2M annually with this strategy.
    • Utilize Cost Estimation in CI: Integrate tools like Infracost or Terracost into your pull request pipeline. These tools parse the terraform plan and post a comment on the PR with an estimated monthly cost breakdown of the proposed changes (e.g., "+$500/month"), fostering financial accountability.
    • Define and Enforce Budgets as Code: Leverage cloud-native features like AWS Budgets or Azure Cost Management, defining them directly in Terraform. You can create an aws_budgets_budget resource that triggers an SNS notification or a Lambda function if spending exceeds a defined threshold.
    • Codify Auto-Scaling and Right-Sizing: Define auto-scaling policies (e.g., aws_appautoscaling_policy) in your IaC to match capacity with real-time demand based on metrics like CPU utilization or request count. Regularly use tools like AWS Compute Optimizer to identify underutilized resources and codify the "right-sized" instance types in your modules.

    By embedding these practices into your code, you transform cost management from an afterthought into a core, automated component of your infrastructure. This approach aligns with modern FinOps principles and is a key part of effective cloud cost optimization strategies on opsmoon.com.

    5. Enhanced Security and Compliance

    One of the most critical infrastructure as code benefits is the ability to codify and automate security, transforming it from a manual, often-overlooked step into an integral part of the development lifecycle. By defining security policies, compliance controls, and configuration best practices directly within your IaC templates, you create a standardized, repeatable, and auditable security posture across all your environments.

    This "security-as-code" approach ensures that every resource provisioned—from an aws_security_group to an aws_iam_policy—adheres to your organization's security standards from the moment of its creation. It eliminates configuration drift and manual errors that introduce vulnerabilities, such as an accidentally exposed database port. For instance, Goldman Sachs leverages Terraform with Sentinel policies to programmatically enforce that all S3 buckets have server-side encryption enabled and block public access.

    Enhanced Security and Compliance

    How IaC Automates Compliance and Hardens Your Infrastructure

    By treating security configurations as code, you can subject them to the same rigorous CI/CD processes used for application development. This means automated testing, peer reviews, and versioning are applied to your security rules, significantly reducing the risk of human error and creating a transparent, auditable trail for compliance frameworks like SOC 2, HIPAA, or PCI DSS. A practical example is how Dropbox maintains SOC 2 compliance using standardized infrastructure templates and automated auditing scripts that check live configurations against their code definitions in Git.

    This systematic workflow embeds security directly into the deployment pipeline, a core principle of DevSecOps.

    • Policy as Code: Use tools like HashiCorp Sentinel or Open Policy Agent (OPA) to define and enforce granular security policies. For example, you can write a Sentinel policy that prevents terraform apply if an aws_security_group_rule contains cidr_blocks = ["0.0.0.0/0"] for port 22 (SSH).
    • Automated Security Scanning: Integrate security scanners like tfsec, Checkov, or Trivy directly into your CI pipeline. These tools scan your Terraform, CloudFormation, or Kubernetes files for hundreds of common misconfigurations (e.g., unencrypted EBS volumes, overly permissive IAM policies) and fail the build if any are found.
    • Immutable Infrastructure: IaC promotes the use of immutable infrastructure. Instead of SSHing into a server to apply a patch, you build a new, hardened Amazon Machine Image (AMI) using a tool like Packer, update the ami ID in your aws_instance or aws_launch_template resource, and roll out new instances to replace the old ones. This eliminates configuration drift and minimizes the attack surface.
    • Secrets Management: Integrate tools like HashiCorp Vault or AWS Secrets Manager with your IaC workflow. Your Terraform code references a secret (e.g., data "aws_secretsmanager_secret_version" "db_password") instead of hardcoding it. The IaC tool securely fetches the value at runtime and injects it into the resource configuration or application environment variables.

    Adopting this proactive, code-driven security model allows your teams to move faster with confidence, knowing that a baseline of security and compliance is automatically enforced. It also simplifies audits, as your Git history provides a clear, verifiable record of every security-related change. For those looking to dive deeper, you can learn more about key principles and practices for embedding security into your CI/CD pipelines in our guide to DevOps security best practices.

    6. Improved Disaster Recovery and Business Continuity

    Another of the most critical infrastructure as code benefits is the ability to drastically shorten recovery times and enhance business continuity. By defining your entire infrastructure stack—from networking (VPC, Subnets, Route Tables) to compute (Auto Scaling Groups, Kubernetes clusters) to data services (RDS, ElastiCache)—in code, you create a portable and executable blueprint for your systems. In the event of a catastrophic failure, such as a regional cloud outage or a ransomware attack, this code becomes your fastest path to recovery.

    Instead of relying on outdated runbooks and manual efforts to rebuild servers, you can simply execute your IaC templates in a different region. This approach transforms disaster recovery (DR) from a high-stress, unpredictable event into a repeatable, automated, and tested procedure, dramatically reducing your Recovery Time Objective (RTO) from days or weeks to mere hours or minutes.

    How IaC Transforms Business Continuity Planning

    IaC codifies your recovery plan, making it testable, versionable, and reliable. Companies like Square maintain exceptionally high uptime by managing their failover infrastructure with Terraform, allowing them to redirect traffic to a secondary region almost instantaneously by modifying a few DNS records, also managed as code.

    This automated approach ensures your disaster recovery environment is an exact replica of your production setup, eliminating the configuration drift that often causes manual recovery efforts to fail.

    • Automated Infrastructure Replication: Your IaC codebase (e.g., Terraform, CloudFormation) can be parameterized to deploy an identical infrastructure stack in a designated recovery region. A provider block in Terraform can be configured to target us-west-2 instead of us-east-1, and the pipeline simply runs terraform apply against that new target.
    • Data Restoration Integration: The IaC scripts can include automated steps to restore data from backups. For instance, a Terraform aws_db_instance resource can be configured with the snapshot_identifier argument pointing to the latest automated or cross-region replicated snapshot. The script can then provision a new database instance directly from that snapshot.
    • Regular, Automated Testing: Integrate DR drills directly into your CI/CD pipelines. A scheduled pipeline can periodically spin up the entire infrastructure in the recovery region, run a suite of integration and health-check tests to validate its functionality, and then tear it down using terraform destroy. This practice, inspired by Netflix's chaos engineering, ensures your recovery plan actually works when you need it.
    • Rapid Failover Execution: When a disaster is declared, recovery is initiated by running a pre-approved IaC pipeline. This might involve promoting a read-replica database in the DR region to a primary instance, updating DNS records via an aws_route53_record resource, and scaling up compute resources, all orchestrated by the code.

    By embedding disaster recovery into your engineering lifecycle, you move from a reactive "break-glass" model to a proactive, continuously validated state of readiness. This codification of your infrastructure is the cornerstone of a modern, resilient business continuity strategy.

    7. Better Collaboration and Knowledge Sharing

    Another one of the key infrastructure as code benefits is its power to break down knowledge silos and foster genuine cross-team collaboration. When infrastructure is defined as code and stored in a shared Git repository, it transforms from an opaque, specialized domain into a transparent, documented, and accessible asset for the entire engineering organization. This codification captures critical operational knowledge, preventing it from being locked away with individual "gurus" or specialized teams.

    By treating infrastructure as a shared software project, you democratize expertise. Application developers can read the Terraform or Pulumi code to understand the environment their code will run in (e.g., "What environment variables are available? What are the firewall rules?"). Security teams can audit configurations programmatically, and new engineers can onboard faster by studying the codebase. This shared understanding reduces friction and handoffs, creating a more cohesive DevOps culture.

    How IaC Becomes a Collaboration Hub

    Adopting IaC fundamentally changes how teams interact with infrastructure, making collaboration the default standard. The process mirrors modern software development workflows, leveraging tools and practices that are already familiar to engineers, as famously championed by companies like Atlassian and GitHub.

    This shift enables organizations to scale their expertise. For example, Spotify empowers its autonomous squads with self-service infrastructure capabilities by providing a "golden path" of well-documented IaC modules, allowing them to provision standard resources without lengthy handoffs.

    • Implement Mandatory Code Reviews: Enforce a pull request (PR) process for all infrastructure changes. This practice ensures that every modification (e.g., a change to a load balancer rule) is reviewed by at least one other team member, who can scrutinize the code and the terraform plan output. This catches errors, shares architectural knowledge, and enforces best practices.
    • Create Comprehensive READMEs: Every infrastructure module or repository should have a detailed README.md file. This document should follow a standard format, explaining the purpose of the infrastructure, its inputs and outputs, and providing copy-paste examples of how to use it.
    • Use Descriptive Naming and Comments: Write clean, self-documenting code. Use clear, consistent naming conventions for variables, resources, and modules (e.g., variable "database_password" instead of var_a). Add comments to explain complex logic or the "why" behind a specific configuration choice (e.g., # This security group is intentionally open to allow for a public health check).
    • Maintain Architectural Decision Records (ADRs): For significant infrastructure decisions (e.g., "Why did we choose managed Kubernetes over rolling our own on EC2?"), create an ADR. This is a short markdown document in the repository that captures the context, decision, and consequences of an important architectural choice, providing invaluable historical context.

    7 Key Benefits Comparison

    Aspect Version Control and Change Tracking Consistency and Standardization Faster Deployment and Provisioning Cost Optimization and Resource Management Enhanced Security and Compliance Improved Disaster Recovery and Business Continuity Better Collaboration and Knowledge Sharing
    Implementation Complexity Moderate; requires disciplined commit and merge management High; needs careful planning and refactoring Moderate; upfront template creation plus dependency handling Moderate; ongoing monitoring and expertise needed High; requires security expertise and complex policy coding High; planning multi-region and automated failover Moderate; requires cultural shift and collaborative tooling
    Resource Requirements Standard source control systems (e.g., Git), infrastructure code Template libraries, compliance tools, standardized modules Automation tooling, CI/CD integration, deployment scripts Cost management tools, tagging, scaling automation Policy-as-code tools, security scanners, secrets management Backup systems, multi-region infrastructure, automated failover Shared repositories, code review tools, documentation effort
    Expected Outcomes Full audit trail, easy rollbacks, collaboration Eliminates drift, consistent environments, reduced errors Rapid deployments, faster scaling, shorter time-to-market Reduced costs, right-sized resources, minimized waste Consistent security policies, compliance, reduced risk Fast recovery, high availability, reduced downtime Shared knowledge, reduced silos, better onboarding
    Ideal Use Cases Large teams managing frequent infrastructure changes Organizations needing uniformity across multiple environments Teams requiring fast environment provisioning Businesses aiming to optimize cloud spend Regulated industries, security-sensitive environments Critical systems needing fast disaster recovery DevOps teams, multi-team infrastructure ownership
    Key Advantages Auditability, rollback, collaboration integration Standardization, compliance, error reduction Speed, scalability, integration with CI/CD pipelines Cost savings, automation, detailed cost attribution Security automation, policy enforcement, compliance auditing Reduced RTO, automated failover, consistent recovery processes Knowledge democratization, improved documentation, transparency

    From Code to Competitive Advantage: Your Next Steps with IaC

    The journey through the core infrastructure as code benefits reveals a fundamental truth: modern, high-velocity engineering teams treat their infrastructure with the same discipline and rigor as their application code. This is no longer a niche practice but a strategic imperative for building resilient, scalable, and secure systems. Moving from manual configurations and siloed knowledge to a codebase that defines your entire operational environment is a powerful transformation.

    As we've explored, the advantages are not abstract concepts; they are tangible, measurable improvements across your organization. You gain the ability to replicate complex environments with a single command, track every infrastructure change in a Git repository, and embed security policies directly into your deployment pipelines. This shift fundamentally redefines what's possible, turning slow, error-prone manual processes into fast, repeatable, and reliable automated workflows.

    Synthesizing the Key Benefits

    Let's distill the most critical takeaways from our discussion. The true power of IaC lies in the synergy between these benefits:

    • Ultimate Traceability: By leveraging version control (Benefit #1), every change is auditable, reversible, and transparent. This pairs directly with enhanced security (Benefit #5), as you can pinpoint exactly who changed what, when, and why, satisfying even the strictest compliance requirements.
    • Speed with Guardrails: Faster deployments (Benefit #3) are a direct result of codified consistency (Benefit #2). When every environment is a perfect, drift-free replica, you can promote changes from development to production with unparalleled confidence and speed.
    • Financial and Operational Resilience: IaC enables proactive cost optimization (Benefit #4) by allowing you to define and enforce resource standards. This financial governance is the perfect complement to robust disaster recovery plans (Benefit #6), where you can rebuild your entire infrastructure from code in a new region, minimizing downtime and protecting revenue.

    Ultimately, by codifying your infrastructure, you are also codifying your team's operational expertise. This improves collaboration and knowledge sharing (Benefit #7), breaking down information silos and turning tribal knowledge into a shared, version-controlled asset. This creates a durable competitive advantage, allowing you to innovate faster and operate more efficiently than competitors still wrestling with manual processes.

    Your Actionable Roadmap to IaC Maturity

    Embracing the full spectrum of infrastructure as code benefits is a journey, not a destination. To move forward, focus on these concrete next steps:

    1. Start Small, Prove Value: Select a non-critical service or a new project. Use a tool like Terraform or Pulumi to define its basic infrastructure (e.g., an S3 bucket for static hosting or a single EC2 instance with a security group). The goal is to build a small, successful proof-of-concept to gain buy-in and practical experience.
    2. Establish a "Source of Truth": Create a dedicated Git repository for your new IaC code. Enforce a pull request workflow for all changes, no matter how small. Protect your main branch and require at least one approval before merging. This initial discipline is the foundation for everything that follows.
    3. Integrate and Automate: Connect your IaC repository to a CI/CD pipeline (like GitLab CI, GitHub Actions, or Jenkins). Create two stages: a plan stage that runs on every PR, and an apply stage that runs automatically on merge to main. This ensures that code is validated and deployed systematically, not from a developer's laptop.

    Adopting IaC is more than an IT upgrade; it’s a strategic business decision. It is the technical foundation that allows you to out-maneuver competitors, deliver value to customers faster, and build a more resilient and secure business. The initial investment in learning, tooling, and process change pays dividends in speed, stability, and security for years to come.


    Struggling to translate IaC theory into practice or need to accelerate your cloud-native journey? OpsMoon connects you with the top 0.7% of elite DevOps and platform engineers who specialize in architecting and implementing robust IaC solutions. Get expert help to build your cloud foundation right by visiting OpsMoon to start your risk-free work planning session.

  • 7 Infrastructure as Code Examples to Master DevOps in 2025

    7 Infrastructure as Code Examples to Master DevOps in 2025

    Moving from manual configuration to automated infrastructure management is a critical step for any team aiming for scalability, consistency, and speed. Infrastructure as Code (IaC) transforms this process by allowing you to define, deploy, and manage your infrastructure using version-controlled, human-readable code. This approach eliminates configuration drift, accelerates deployment cycles, and makes infrastructure a repeatable, testable component of your software development lifecycle.

    This article cuts straight to the practical application, providing a detailed look at real-world infrastructure as code examples. We will deconstruct specific use cases across a range of powerful tools, including Terraform, AWS CloudFormation, Ansible, and Pulumi. Before diving into these specific examples, understanding how IaC fits into the bigger picture of IT automation is helpful. For a broader overview of the ecosystem, you can explore this guide on various infrastructure automation tools.

    Instead of just showing you code, we will analyze the strategic thinking behind each example. You will gain actionable insights and replicable methods for:

    • Provisioning cloud resources in a modular, reusable way.
    • Automating complex, multi-service application deployments.
    • Managing configuration for servers and applications consistently.
    • Implementing best practices for security, state management, and collaboration.

    Each section provides the code, the context, and the tactical takeaways you need to apply these patterns to your own projects immediately.

    1. Terraform by HashiCorp

    Terraform is a powerful open-source tool that has become a cornerstone of modern infrastructure as code (IaC) practices. Created by HashiCorp, it uses a declarative language called HashiCorp Configuration Language (HCL) to let you define and provision data center infrastructure. Instead of manually clicking through a cloud provider's console, you write code that specifies your desired state, and Terraform handles the rest, figuring out how to achieve that state efficiently and safely.

    One of Terraform's most significant advantages is its provider-agnostic nature. It can manage infrastructure across a vast ecosystem of cloud providers like AWS, Azure, and Google Cloud, as well as on-premises solutions. This makes it an ideal choice for multi-cloud or hybrid-cloud strategies, a common requirement for scaling companies. For example, Shopify uses Terraform to manage its complex Kubernetes clusters, while Netflix leverages it to orchestrate its global, multi-cloud infrastructure, showcasing its power in enterprise-level infrastructure as code examples.

    This infographic summarizes the core features that make Terraform a dominant force in the IaC landscape.

    Infographic showing key data about Terraform by HashiCorp

    The combination of multi-cloud support, a clear declarative syntax, and robust state management allows teams to build reproducible and predictable infrastructure.

    Why and When to Use Terraform

    Terraform excels when you need to manage complex, multi-component environments or operate across different cloud providers. Its state file acts as a source of truth, tracking your resources and their dependencies. This allows for powerful commands like terraform plan, which provides an execution preview before any changes are made, preventing costly mistakes.

    Actionable Tips for Implementation

    • Remote State and Locking: Always use a remote backend like Amazon S3 or Terraform Cloud. This centralizes the state file and enables state locking, which is critical for preventing concurrent runs from corrupting your infrastructure.
      • Implementation Code:
        # main.tf
        terraform {
          backend "s3" {
            bucket         = "my-terraform-state-bucket"
            key            = "global/s3/terraform.tfstate"
            region         = "us-east-1"
            dynamodb_table = "terraform-locks"
            encrypt        = true
          }
        }
        
    • Modularize Everything: Break down your infrastructure into reusable modules. A module for a VPC, another for a database, and another for an application server can be composed together, drastically reducing code duplication and improving maintainability.
      • Example Module Structure:
        /vpc
          ├── main.tf
          ├── variables.tf
          └── outputs.tf
        /main_project
          ├── main.tf (calls the vpc module)
        
    • Secrets Management: Never hardcode secrets in your configuration files. Use a dedicated secrets management tool like HashiCorp Vault or a cloud provider's native service (e.g., AWS Secrets Manager) and reference secrets dynamically.
      • Implementation Code (AWS Secrets Manager):
        data "aws_secretsmanager_secret_version" "db_credentials" {
          secret_id = "arn:aws:secretsmanager:us-east-1:123456789012:secret:db-creds-AbCdEf"
        }
        
        resource "aws_db_instance" "default" {
          # ... other configurations
          username = jsondecode(data.aws_secretsmanager_secret_version.db_credentials.secret_string)["username"]
          password = jsondecode(data.aws_secretsmanager_secret_version.db_credentials.secret_string)["password"]
        }
        

    2. AWS CloudFormation

    AWS CloudFormation is Amazon's native infrastructure as code service, deeply integrated into the AWS ecosystem. It allows you to model, provision, and manage a collection of related AWS and third-party resources by treating infrastructure as code. Using simple text files in either YAML or JSON format, you define your desired resources and their dependencies, and CloudFormation provisions and configures them for you in a predictable and orderly manner.

    As a service native to AWS, CloudFormation offers unparalleled integration with AWS services, making it a go-to choice for teams operating exclusively within the Amazon cloud. This tight coupling ensures that new AWS features and services are often supported in CloudFormation from day one. For instance, financial giant Capital One leverages CloudFormation to enforce strict compliance and security policies across its cloud infrastructure, while Expedia relies on it to consistently manage its vast and complex AWS environments, making it a powerful example of infrastructure as code in a single-cloud strategy.

    This deep integration provides a reliable and consistent method for codifying and deploying AWS infrastructure, directly from the source.

    Why and When to Use CloudFormation

    CloudFormation is the ideal choice when your infrastructure lives entirely within the AWS ecosystem. Its key strength is its native integration, which simplifies IAM permissions and ensures immediate support for new AWS services. It uses the concept of "Stacks," which are manageable units of AWS resources. This makes it easy to create, update, or delete an entire collection of resources as a single unit. The service also features automatic rollback on error, which reverts your infrastructure to its last known stable state if a deployment fails, significantly reducing risk.

    Actionable Tips for Implementation

    • Use Change Sets for Previews: Before applying changes to a stack, always generate a change set. This acts like a "dry run," showing you exactly which resources CloudFormation will create, update, or delete, helping you prevent unintended and potentially costly modifications.
      • Implementation Command (AWS CLI):
        aws cloudformation create-change-set \
            --stack-name my-production-stack \
            --template-body file://updated-template.yaml \
            --change-set-name my-change-set
        
        # After reviewing, execute the change set:
        aws cloudformation execute-change-set \
            --change-set-name my-change-set \
            --stack-name my-production-stack
        
    • Leverage Nested Stacks: For complex architectures, break down your main template into smaller, reusable components called nested stacks. You can have a nested stack for your networking layer (VPC, subnets) and another for your application layer, which improves modularity and maintainability.
      • Implementation Code (Root Stack):
        Resources:
          NetworkingStack:
            Type: AWS::CloudFormation::Stack
            Properties:
              TemplateURL: https://s3.amazonaws.com/my-templates/networking.yaml
              Parameters:
                VpcCidr: 10.0.0.0/16
        
    • Parameterize Your Templates: Use the Parameters section to pass in runtime values like instance types or environment names. This makes your templates reusable across different environments (e.g., dev, staging, prod) without modifying the core template code. For more advanced implementations, explore how to get the most out of AWS CloudFormation services.
      • Implementation Code (Template Snippet):
        Parameters:
          EnvironmentName:
            Type: String
            Description: The name of the environment (e.g., dev, prod).
            Default: dev
        
        Resources:
          MyS3Bucket:
            Type: AWS::S3::Bucket
            Properties:
              BucketName: !Sub "my-app-data-${EnvironmentName}"
        

    3. Ansible

    Ansible is an open-source automation platform that simplifies configuration management, application deployment, and infrastructure orchestration. It uses a human-readable language, YAML, to create "playbooks" that define automation jobs. Unlike many other tools that require agents on managed nodes, Ansible is agentless, typically communicating over standard SSH or WinRM protocols. This makes it incredibly lightweight and easy to start using.

    While often categorized as one of the best configuration management tools on opsmoon.com, Ansible's powerful modules for cloud providers like AWS, Azure, and Google Cloud also make it a strong contender for infrastructure provisioning. Companies like BMW use Ansible Tower to manage and automate their complex infrastructure, while Hootsuite leverages it to streamline application deployments, demonstrating its dual strength in both provisioning and configuration, a key feature in many infrastructure as code examples.

    Ansible

    Its procedural, step-by-step approach offers a different paradigm compared to declarative tools, giving engineers fine-grained control over the entire automation workflow.

    Why and When to Use Ansible

    Ansible shines when you need a single tool to handle both initial infrastructure provisioning and ongoing configuration management. Its agentless architecture and simple YAML syntax lower the barrier to entry, making it ideal for teams who want to automate quickly without a steep learning curve. It is particularly effective for orchestrating complex, multi-tier application deployments where the order of operations is critical.

    Actionable Tips for Implementation

    • Use Ansible Vault for Secrets: Securely manage sensitive data like API keys and passwords using Ansible's built-in encryption feature, Ansible Vault. This keeps your secrets out of plaintext version control.
      • Implementation Commands:
        # Create an encrypted variables file
        ansible-vault create secrets.yml
        
        # Edit an existing encrypted file
        ansible-vault edit secrets.yml
        
        # Run a playbook with the vault password
        ansible-playbook my_playbook.yml --ask-vault-pass
        
    • Organize Playbooks with Roles: Structure your automation code into "roles," which are reusable collections of tasks, handlers, variables, and templates. This promotes modularity and makes your playbooks cleaner and easier to maintain.
      • Example Role Structure:
        roles/
          ├── webserver/
          │   ├── tasks/main.yml
          │   ├── handlers/main.yml
          │   ├── templates/httpd.conf.j2
          │   └── vars/main.yml
        
    • Leverage Dynamic Inventories: For cloud environments, use dynamic inventory scripts. These scripts query your cloud provider's API to automatically generate an up-to-date list of your hosts, eliminating the need for manual inventory management.
      • Implementation Example (aws_ec2 plugin): Create a file my-aws-inventory.yml
        plugin: aws_ec2
        regions:
          - us-east-1
        filters:
          tag:Environment: production
        

        Then run your playbook: ansible-playbook -i my-aws-inventory.yml deploy.yml

    4. Pulumi

    Pulumi is a modern, open-source infrastructure as code platform that empowers developers to use familiar programming languages to manage cloud resources. Instead of learning a domain-specific language like HCL, teams can leverage Python, TypeScript, JavaScript, Go, or C# to define, deploy, and manage their infrastructure. This approach brings the full power of general-purpose languages, including loops, conditionals, functions, and classes, directly into the infrastructure provisioning process.

    One of Pulumi's key differentiators is its ability to bridge the gap between application code and infrastructure code. By using the same language for both, it enables better collaboration, code reuse, and advanced automation patterns. For example, Snowflake uses Pulumi to manage its complex cloud environment with Python, while Mercedes-Benz leverages it for their cloud transformation initiatives. This makes it a compelling infrastructure as code example for organizations seeking to unify their development and operations workflows under a single programming model.

    The ability to use real programming languages allows for more sophisticated logic and abstractions, enabling teams to build highly dynamic and reusable infrastructure components.

    Why and When to Use Pulumi

    Pulumi shines in environments where development teams are already proficient in one of its supported languages and want to avoid the context-switching of a separate DSL. It is ideal for building complex, application-aware infrastructure, where the infrastructure's configuration might depend on application logic. Using Pulumi, you can write unit and integration tests for your infrastructure code just as you would for application code, significantly improving reliability and catching errors before deployment. Its state management is similar to Terraform's, providing a reliable source of truth and safe, predictable updates.

    Actionable Tips for Implementation

    • Organize with Components: Use Pulumi Components to create high-level, reusable abstractions. A component can encapsulate a set of related resources, like a complete VPC with subnets and security groups, presenting a simple interface to consumers and hiding complexity.
      • Implementation Code (TypeScript):
        import * as pulumi from "@pulumi/pulumi";
        import * as aws from "@pulumi/aws";
        
        class VpcComponent extends pulumi.ComponentResource {
            public readonly vpcId: pulumi.Output<string>;
            public readonly publicSubnetIds: pulumi.Output<string[]>;
        
            constructor(name: string, args: {}, opts?: pulumi.ComponentResourceOptions) {
                super("custom:resource:VpcComponent", name, args, opts);
                // ... logic to create VPC, subnets, etc.
                // this.vpcId = vpc.id;
            }
        }
        
    • Implement Unit Tests: Take full advantage of using a general-purpose language by writing unit tests for your infrastructure logic. Use standard testing frameworks like Pytest for Python or Jest for TypeScript to validate resource configurations and custom logic before running pulumi up.
      • Implementation Example (Jest for TypeScript):
        // my_stack.test.ts
        import * as pulumi from '@pulumi/pulumi';
        import 'mocha';
        
        // Mock Pulumi's runtime
        pulumi.runtime.setMocks({
            // ... mock provider calls
        });
        
        describe('MyStack', () => {
            // ... your tests here
        });
        
    • Leverage Stack References: Use Stack References to share outputs between different stacks. This is crucial for managing dependencies between environments, such as allowing a production application stack to securely access the ARN of a database created in a separate production data stack.
      • Implementation Code (TypeScript):
        // In the app stack
        const dataStack = new pulumi.StackReference("my-org/data-stack/prod");
        const dbArn = dataStack.getOutput("databaseArn");
        

    5. Azure Resource Manager (ARM) Templates

    Azure Resource Manager (ARM) Templates are Microsoft's native infrastructure as code (IaC) solution for its cloud platform. These templates use a JSON-based declarative syntax to define and deploy Azure resources, from virtual machines to complex networking configurations. Instead of manual portal configurations, you define all your resources and their properties in a single JSON file, which ARM then uses to create, update, or delete resources in a consistent and repeatable manner.

    A key strength of ARM is its deep integration with the Azure ecosystem. It provides robust dependency management, parameter support, and seamless integration with Azure services like Azure Policy, Azure Blueprints, and Azure DevOps. This makes it a go-to for organizations heavily invested in the Microsoft stack. For instance, enterprises like H&R Block and GEICO leverage ARM templates to automate and standardize the deployment of their core Azure environments, ensuring compliance and operational consistency in their infrastructure as code examples.

    This native integration allows for precise control over Azure resources and their lifecycle, making it an excellent choice for Azure-centric cloud infrastructure management services.

    Why and When to Use ARM Templates

    ARM templates are the ideal choice when your infrastructure lives exclusively within the Azure cloud. They excel at orchestrating complex deployments with intricate dependencies between Azure resources, as the platform natively understands these relationships. ARM's validation engine can check your template for syntax errors and potential deployment issues before you even start, reducing the risk of failed deployments.

    The use of parameter files separates configuration from logic, allowing you to reuse the same template for different environments (e.g., dev, staging, prod) simply by swapping the parameters. This is a powerful feature for teams managing multiple application stages.

    Actionable Tips for Implementation

    • Use Linked and Nested Templates: For complex deployments, break your main ARM template into smaller, reusable linked templates. This modular approach simplifies management and makes your infrastructure definitions easier to understand and maintain.
      • Implementation Code (Main Template):
        "resources": [
          {
            "type": "Microsoft.Resources/deployments",
            "apiVersion": "2020-06-01",
            "name": "linkedStorageTemplate",
            "properties": {
              "mode": "Incremental",
              "templateLink": {
                "uri": "[uri(deployment().properties.templateLink.uri, 'linkedTemplates/storageAccount.json')]",
                "contentVersion": "1.0.0.0"
              },
              "parameters": { ... }
            }
          }
        ]
        
    • Leverage Template Functions: Use ARM's built-in functions to create dynamic values for resource names, locations, or other properties. This avoids hardcoding and makes your templates more flexible and powerful.
      • Implementation Code:
        "resources": [
          {
            "type": "Microsoft.Storage/storageAccounts",
            "name": "[concat('storage', uniqueString(resourceGroup().id))]",
            "location": "[resourceGroup().location]",
            ...
          }
        ]
        
    • Validate Before Deployment: Always use the Azure CLI or PowerShell to validate your template before deploying it. This pre-deployment check catches errors early and can save significant time and prevent misconfigurations in your environment.
      • Implementation Command (Azure CLI):
        az deployment group validate \
          --resource-group myResourceGroup \
          --template-file ./template.json \
          --parameters @./parameters.json
        

    6. Google Cloud Deployment Manager

    Google Cloud Deployment Manager is Google's native infrastructure as code (IaC) service, allowing teams to define, deploy, and manage Google Cloud Platform (GCP) resources declaratively. It uses simple YAML for configuration or, for more complex scenarios, can leverage the full power of Python or Jinja2 templates. This approach allows you to specify your desired infrastructure state, and Deployment Manager takes care of creating and configuring the resources in the correct order.

    A key advantage of Deployment Manager is its deep integration with the GCP ecosystem. As a first-party tool, it often receives day-one support for new GCP services and features. This native alignment makes it a straightforward choice for teams operating exclusively within the Google Cloud. For instance, PayPal leverages Deployment Manager to provision consistent and secure GCP environments for its financial services, while Philips Healthcare uses it to manage cloud resources for its health-tech platforms, demonstrating its value in regulated and large-scale infrastructure as code examples.

    This tight integration ensures that all API-level controls and resource options are directly available, providing granular control over your GCP infrastructure.

    Why and When to Use Google Cloud Deployment Manager

    Deployment Manager is an ideal choice when your infrastructure is entirely hosted on Google Cloud and you want a simple, native solution without introducing third-party tools. Its declarative model, combined with features like previews and dependency management, helps prevent configuration drift and ensures deployments are predictable. The ability to use Python templates also opens the door to programmatic and dynamic infrastructure generation, a powerful feature for complex, logic-driven deployments.

    If your organization is deeply invested in GCP and prefers a native toolset that aligns perfectly with Google's services and IAM policies, Deployment Manager is a highly effective option.

    Actionable Tips for Implementation

    • Start Simple with YAML: Begin with basic YAML files to define your resources. This is the easiest entry point for learning Deployment Manager and is sufficient for many common use cases like provisioning a VM instance or a Cloud Storage bucket.
      • Implementation Code (YAML):
        resources:
        - name: my-first-vm
          type: compute.v1.instance
          properties:
            zone: us-central1-a
            machineType: zones/us-central1-a/machineTypes/e2-medium
            # ... other properties
        
    • Embrace Python for Complexity: When your configurations require conditional logic, loops, or dynamic property generation, transition to Python templates. This allows you to create sophisticated, reusable, and maintainable infrastructure blueprints that YAML alone cannot support.
      • Implementation Example (Python Template Logic):
        # vm_template.py
        def GenerateConfig(context):
            resources = []
            for i in range(context.properties['num_vms']):
                resources.append({
                    'name': f"vm-instance-{i}",
                    'type': 'compute.v1.instance',
                    # ... properties
                })
            return {'resources': resources}
        
    • Organize and Reuse with Composite Types: Group related resources into reusable units called composite types. Think of these as modules or building blocks, such as a complete web server stack (instance, firewall rule, disk), which you can then deploy as a single entity, simplifying management and reducing boilerplate.
    • Validate with Schemas: Implement schema files for your templates. Schemas define the rules and constraints for your template properties, ensuring that anyone using the template provides valid inputs and helping to catch errors before deployment begins.

    7. CDK (AWS Cloud Development Kit)

    The AWS Cloud Development Kit (CDK) is an open-source software development framework that empowers developers to define cloud infrastructure using familiar, high-level programming languages like TypeScript, Python, Java, and C#. Instead of writing YAML or JSON, you write imperative code that describes your resources. This code is then synthesized into a standard AWS CloudFormation template, effectively giving you the best of both worlds: the expressive power of a programming language and the reliability of AWS's native provisioning engine.

    This approach transforms infrastructure management into a software development discipline, enabling practices like code completion, inheritance, and unit testing for your cloud resources. This is a significant evolution in infrastructure as code examples, where companies like Stripe and Liberty Mutual leverage the AWS CDK to accelerate the development of serverless applications and manage complex AWS environments with greater agility and confidence.

    The ability to use logic, loops, and object-oriented principles allows teams to create powerful, reusable abstractions for their infrastructure, dramatically reducing boilerplate and enforcing best practices.

    Why and When to Use CDK

    The AWS CDK is the ideal choice for development teams heavily invested in the AWS ecosystem who prefer to manage infrastructure using the same tools and languages they use for application code. It excels when you need to build complex or highly dynamic infrastructure, as you can use programming logic to generate resource configurations. This is particularly powerful for creating scalable, multi-tenant SaaS architectures or automated environments for development and testing.

    Use CDK when your team values high-level abstractions and wants to move faster. Instead of defining every granular detail of a VPC, for instance, you can use a high-level construct that encapsulates AWS best practices, provisioning an entire production-ready network with just a few lines of code.

    Actionable Tips for Implementation

    • Start with High-Level Constructs: Leverage the AWS Construct Library to its fullest. These pre-built, opinionated components (L2 and L3 constructs) encapsulate best practices and significantly reduce the amount of code you need to write for common patterns like a Fargate service or a Lambda function connected to an API Gateway.
      • Implementation Code (TypeScript L2 Construct):
        import * as ec2 from 'aws-cdk-lib/aws-ec2';
        import * as ecs from 'aws-cdk-lib/aws-ecs';
        import * as ecs_patterns from 'aws-cdk-lib/aws-ecs-patterns';
        
        // High-level construct that creates a Fargate service, task definition,
        // container, and load balancer with a single object.
        new ecs_patterns.ApplicationLoadBalancedFargateService(this, 'MyFargateService', {
          taskImageOptions: {
            image: ecs.ContainerImage.fromRegistry('amazon/amazon-ecs-sample'),
          },
          publicLoadBalancer: true,
        });
        
    • Write Unit Tests for Infrastructure: Since your infrastructure is now defined in code, treat it like any other application. Write unit tests to validate your constructs' properties and ensure that changes don't introduce regressions or security vulnerabilities. This is a key advantage of CDK over declarative-only tools.
    • Use cdk diff Religiously: Before deploying, always run the cdk diff command. This command compares your current stack definition against the deployed version and provides a detailed summary of all pending changes, including security-sensitive modifications. This serves as a final, critical sanity check.
      • Implementation Commands:
        # Synthesize the CloudFormation template
        cdk synth
        
        # Preview changes before deployment
        cdk diff
        
        # Deploy the stack
        cdk deploy
        

    7 Key Infrastructure as Code Tools Compared

    Tool Implementation Complexity Resource Requirements Expected Outcomes Ideal Use Cases Key Advantages
    Terraform by HashiCorp Moderate to high (HCL syntax) Requires state file storage Multi-cloud infrastructure provisioning, drift detection Multi-cloud, reusable modules Cloud-agnostic, strong state management, large ecosystem
    AWS CloudFormation Moderate (JSON/YAML templates) AWS-native, no extra cost AWS resource provisioning with rollback and dependency management AWS-only cloud infrastructure Deep AWS integration, automatic rollback, native service
    Ansible Low to moderate (YAML playbooks) Agentless orchestration System config, app deployment, hybrid infrastructure management Configuration management, hybrid clouds Agentless, easy YAML syntax, strong config management
    Pulumi High (general-purpose languages) Supports multi-language IDEs Programmable infrastructure with testing and abstraction Developers using real languages Uses real programming languages, testing, code reuse
    Azure Resource Manager (ARM) Moderate (complex JSON syntax) Azure-native, no extra cost Azure resources provisioning with parameterization and validation Azure cloud infrastructure Deep Azure integration, parameter support, rollback
    Google Cloud Deployment Manager Moderate (YAML/Python templates) GCP-native, no extra cost GCP resource deployment with flexible templating GCP cloud infrastructure Flexible template languages, schema validation
    AWS Cloud Development Kit (CDK) High (programming languages) AWS-native, compiles to CloudFormation AWS infrastructure as code with high-level abstractions and testing Developers building AWS infra Familiar languages, strong IDE support, reusable constructs

    Final Thoughts

    Our deep dive into these real-world infrastructure as code examples has illuminated a fundamental truth: IaC is no longer a niche practice but the bedrock of modern, scalable, and resilient software delivery. Moving beyond theoretical discussions, we've analyzed tangible code from Terraform, CloudFormation, Ansible, Pulumi, and others to uncover the strategic thinking that separates a simple script from a robust, production-grade deployment pipeline. The examples showcased aren't just templates to be copied; they are blueprints for a new operational mindset.

    The core lesson is that the choice of tool is often secondary to the principles you apply. Whether you prefer Terraform's declarative HCL, Pulumi's imperative code, or Ansible's procedural playbooks, the most successful implementations share common threads: modularity, reusability, and idempotency. Breaking down complex systems into smaller, manageable modules, as seen in our Terraform and Pulumi examples, is critical for maintainability and team collaboration.

    Key Takeaways and Strategic Next Steps

    To translate these insights into action, your focus should shift from "what tool to use" to "how to build a sustainable IaC practice." Based on our analysis, here are the most critical, actionable takeaways to implement immediately:

    • Embrace a Modular Architecture: Start every new project by thinking in modules. Before writing a single line of code, ask yourself: "How can I break this system into reusable components?" This applies to a Terraform module for a VPC, an Ansible role for a web server, or a Pulumi component for a serverless application. This approach reduces code duplication and speeds up future deployments.
    • Implement Strict State Management: As demonstrated with Terraform and CloudFormation, managing your state file is non-negotiable. Immediately implement remote state backends (like an S3 bucket or Azure Blob Storage) with locking mechanisms. This is the single most important step to prevent configuration drift and enable safe collaboration.
    • Integrate IaC into CI/CD Early: Do not treat Infrastructure as Code as a separate, manual task. Your next step should be to integrate tools like terraform plan or pulumi preview directly into your pull request pipeline. This provides automated validation and a clear audit trail, making infrastructure changes as transparent and reliable as application code changes.
    • Prioritize Security with Policy as Code: Advance your practice by integrating security and compliance checks directly into your IaC workflow. Tools like Open Policy Agent (OPA) or Sentinel can enforce rules, such as preventing the creation of public S3 buckets or ensuring all databases are encrypted, before any infrastructure is ever provisioned.

    Mastering these infrastructure as code examples is about more than just automating server deployment. It's about codifying your operational knowledge, enabling self-service for development teams, and building a foundation for elite-level DevOps performance. As you consider integrating Infrastructure as Code into your strategy to master DevOps, it's also insightful to explore broader industry discussions, such as those that propose completely different paradigms for managing operations. Some thought leaders are even exploring alternative approaches to traditional DevOps, pushing the boundaries of what's possible in operational efficiency.

    Ultimately, the journey through these IaC patterns equips you to build not just products, but platforms for innovation. By transforming your infrastructure into a version-controlled, testable, and automated asset, you unlock unprecedented speed and reliability, allowing your organization to focus on what truly matters: delivering value to your customers.


    Ready to implement these advanced IaC strategies but need expert guidance to ensure it's done right? OpsMoon offers on-demand, elite DevOps and SRE expertise to help you build, scale, and manage your cloud infrastructure with precision. Let our freelance platform engineers help you turn these OpsMoon examples into a production-ready reality.

  • Become a Remote DevOps Engineer | A Technical Career Guide

    Become a Remote DevOps Engineer | A Technical Career Guide

    A remote DevOps engineer is a specialist who bridges the gap between software development (Dev) and IT operations (Ops) from a distributed location. Their primary mandate is to automate and streamline the entire software delivery lifecycle—from code commit to production deployment and monitoring. This is achieved by implementing a culture of collaboration and leveraging a specific stack of tools to build, test, and release software with greater speed, reliability, and security.

    Why Remote DevOps Engineers Are in Such High Demand

    In the current technology landscape, velocity and resilience are non-negotiable for business survival. Companies must deploy updates, patch vulnerabilities, and launch features at an unprecedented pace. The remote DevOps engineer is the architect of the automated systems that make this possible.

    Traditionally, software development was a siloed, sequential process. Developers wrote code, threw it "over the wall" to QA, who then passed it to operations for deployment. This created bottlenecks, miscommunication, and lengthy release cycles. A DevOps engineer dismantles these walls by building a shared, automated pipeline that unifies development and operations. When this engineer can architect and manage this entire process from anywhere, they become an invaluable asset for a modern, distributed company.

    The Business Case for DevOps

    The value of a remote DevOps engineer is not purely technical; it directly impacts key business metrics by solving critical operational challenges:

    • Accelerated Time-to-Market: By implementing a fully automated CI/CD pipeline, software moves from a developer's commit to production in minutes, not weeks.
    • Enhanced Scalability and Resilience: They design cloud-native infrastructure using principles like Infrastructure as Code (IaC) and container orchestration, allowing systems to auto-scale during traffic spikes and self-heal from component failures.
    • Hardened Security Posture (DevSecOps): By integrating security scanning and policy enforcement directly into the CI/CD pipeline, they shift security "left," creating applications that are secure by design, not by audit.

    The Surge in Remote-First Roles

    The demand for DevOps expertise has exploded, particularly for remote positions. IT hiring has fundamentally shifted towards cloud-native, location-independent talent. A recent report found that 29% of IT teams globally have recently hired a DevOps engineer, making it the single most recruited role in tech.

    This boom is massively fueled by the move to hybrid and remote work, with nearly one-third of all DevOps professionals now working primarily from home. You can dig into the full breakdown of these trends and see how tools like Docker and Kubernetes are shaping the role on Brokee.io.

    This isn't just a fleeting trend. It’s a fundamental change in how great software gets built and maintained. The remote DevOps engineer is the glue holding distributed development and operations teams together in this new reality.

    Ultimately, the intense demand for remote DevOps engineers is rooted in their proven ability to deliver speed, stability, and scale—the three technical pillars that support all modern digital enterprises.

    Mastering the Remote DevOps Technical Stack

    A top-tier remote DevOps engineer is the architect and mechanic of the digital superhighways our software runs on. This requires a deep, hands-on command of the specific tools that drive automation, scalability, and observability, especially when managing distributed systems.

    To excel, you must prove you can design, build, and manage a cloud-native infrastructure from the command line. It's less about a long list of buzzwords and more about demonstrating how specific tools integrate to form a cohesive, automated delivery pipeline.

    The infographic below lays out the core domains of expertise. Think of it as a map showing how different toolsets connect to form a cohesive technical stack.

    Image

    As you can see, it’s all about integration. Knowing how these pieces fit is what separates a good engineer from a great one.

    Infrastructure as Code (IaC)

    IaC is the practice of managing and provisioning infrastructure through machine-readable definition files, rather than physical hardware configuration or interactive configuration tools. It is the bedrock of modern DevOps, enabling repeatable, auditable, and version-controlled environments—critical for remote teams.

    • Terraform: The de-facto standard for cloud-agnostic provisioning. You define your desired state in HashiCorp Configuration Language (HCL), and Terraform executes a plan to create, update, or destroy resources to match that state.
    • Ansible: An agentless configuration management tool used for post-provisioning tasks. Once Terraform creates a VM, Ansible can connect via SSH to install packages, apply security policies, and configure services using simple YAML-based playbooks.

    Continuous Integration and Delivery (CI/CD)

    A CI/CD pipeline is the automated workflow that moves code from a developer's commit to a production environment. For a remote team, this pipeline is the central nervous system for collaboration, enforcing quality gates and providing a transparent deployment process.

    A well-architected CI/CD pipeline is the ultimate force multiplier for a remote DevOps engineer. It codifies best practices, slashes manual effort, and provides a transparent, automated path from a developer's machine to the end user.

    Tools like GitLab CI, GitHub Actions, and Jenkins power these pipelines. A skilled remote engineer must be fluent in defining multi-stage YAML pipelines, managing build artifacts in object storage, and integrating static analysis security testing (SAST) tools directly into the workflow.

    Containers and Orchestration

    Containers provide OS-level virtualization by packaging an application and its dependencies into a single, portable unit. This solves the "it works on my machine" problem by ensuring consistency across all environments.

    • Docker: The primary tool for building and running containers. A remote DevOps engineer uses a Dockerfile to define the image layers, creating a lightweight, immutable artifact that can be deployed anywhere.
    • Kubernetes: The leading container orchestration platform. When deploying at scale, Kubernetes automates the deployment, scaling, networking, and self-healing of containerized applications. Proficiency in Kubernetes, including concepts like Deployments, Services, and Ingress, is a core requirement for nearly every senior remote DevOps role.

    Observability and Monitoring

    You can't fix what you can't see. Observability is the practice of instrumenting systems to collect metrics, logs, and traces, providing deep insight into their internal state. This is critical in a remote setting for rapid incident response.

    • Prometheus: An open-source monitoring and alerting toolkit. It scrapes time-series metrics from configured endpoints, stores them efficiently, and allows for powerful queries using its native query language, PromQL.
    • Grafana: The visualization layer for your metrics. Grafana connects to data sources like Prometheus to build interactive dashboards for monitoring system health, diagnosing performance bottlenecks, and spotting anomalous trends.

    To bring this all together, here’s a look at how some of these popular tools stack up against each other in a typical remote DevOps toolchain.

    Essential Remote DevOps Toolchain Comparison

    This table helps illustrate the different options available across the key DevOps categories. While some tools are clear leaders, knowing the alternatives can be incredibly valuable depending on the project's specific needs.

    Category Primary Tool (Example) Alternative Tool (Example) Key Use Case
    Infrastructure as Code Terraform Pulumi, AWS CDK Defining and provisioning cloud infrastructure using code.
    Configuration Management Ansible Chef, Puppet Automating software installation and system configuration.
    CI/CD GitLab CI / GitHub Actions Jenkins, CircleCI Automating the build, test, and deployment of applications.
    Containerization Docker Podman Packaging applications and their dependencies into portable units.
    Container Orchestration Kubernetes Docker Swarm, Nomad Managing and scaling containerized applications automatically.
    Monitoring & Metrics Prometheus Datadog, InfluxDB Collecting time-series data and metrics from systems.
    Visualization & Logging Grafana Kibana (ELK Stack) Creating dashboards and analyzing logs for observability.

    Choosing the "right" tool often depends on your team's existing skills, your cloud provider, and the specific problems you're trying to solve. But mastering the primary tools in each category will make you a highly effective and sought-after remote DevOps engineer.

    The Financial Case for a Remote DevOps Career

    Image

    Choosing a career is a major financial decision. For a remote DevOps engineer, the compensation data tells a compelling story. This role is a financial powerhouse, driven by intense demand for a highly specific and valuable skill set.

    The premium salary exists because DevOps engineers directly influence development velocity and operational stability—the two pillars supporting a modern software business. Companies willingly pay top dollar for an expert who can optimize both.

    Understanding Your Market Value

    To maximize your earning potential, you must understand your market worth. Data consistently shows that experienced DevOps engineers in the U.S. command average base salaries between $160,000 to $170,000 annually. For principal engineers or those with specialized Site Reliability Engineering (SRE) skills, total compensation can climb as high as $297,000.

    The best part? This isn't just for people living in expensive tech hubs. Data shows that 51% of all DevOps positions on the market are remote. This proves that you don't need to be tied to a specific office to command a top-tier salary.

    This is a global phenomenon. In burgeoning tech markets like India, a senior DevOps role can command salaries from ₹12 to ₹18 lakh annually. This demand is fueled by a very real 37% skills gap in IT leadership—a gap that companies are scrambling to fill with qualified remote talent.

    Before entering negotiations, you must conduct thorough market salary research. Walking into a negotiation armed with real data is the only way to ensure you're compensated fairly.

    Future Growth and Long-Term Stability

    Beyond the immediate financial benefits, the long-term career trajectory for a remote DevOps engineer is exceptionally secure. The core competencies—cloud architecture, CI/CD automation, and container orchestration—are foundational to the future of technology.

    As more enterprises migrate to the cloud and embrace automation, the demand for these skills will only accelerate. This is a field defined by continuous learning, which translates directly into career and financial growth. As you master new technologies and architectures, your value to any organization increases exponentially. It’s a clear path for advancement. If you're looking to see what's out there right now, check out our guide on finding the best remote DevOps engineer jobs.

    Think of it this way: this isn't just a job. It's a strategic investment in a skill set that's essentially future-proof.

    Communicating Effectively in a Distributed Team

    Technical expertise gets you the interview; communication skills get you the job and make you successful as a remote DevOps engineer. In a distributed team, you cannot rely on informal, high-context communication like walking over to a colleague's desk.

    Success hinges on mastering asynchronous communication and building trust through deliberate, high-fidelity interactions. Every piece of written communication—a pull request description, a Jira ticket update, a Slack message—must be clear, concise, and context-rich. A vague bug report or a pull request with a one-line description can stall a project for hours. In a remote environment, your words are your most critical tool.

    Mastering Asynchronous Collaboration

    For most distributed teams, asynchronous work is the default operating mode. This requires a fundamental shift from real-time communication to creating durable, high-quality artifacts that empower your teammates to work independently. The objective is to provide everything another engineer needs to unblock themselves without needing a synchronous meeting with you.

    Key actionable practices include:

    • Writing Production-Ready Documentation: Your infrastructure diagrams, runbooks, and incident post-mortems must be so clear that a new hire can understand and execute them without assistance. This is a core job function, not an afterthought.
    • Crafting Atomic, High-Context Pull Requests (PRs): A good PR is a self-contained story. It should link to the corresponding ticket, summarize the problem it solves (the why), detail the technical implementation (the how), and provide clear testing instructions.
    • Using Communication Tools with Intent: Tools like Slack and Jira are essential. A well-structured Jira ticket with clear acceptance criteria is infinitely more valuable than a fragmented conversation in a noisy Slack channel. Use threads religiously to keep conversations organized.

    The foundation of any successful distributed team is trust. And that trust is built brick-by-brick through clear, consistent, and proactive communication. When you truly own your work and are transparent about your progress, you become a pillar your team can rely on.

    Proactive Ownership and Building Trust

    In an office, physical presence creates visibility. Remotely, demonstrated ownership is your visibility. This isn't about being "online" constantly; it's about being proactive and transparent.

    Anticipate and flag potential issues. Communicate blockers as soon as they arise, along with potential solutions. Share your learnings in public channels. This is how you build the social capital and deep-seated trust that high-performing remote teams run on. Given the distributed nature of remote work, mastering effective communication also involves understanding how to improve team collaboration.

    At the end of the day, the best remote DevOps engineers know their job extends far beyond the command line. They are expert communicators who understand that the entire DevOps methodology is about demolishing silos between teams—a goal that demands stellar communication, especially when those teams are thousands of miles apart.

    Building Your Hands-On DevOps Portfolio

    Image

    Theoretical knowledge is insufficient for landing a top-tier remote DevOps role. A portfolio of projects demonstrating hands-on expertise is what truly distinguishes a candidate. Hiring managers need tangible evidence that you can design, build, automate, and manage cloud infrastructure effectively. This is where you translate concepts into a compelling, hirable narrative.

    Your primary goal is to build a project that mirrors a real-world DevOps workflow, demonstrating core competencies in Infrastructure as Code (IaC), CI/CD, and containerization. A single, well-executed project is your proof of practical skill.

    Setting Up Your Personal Cloud Lab

    First, you need a development environment. Your personal cloud lab is where you will build and test. Fortunately, major cloud providers like AWS, GCP, and Azure offer generous free tiers sufficient for building a professional-grade portfolio project at no cost.

    Sign up for a free-tier account with your preferred provider. This process itself is valuable experience, as it familiarizes you with the provider's console, identity and access management (IAM), and billing alerts—daily concerns for a DevOps professional.

    The Core Project: Deploying a Containerized Application

    Here is a blueprint for a portfolio project that will demonstrate the most in-demand skills for a remote DevOps engineer: deploying a simple, containerized web application with a fully automated pipeline.

    Here’s a step-by-step technical breakdown:

    1. Containerize the App: Begin with a basic web application (e.g., Python Flask or Node.js Express). Create a Dockerfile that builds a production-ready, multi-stage image to keep it small and secure. This demonstrates your understanding of containerization best practices.

    2. Define Infrastructure with Terraform: Write Terraform code (.tf files) to provision the necessary cloud infrastructure. This should include a virtual private cloud (VPC) with public/private subnets, security groups, and a managed Kubernetes cluster (e.g., AWS EKS, GCP GKE, Azure AKS). A critical best practice is to configure a remote backend (e.g., an S3 bucket with state locking via DynamoDB) for your Terraform state. This proves you understand how to manage infrastructure state collaboratively and safely.

    3. Build a CI/CD Pipeline: Use GitHub Actions to create a workflow (.github/workflows/main.yml) that automates the entire process. The pipeline should trigger on a push to the main branch and execute the following stages:

      • Lint & Test: Run static analysis and unit tests on the application code.
      • Build & Push: Build the Docker image and push it to a container registry (e.g., Docker Hub, Amazon ECR).
      • Deploy: Use kubectl or a GitOps tool like Argo CD to apply the Kubernetes manifests and deploy the new image version to your cluster.

    By building this, you’re doing more than just showing you know a few tools. You are proving you can weave them into a seamless, automated system that takes code from a developer's machine to production. That is the absolute essence of DevOps.

    To execute this project, strong scripting skills are essential. It's highly recommended to work through some hands-on shell scripting and DevOps projects to solidify your foundation.

    Documenting Your Project on GitHub

    Your GitHub repository is your portfolio. Treat it as a professional product. A well-documented repository is a strong signal to hiring managers.

    Your README.md file must be a comprehensive guide and should include:

    • A clear, high-level overview of the project's purpose and architecture.
    • An architecture diagram (created with a tool like diagrams.net) that visually explains the flow of data and services.
    • Explicit, step-by-step instructions on how to clone, configure, and deploy the project.
    • A detailed breakdown of the CI/CD pipeline, explaining the purpose of each job and step.

    This level of documentation demonstrates the strong communication and asynchronous collaboration skills required of any successful remote DevOps engineer.

    Finding and Winning a Top Remote DevOps Role

    Landing a top-tier remote DevOps engineer role requires more than a standard resume. You are not just proving technical competence; you are proving you can be a high-impact engineer in a distributed environment. The key is to demonstrate tangible results and a deep understanding of business-centric problem-solving.

    Your resume must be impact-oriented. Avoid generic statements like "managed CI/CD pipelines." Instead, quantify your achievements. Reframe every bullet point as a result. For example: "Reduced deployment times by 40% by re-architecting GitLab CI pipelines, leading to a 15% increase in feature release velocity." This demonstrates that you solve business problems, not just use tools.

    Decoding Job Descriptions and Acing Interviews

    To gain a competitive edge, you must learn to interpret job descriptions. A company isn't just looking for a technologist; they are seeking a problem-solver who understands the why behind technical decisions.

    When a job description lists "strong experience with Kubernetes," they are implicitly asking:

    • Can you design a resilient, self-healing system that can withstand node failures?
    • Do you have a strategy for managing stateful applications and secrets within the cluster?
    • Can you implement a secure GitOps workflow that provides an auditable trail of all changes to the cluster state?

    Your interview strategy must address these underlying questions. Be prepared for system design interviews and hands-on technical challenges. When asked about your choice of tools, always justify your decision by linking it back to business goals like reliability, cost optimization, or security posture.

    The global DevOps market is exploding, projected to hit around $81.1 billion USD by 2033. This massive growth is driven by one thing: the shift to remote work. A deep dive into over 25,000 job postings revealed that a staggering 33% of all DevOps positions are now fully remote. That’s not a trend; it's the new standard. To see the full data, check out the Kubernetes and DevOps job market report.

    Where to Find Quality Remote Roles

    While general job boards can be a starting point, the highest quality roles are often found on specialized platforms focused on remote work and technology.

    Better still, engage with the community. Become an active participant in DevOps-focused LinkedIn groups, Subreddits, or niche Slack/Discord communities. Many of the best opportunities are filled through networking and referrals before they are ever publicly posted.

    Winning a premier remote role is a combination of deep technical expertise and exceptional communication. Show what you have built, articulate its impact, and demonstrate that you understand the business's underlying needs.

    If you want a curated list of high-quality openings, you can check out our regularly updated board of DevOps work opportunities.

    Got a few more questions? Let's dig into some of the common things people ask about what it's really like to be a remote DevOps engineer.

    What Is the Biggest Challenge for a Remote DevOps Engineer?

    The single greatest technical challenge is combating infrastructure drift in a distributed team.

    Infrastructure drift occurs when the actual state of your cloud environment deviates from the state defined in your version-controlled code (e.g., your Terraform files). This is often caused by manual, "out-of-band" changes made directly in the cloud console, typically during an emergency incident response, which are then not back-ported to the code.

    These untracked changes accumulate over time, creating a "snowflake" environment that is impossible to reproduce, leading to failed deployments, unpredictable behavior, and security vulnerabilities. A great remote DevOps engineer mitigates this by enforcing strict GitOps principles and implementing automated drift detection tools that regularly compare the live environment against the desired state in Git.

    How Does DevSecOps Apply in a Remote Context?

    DevSecOps—integrating security practices into every phase of the software lifecycle—is even more critical in a remote setting. A distributed workforce inherently expands the attack surface, making automated security controls non-negotiable.

    For a remote team, this means implementing:

    • Automated Security Scanning in CI/CD: Integrate Static Application Security Testing (SAST), Dynamic Application Security Testing (DAST), and software composition analysis (SCA) tools directly into the pipeline. This provides immediate feedback to developers and prevents vulnerabilities from reaching production.
    • Centralized Secret Management: Enforce the use of a secret management system like HashiCorp Vault or AWS Secrets Manager. Credentials, API keys, and certificates must never be hard-coded in Git repositories.
    • Immutable Infrastructure: Treat infrastructure components as ephemeral. Instead of patching a live server, a new, patched image is built, and the old server is destroyed and replaced. This eliminates configuration drift and ensures a consistent, secure baseline.

    What Does a Typical Day Look Like?

    There is no "typical" day, but the role revolves around a set of core activities:

    • Asynchronous Communication: A significant portion of the day is spent writing: detailed pull request descriptions, clear updates in Jira tickets, and comprehensive documentation in a wiki (like Confluence).
    • Pipeline Management: Monitoring CI/CD pipelines, debugging failed builds, and optimizing stages for speed and reliability.
    • Infrastructure as Code Development: Writing or modifying IaC files using tools like Terraform or Ansible to provision new environments or update existing infrastructure.
    • Incident Response: Responding to alerts from monitoring systems like Prometheus and Grafana, triaging issues, and collaborating with developers on a video call or Slack huddle to troubleshoot production problems.

    It's a continuous blend of proactive architectural work and reactive problem-solving, all orchestrated through clear, precise, written communication.


    Ready to scale your operations with elite talent? OpsMoon connects you with the top 0.7% of remote DevOps engineers. Start with a free work planning session and let us build your high-performance team. Get started with OpsMoon today.
  • Mastering Site Reliability Engineering Principles

    Mastering Site Reliability Engineering Principles

    At its core, Site Reliability Engineering (SRE) applies a software engineering mindset to solve infrastructure and operations problems. The objective is to build highly reliable and scalable software systems by automating operational tasks, defining reliability with quantitative metrics, and striking a data-driven balance between deploying new features and ensuring system stability.

    Why Modern Systems Need SRE

    Image

    As digital services scale in complexity and users expect zero downtime, traditional operational models are no longer viable. The classic paradigm—where a development team "throws code over the wall" to a siloed operations team—creates a critical bottleneck. This forces a false choice: either decelerate innovation or accept declining system reliability.

    Site Reliability Engineering (SRE) was conceived to resolve this conflict. It reframes operations not as a manual, reactive chore, but as a proactive software engineering challenge. Instead of merely firefighting when systems break, SRE focuses on engineering systems that are inherently resilient to failure.

    The Origin of SRE

    The discipline was established at Google in 2003 to manage explosive system growth. The siloed structure of development and operations teams was leading to frequent outages and significant delays in feature releases. To address this, a team led by Ben Treynor Sloss began applying engineering principles to operations, aggressively automating repetitive work and building sophisticated monitoring platforms.

    This new methodology proved highly effective, dramatically improving system reliability and setting a new industry standard. For a deeper historical context, LogRocket has a great overview of SRE's origins.

    This fundamental shift in mindset is the key to SRE. It creates a sustainable, data-driven framework where development velocity and operational stability are aligned, not opposed. Adopting this discipline provides significant technical and business advantages:

    • Improved System Reliability: By treating reliability as a core feature with quantifiable goals—not an afterthought—SRE makes systems more resilient and consistently available.
    • Faster Innovation Cycles: Data-driven error budgets provide a quantitative framework for risk assessment, allowing teams to release features confidently without guessing about the potential impact on stability.
    • Reduced Operational Cost: Ruthless automation eliminates manual toil, freeing up engineers to focus on high-value projects that deliver lasting architectural improvements.

    Defining Reliability With SLOs And Error Budgets

    In Site Reliability Engineering, reliability is not a qualitative goal; it's a number that is tracked, measured, and agreed upon. This is where the core site reliability engineering principles are implemented, built on two foundational concepts: Service Level Objectives (SLOs) and Error Budgets.

    These are not abstract terms. They are practical, quantitative tools that provide a shared, data-driven language to define, measure, and manage service stability. Instead of pursuing the economically unfeasible goal of 100% uptime, SRE focuses on what users actually perceive and what level of performance is acceptable.

    From User Happiness To Hard Data

    The process begins by identifying the user-critical journeys. Is it API response time? Is it the success rate of a file upload? This defines what needs to be measured.

    This brings us to the Service Level Indicator (SLI). An SLI is a direct, quantitative measurement of a specific aspect of your service's performance that correlates with user experience.

    Common SLIs used in production environments include:

    • Availability: The proportion of valid requests served successfully. Typically expressed as a ratio: (successful_requests / total_valid_requests) * 100.
    • Latency: The time taken to service a request, measured in milliseconds (ms). It is crucial to measure this at specific percentiles (e.g., 95th, 99th, 99.9th) to understand the experience of the majority of users, not just the average.
    • Error Rate: The percentage of requests that fail with a specific error class, such as HTTP 5xx server errors. Calculated as (failed_requests / total_requests) * 100.
    • Throughput: The volume of requests a system handles, often measured in requests per second (RPS). This is a key indicator for capacity planning.

    Once you are instrumenting and collecting SLIs, you can define a Service Level Objective (SLO). An SLO is a specific target value or range for an SLI, measured over a defined compliance period (e.g., a rolling 30 days). This is the internal goal your team formally commits to achieving.

    SLO Example: “Over a rolling 28-day period, the 95th percentile (p95) latency for the /api/v1/checkout endpoint will be less than 300ms, as measured from the load balancer.”

    This statement is technically precise and powerful. It transforms ambiguous user feedback like "the site feels slow" into a concrete, measurable engineering target that aligns engineers, product managers, and stakeholders.

    The image below illustrates the hierarchical relationship between these concepts, showing how specific indicators inform the broader objective for a service.

    As you can see, SLIs are the granular, raw data points that serve as the building blocks for defining what success looks like in your SLO.

    To further clarify these concepts, let's compare SLIs, SLOs, and their contractual cousin, SLAs.

    SLI vs SLO vs SLA Explained

    While the acronyms are similar, their functions are distinct. SLIs are the raw measurements, SLOs are the internal engineering targets based on those measurements, and SLAs are the external, contractual promises made to customers.

    Metric What It Measures Primary Audience Consequence of Failure
    SLI A direct, quantitative measure of a service's behavior (e.g., p99 latency, error rate). Internal Engineering & Product Teams Informs SLOs; no direct consequence.
    SLO An internal target for an SLI over time (e.g., 99.95% availability over 30 days). Internal Engineering & Product Teams Triggers an Error Budget policy violation and freezes risky changes.
    SLA A formal, contractual agreement with customers about service performance. External Customers & Legal Teams Financial penalties, service credits, or contract termination.

    Understanding this hierarchy is critical. You cannot set a meaningful SLO without a well-defined SLI, and you should never commit to an SLA that is stricter than your internal SLOs.

    The Power Of The Error Budget

    This is where the SRE model becomes truly actionable. The moment you define an SLO, you implicitly create an Error Budget. It is the mathematical inverse of your objective—the precise, quantifiable amount of unreliability you are willing to tolerate.

    If your availability SLO is 99.95%, your error budget is the remaining 0.05%. This is not an acceptance of failure; it is a budget for risk. The error budget becomes the currency for innovation.

    This concept is central to how Google's SRE teams operate. SLOs serve as the north star for reliability, while error budgets determine the pace of feature deployment. For example, a 99.9% uptime SLO translates to an error budget of approximately 43.8 minutes of downtime per 30-day period. Once that budget is consumed, a pre-agreed policy is enacted: all non-essential feature deployments are frozen until the budget is replenished.

    The error budget empowers development teams with data-driven autonomy. If the budget is healthy, the team can ship a new feature, run a performance experiment, or perform risky infrastructure maintenance. If a series of incidents exhausts the budget, the team’s sole priority shifts to hardening the system and restoring the SLO.

    This creates a self-regulating system that programmatically balances innovation against stability. You can dive deeper into the nuances of service reliability engineering in our comprehensive guide.

    In Site Reliability Engineering, toil is the primary adversary.

    Toil is defined as manual, repetitive, automatable, tactical work that has no enduring engineering value and scales linearly with service growth. Restarting a server, manually provisioning a database, or running a script to clear a cache are all examples. Performing such a task once is an operation. Performing it weekly is toil, and it is an inefficient use of skilled engineering resources.

    A core SRE principle is the imperative to automate repetitive tasks. This is not merely for convenience; it is about systematically freeing engineers to focus on high-leverage work: building, innovating, and solving complex architectural problems.

    This relentless drive for automation goes beyond time savings. Every manual intervention is an opportunity for human error, introducing inconsistencies that can cascade into major outages. Automation enforces configuration consistency, hardens systems against configuration drift, and makes every process deterministic, auditable, and repeatable.

    The goal is to treat operations as a software problem. The solution is not more engineers performing manual tasks; it's better automation code.

    The 50% Rule for Engineering

    How do you ensure you are systematically reducing toil? A foundational guideline from SRE teams at Google is the "50% Rule."

    The principle is straightforward: SRE teams must cap time spent on operational work (toil and on-call duties) at 50%. The remaining 50% (or more) must be allocated to engineering projects that provide long-term value, such as building automation tools, enhancing monitoring systems, or re-architecting services for improved reliability.

    This rule is not arbitrary; it establishes a self-correcting feedback loop. If toil consumes more than 50% of the team's time, it is a signal that the system is unstable or lacks sufficient automation. It becomes the team's top engineering priority to automate that toil away. This mechanism forces investment in permanent solutions over getting trapped in a reactive cycle of firefighting.

    From Manual Tasks to Self-Healing Systems

    Eliminating toil is a systematic process. It begins with quantifying where engineering time is being spent, identifying the most time-consuming manual tasks, and prioritizing automation efforts based on their potential return on investment.

    The evolution from manual intervention to a fully automated, self-healing system typically follows a clear trajectory.
    Common Targets for Automation:

    • Infrastructure Provisioning: Manual server setup is obsolete. SREs utilize Infrastructure as Code (IaC) with tools like Terraform, Pulumi, or Ansible. This allows the entire infrastructure stack to be defined in version-controlled configuration files, enabling the creation or destruction of entire environments with a single command—deterministically and flawlessly.
    • Deployment Pipelines: Manual deployments are unacceptably risky. Automated canary or blue-green deployment strategies drastically reduce the blast radius of a faulty release. An intelligent CI/CD pipeline can deploy a change to a small subset of traffic, monitor key SLIs in real-time, and trigger an automatic rollback at the first sign of degradation, often before a human is even alerted.
    • Alert Remediation: Many alerts have predictable, scriptable remediation paths. A self-healing system is designed to execute these fixes automatically. For example, a "low disk space" alert can trigger an automated runbook that archives old log files or extends a logical volume, resolving the issue without human intervention.

    By converting manual runbooks into robust, tested automation code, you are not just eliminating toil. You are codifying your team's operational expertise, making your systems more resilient, predictable, and scalable.

    Engineering for Resilience and Scale

    Image

    True reliability cannot be added as a final step in the development lifecycle. It must be designed into the architecture of a system from the initial design phase.

    This is a core tenet of SRE. We don't just react to failures; we proactively engineer services designed to withstand turbulence. This requires early engagement with development teams to influence architectural decisions, ensuring that when components inevitably fail, the user impact is minimized or eliminated.

    Building for Failure

    A fundamental truth of complex distributed systems is that components will fail. The SRE mindset does not chase the impossible goal of 100% uptime. Instead, it focuses on building systems that maintain core functionality even when individual components are degraded or unavailable.

    This is achieved through specific architectural patterns.

    A key technique is graceful degradation. Instead of a service failing completely, it intelligently sheds non-essential functionality to preserve the core user experience. For an e-commerce site, if the personalized recommendation engine fails, a gracefully degrading system would still allow users to search, browse, and complete a purchase. The critical path remains operational.

    Another critical pattern is the circuit breaker. When a downstream microservice begins to fail, a circuit breaker in the calling service will "trip," temporarily halting requests to the failing service and returning a cached or default response. This prevents a localized failure from causing a cascading failure that brings down the entire application stack.

    Planning for Unpredictable Demand

    Scalability is the counterpart to resilience. A system that cannot handle a sudden increase in traffic is just as unreliable as one that crashes due to a software bug. This requires rigorous load testing and capacity planning, especially in environments with variable traffic patterns.

    Modern capacity planning is more than just adding servers; it involves deep analysis of usage data to forecast future demand and provision resources just-in-time. This is where effective cloud infrastructure management services demonstrate their value, providing the observability and automation tools necessary to scale resources intelligently.

    But how do you validate that these resilient designs work as intended? You test them by intentionally breaking them.

    The Art of Controlled Destruction: Chaos Engineering

    This leads to one of the most powerful practices in the SRE toolkit: chaos engineering.

    Chaos engineering is the discipline of experimenting on a system in order to build confidence in the system's ability to withstand turbulent conditions in production. You intentionally inject controlled failures to proactively identify and remediate weaknesses before they manifest as user-facing outages.

    While it may sound disruptive, it is a highly disciplined and controlled practice. Using frameworks like Gremlin or AWS Fault Injection Simulator, SREs run "gameday" experiments that simulate real-world failures in a controlled environment.

    Classic chaos experiments include:

    • Terminating a VM instance or container pod: Does your auto-scaling and failover logic function correctly and within the expected timeframe?
    • Injecting network latency or packet loss: How do your services behave under degraded network conditions? Do timeouts and retries function as designed?
    • Saturating CPU or memory: Where are the hidden performance bottlenecks and resource limits in your application stack?

    By embracing failure as an inevitability, SREs transform reliability from a reactive fire drill into a proactive engineering discipline. We build systems that don't just survive change—they adapt to it.

    Mastering Incident Response and Postmortems

    Image

    Despite robust engineering, incidents will occur. The true measure of a mature operations team is not in preventing every failure, but in how it responds. This is what differentiates a minor, contained issue from a major outage that exhausts your error budget and erodes user trust.

    In Site Reliability Engineering, incident response is not a chaotic scramble. It is a structured, well-rehearsed practice. When a high-severity alert fires, the singular goal is service restoration. This requires a pre-defined playbook that eliminates ambiguity in high-stress situations. A robust plan includes clear on-call rotation schedules, severity level (SEV) definitions to classify impact, and a command structure to prevent the response from descending into chaos.

    Establishing an Incident Command Structure

    During a major outage, ambiguity is the enemy. A formal command structure, with clearly defined roles and responsibilities, is the best defense. It ensures communication is streamlined, decisions are decisive, and every team member understands their specific duties.

    This structure allows subject matter experts to focus on technical remediation without being distracted by status updates or coordination overhead.

    To maintain order during a crisis, a clear command structure is essential. The table below outlines the key roles found in most mature incident response frameworks.

    Incident Response Roles and Responsibilities

    Role Primary Responsibility Key Actions
    Incident Commander (IC) Leads the overall response, making strategic decisions and keeping the effort focused on resolution. Declares the incident, assembles the team, and delegates tasks. Not necessarily the most senior engineer.
    Communications Lead Manages all internal and external communication about the incident. Drafts status updates for executive stakeholders and posts to public status pages.
    Operations Lead Owns the technical investigation and coordinates remediation efforts. Directs engineers in diagnosing the issue, analyzing telemetry (logs, metrics, traces), and applying fixes.

    This structure is optimized for efficiency under pressure. The IC acts as the coordinator, the Comms Lead manages information flow, and the Ops Lead directs the technical resolution. The clear separation of duties prevents miscommunication and keeps the focus on recovery.

    The Power of Blameless Postmortems

    The incident is resolved. The service is stable. The most critical work is about to begin. The blameless postmortem is a core site reliability engineering principle that transforms every incident into an invaluable learning opportunity.

    The entire philosophy is predicated on one idea:

    The goal is to understand the systemic causes of an incident, not to assign individual blame. Human error is a symptom of a flawed system, not the root cause. A process that allows a single human mistake to have a catastrophic impact is the real vulnerability to be fixed.

    Removing the fear of retribution fosters psychological safety, empowering engineers to be completely transparent about the contributing factors. This unfiltered, factual feedback is essential for uncovering deep-seated weaknesses in your technology, processes, and automation.

    A thorough postmortem reconstructs a precise timeline of events, identifies all contributing factors (technical and procedural), and generates a set of prioritized, actionable remediation items with owners and deadlines. This creates a powerful feedback loop where every outage directly hardens the system against that entire class of failure. This is not about fixing bugs; it is about making continuous, systemic improvement a reality.

    Adopting SRE Principles in Your Organization

    A persistent myth suggests Site Reliability Engineering is only for hyper-scale companies like Google or Netflix. This is a misconception. Organizations of all sizes are successfully adapting and implementing these principles to improve their operational maturity.

    The SRE journey is not a monolithic roadmap. A large enterprise might establish a dedicated SRE organization. A startup or mid-sized company might embed SRE responsibilities within existing DevOps or platform engineering teams. The power of SRE lies in its flexibility as a mindset, not its rigidity as an organizational chart.

    Charting Your SRE Adoption Path

    How do you begin? A proven approach is the people, process, and technology framework. This model provides a structured way to introduce SRE concepts incrementally without causing organizational disruption. The goal is to progressively weave the SRE mindset into your existing engineering culture.

    This is not a new trend. By 2016, SRE had already expanded beyond its origins. While Google famously employed over 1,000 site reliability engineers, other innovators like Netflix, Airbnb, and LinkedIn had already adapted the model. They either built specialized teams or, as is now more common, integrated SRE responsibilities directly into their DevOps and platform roles.

    The key takeaway is that you do not need a large, dedicated team to start. Begin by selecting a single, business-critical service, defining its SLOs, and empowering a team to own its reliability.

    This small, focused effort can create a powerful ripple effect. Once one team experiences firsthand how data-driven reliability targets and error budgets improve both their work-life balance and the customer experience, the culture begins to shift organically.

    If you are considering how to introduce this level of stability and performance to your systems, exploring specialized SRE services can provide the roadmap and expertise to accelerate your adoption. It’s about building a resilient, scalable foundation for future innovation.

    Alright, you've absorbed the core principles of SRE. Now let's address some of the most common implementation questions.

    SRE vs. DevOps: What's the Real Difference?

    This is the most frequent point of confusion. Both SRE and DevOps aim to solve the same problem: breaking down organizational silos between development and operations to deliver better software, faster.

    The clearest distinction is this: DevOps is the cultural philosophy—the "what." SRE is a specific, prescriptive implementation of that philosophy—the "how."

    A popular analogy states, "If DevOps is an interface, SRE is a class that implements it."

    SRE provides the concrete engineering practices to make the DevOps philosophy tangible. It introduces hard data and strict rules—like SLOs, error budgets, and the 50% cap on toil—that translate broad cultural goals into specific, measurable engineering disciplines.

    Can We Do SRE If We're Just a Small Startup?

    Yes, absolutely. You may not need a formal "SRE Team," but you can and should adopt the SRE mindset. The key is to start small and focus on high-impact, low-effort practices that yield the greatest reliability return.

    You don't need a massive organizational change. Start with these three actions:

    • Define one simple SLO: Choose a single, critical user journey (e.g., login API, checkout flow) and establish a clear, measurable reliability target for its latency or availability.
    • Automate one painful task: Identify the most hated, error-prone manual task your team performs. Write a script to automate it and reclaim that engineering time.
    • Run blameless postmortems: The next time an incident occurs, gather the team to analyze the systemic causes. Focus on the process failures, not the people involved.

    These initial steps activate the core feedback loops of SRE without requiring a large organizational investment.

    What's the Very First Thing I Should Do to Get Started?

    If you do only one thing, do this: Select your most business-critical service and define its first Service Level Objective (SLO).

    This single action is a powerful catalyst. It forces a cascade of essential conversations that are foundational to building a reliable system.

    To set an SLO, you must first define what reliability means to your users by instrumenting SLIs. Then, you must gain consensus from all stakeholders on a specific, measurable target. Once that SLO is defined, you automatically get an error budget. That budget becomes your data-driven framework for balancing feature velocity against stability. It all begins with that one number.


    Ready to turn these principles into a more reliable and scalable system? OpsMoon can connect you with top-tier SRE and DevOps engineers who live and breathe this stuff. We can help you build your reliability roadmap, starting with a free work planning session. Learn more about how OpsMoon can help.