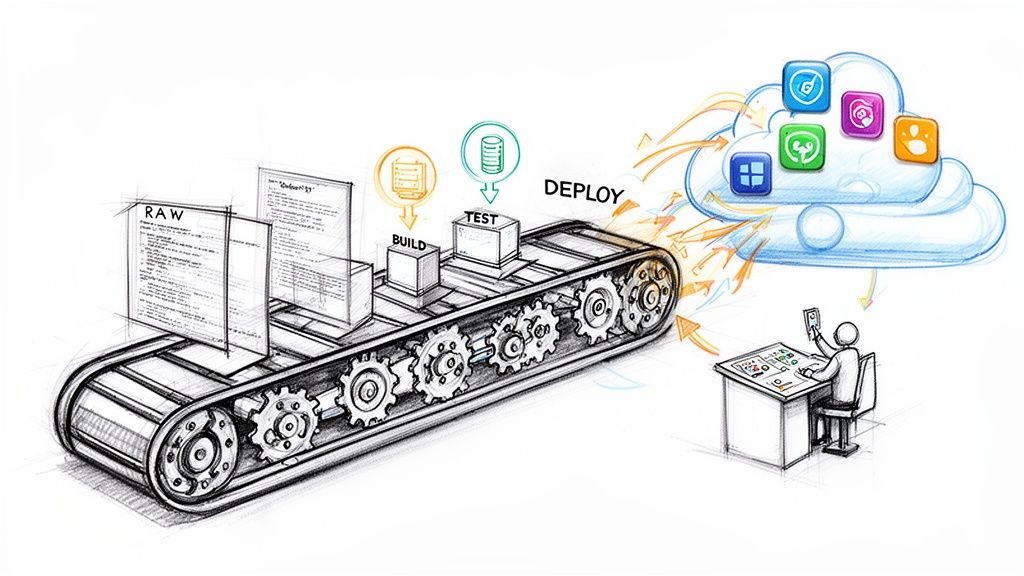
Author: opsmoon

  • A Technical Guide to Legacy System Modernisation

    A Technical Guide to Legacy System Modernisation

    Legacy system modernisation is the strategic re-engineering of outdated IT systems to meet modern architectural, performance, and business demands. This is not a simple lift-and-shift; it's a deep architectural overhaul focused on transforming technical debt into a high-velocity, scalable technology stack. The objective is to dismantle monolithic constraints and rebuild for agility, turning accumulated liabilities into tangible technical equity.

    Why Modernisation Is a Technical Imperative

    Clinging to legacy systems is an architectural dead-end that directly throttles engineering velocity and business growth. These systems are often characterized by tight coupling, lack of automated testing, and complex, manual deployment processes. The pressure to modernize stems from crippling maintenance costs, severe security vulnerabilities (like unpatched libraries), and a fundamental inability to iterate at market speed.

    Modernisation is a conscious pivot from managing technical debt to actively building technical equity. It's about engineering a resilient, observable, and flexible foundation that enables—not hinders—future development.

    The True Cost of Technical Stagnation

    The cost of inaction compounds exponentially. It's not just the expense of maintaining COBOL or archaic Java EE applications; it's the massive opportunity cost. Every engineering cycle spent patching a fragile monolith is a cycle not invested in building features, improving performance, or scaling infrastructure.

    This technical drain is why legacy system modernisation has become a critical engineering focus. A staggering 62% of organizations still operate on legacy software, fully aware of the security and performance risks. To quantify the burden, the U.S. federal government allocates roughly $337 million annually just to maintain ten of its most critical legacy systems.

    For a deeper analysis of this dynamic in a regulated industry, this financial digital transformation playbook provides valuable technical context.

    The engineering conversation must shift from "What is the budget for this project?" to "What is the engineering cost of not doing it?" The answer, measured in lost velocity and operational drag, is almost always greater than the modernisation investment.

    A successful modernisation initiative follows three core technical phases: assess, strategize, and execute.

    Legacy modernization process showing three stages: assess with magnifying glass, strategize with roadmap, and execute with gear icon

    This workflow is a non-negotiable prerequisite for success. A project must begin with a deep, data-driven analysis of the existing system's architecture, codebase, and operational footprint before any architectural decisions are made. This guide provides a technical roadmap for executing each phase. For related strategies, explore our guide on how to reduce operational costs through technical improvements.

    Auditing Your Legacy Environment for Modernisation

    Initiating a modernisation project without a comprehensive technical audit is akin to refactoring a codebase without understanding its dependencies. Before defining a target architecture, you must perform a full technical dissection of the existing ecosystem. This ensures decisions are driven by quantitative data, not architectural assumptions.

    The first step is a complete application portfolio analysis. This involves cataloging every application, service, and batch job, from monolithic mainframe systems to forgotten cron jobs. The goal is to produce a definitive service catalog and a complete dependency graph.

    Mapping Dependencies and Business Criticality

    Untangling the spaghetti of undocumented, hardcoded dependencies is a primary challenge in legacy systems. A single failure in a seemingly minor component can trigger a cascading failure across services you believed were decoupled.

    To build an accurate dependency map, your engineering team must:

    • Trace Data Flows: Analyze database schemas, ETL scripts, and message queue topics to establish a clear data lineage. Use tools to reverse-engineer database foreign key relationships and stored procedures to understand implicit data contracts.
    • Map Every API and Service Call: Utilize network traffic analysis and Application Performance Monitoring (APM) tools to visualize inter-service communication. This will expose undocumented API calls and hidden dependencies.
    • Identify Shared Infrastructure: Pinpoint shared databases, file systems, and authentication services. These are single points of failure and significant risks during a phased migration.

    With a dependency map, you can accurately assess business criticality. Classify applications using a matrix that plots business impact against technical health. High-impact applications with poor technical health (e.g., low test coverage, high cyclomatic complexity) are your primary modernisation candidates.

    It's a classic mistake to focus only on user-facing applications. Often, a backend batch-processing system is the lynchpin of the entire operation. Its stability and modernisation should be the top priority to mitigate systemic risk.

    Quantifying Technical Debt

    Technical debt is a measurable liability that directly impacts engineering velocity. Quantifying it is essential for building a compelling business case for modernisation. This requires a combination of automated static analysis and manual architectural review.

    • Static Code Analysis: Employ tools like SonarQube to generate metrics on cyclomatic complexity, code duplication, and security vulnerabilities (e.g., OWASP Top 10 violations). These metrics provide an objective baseline for measuring improvement.
    • Architectural Debt Assessment: Evaluate the system's modularity. How tightly coupled are the components? Can a single module be deployed independently? A "big ball of mud" architecture signifies immense architectural debt.
    • Operational Friction: Analyze DORA metrics such as Mean Time to Recovery (MTTR) and deployment frequency. A high MTTR or infrequent deployments are clear indicators of a brittle system and significant operational debt.

    Quantifying this liability is a core part of the audit. For actionable strategies, refer to our guide on how to manage technical debt. These metrics establish a baseline to prove the ROI of your modernisation efforts.

    Selecting the Right Modernisation Pattern

    Not every legacy application requires a rewrite into microservices. The appropriate strategy—often one of the "6 Rs" of migration—is determined by the data gathered during your audit. The choice must balance business objectives, technical feasibility, and team capabilities.

    This decision matrix provides a framework for selecting a pattern:

    Pattern Business Value Technical Condition Team Skills Best Use Case
    Rehost Low to Medium Good Low (SysAdmin skills) Quick wins. Moving a monolithic app to an EC2 instance to reduce data center costs.
    Replatform Medium Fair to Good Medium (Cloud platform skills) Migrating a database to a managed service like AWS RDS or containerising an app with minimal code changes.
    Refactor High Fair High (Deep code knowledge) Improving code quality and maintainability by breaking down large classes or adding unit tests without altering the external behavior.
    Rearchitect High Poor Very High (Architecture skills) Decomposing a monolith into microservices to improve scalability and enable independent deployments.
    Rebuild Very High Obsolete Very High (Greenfield development) Rewriting an application from scratch when the existing codebase is unmaintainable or based on unsupported technology.
    Retire None Any N/A Decommissioning an application that provides no business value, freeing up infrastructure and maintenance resources.

    A structured audit provides the foundation for your entire modernisation strategy, transforming it from a high-risk gamble into a calculated, data-driven initiative. This ensures you prioritize correctly and choose the most effective path forward.

    Designing a Resilient and Scalable Architecture

    With the legacy audit complete, the next phase is designing the target architecture. This is where abstract goals are translated into a concrete technical blueprint. A modern architecture is not about adopting trendy technologies; it's about applying fundamental principles of loose coupling, high cohesion, and fault tolerance to achieve resilience and scalability.

    This architectural design is a critical step in any legacy system modernisation project. It lays the groundwork for escaping monolithic constraints and building a system that can evolve at the speed of business. The primary objective is to create a distributed system where components can be developed, deployed, and scaled independently.

    Hand-drawn diagram showing application modernization workflow from legacy systems to cloud-native architecture components

    This diagram illustrates the conceptual shift from a tightly coupled legacy core to a distributed, cloud-native architecture. A clear visual roadmap is essential for aligning engineering teams on the target state before implementation begins.

    Embracing Microservices and Event-Driven Patterns

    Decomposing the monolith is often the first architectural decision. This involves strategically partitioning the legacy application into a set of small, autonomous microservices, each aligned with a specific business capability (a bounded context). For an e-commerce monolith, this could mean separate services for product-catalog, user-authentication, and order-processing.

    This approach enables parallel development and technology heterogeneity. However, inter-service communication must be carefully designed. Relying solely on synchronous, blocking API calls (like REST) can lead to tight coupling and cascading failures, recreating the problems of the monolith.

    A superior approach is an event-driven architecture. Services communicate asynchronously by publishing events to a durable message bus like Apache Kafka or RabbitMQ. Other services subscribe to these events and react independently, creating a highly decoupled and resilient system.

    For example, when the order-processing service finalizes an order, it publishes an OrderCompleted event to a topic. The shipping-service and notification-service can both consume this event and execute their logic without any direct knowledge of the order-processing service.

    Containerisation and Orchestration with Kubernetes

    Modern services require a modern runtime environment. Containerisation using Docker has become the de facto standard for packaging an application with its dependencies into a single, immutable artifact. This eliminates environment drift and ensures consistency from development to production.

    Managing a large number of containers requires an orchestrator like Kubernetes. Kubernetes automates the deployment, scaling, and lifecycle management of containerized applications.

    It provides critical capabilities for any modern system:

    • Automated Scaling: Horizontal Pod Autoscalers (HPAs) automatically adjust the number of container replicas based on CPU or custom metrics, ensuring performance during load spikes while optimizing costs.
    • Self-Healing: If a container fails its liveness probe, Kubernetes automatically restarts it or replaces it, significantly improving system availability without manual intervention.
    • Service Discovery and Load Balancing: Kubernetes provides stable DNS endpoints for services and load balances traffic across healthy pods, simplifying inter-service communication.

    This level of automation is fundamental to modern operations, enabling teams to manage complex distributed systems effectively.

    Infrastructure as Code and CI/CD Pipelines

    Manual infrastructure provisioning is a primary source of configuration drift and operational errors. Infrastructure as Code (IaC) tools like Terraform or Pulumi allow you to define your entire infrastructure—VPCs, subnets, Kubernetes clusters, databases—in declarative code. This code is version-controlled in Git, enabling peer review and automated provisioning.

    This IaC foundation is the basis for a robust Continuous Integration/Continuous Deployment (CI/CD) pipeline, managed by tools like GitLab CI or Jenkins. A mature pipeline automates the entire release process:

    1. Build: Compiles code and builds a versioned Docker image.
    2. Test: Executes unit, integration, and static analysis security tests (SAST).
    3. Deploy: Pushes the new image to an artifact repository and deploys it to staging and production environments using strategies like blue-green or canary deployments.

    Automation enables teams to ship small, incremental changes safely and frequently, accelerating feature delivery and reducing the risk of each release.

    Designing for Observability from Day One

    In a distributed system, you cannot debug by SSH-ing into a server. Observability—the ability to infer the internal state of a system from its external outputs—must be engineered into the architecture from the outset.

    The market reflects this necessity: the global legacy modernization services market was valued at $17.8 billion in 2023 and is projected to grow as companies adopt these complex architectures. When executed correctly, modernisation can yield infrastructure savings of 15-35% and reduce application maintenance costs by up to 50%, driven largely by the operational efficiencies of modern practices. You can find more data and legacy modernization trends at Acropolium.com.

    A robust observability strategy is built on three pillars:

    • Logging: Centralized logging using a stack like ELK (Elasticsearch, Logstash, Kibana) or Loki aggregates logs from all services, enabling powerful search and analysis.
    • Metrics: Tools like Prometheus scrape time-series metrics from services, providing insights into system performance (latency, throughput, error rates) and resource utilization. This data powers Grafana dashboards and alerting rules.
    • Distributed Tracing: Instruments like Jaeger or OpenTelemetry propagate a trace context across service calls, allowing you to visualize the entire lifecycle of a request as it moves through the distributed system and identify performance bottlenecks.

    Executing a Low-Risk Migration Strategy

    With a target architecture defined, the focus shifts to execution. A successful migration is not a single, high-risk "big bang" cutover; it is a meticulously planned, iterative process. The primary goal is to migrate functionality and data incrementally, ensuring business continuity at every stage.

    This is the phase where your legacy system modernisation blueprint is implemented. Technical planning must align with operational reality to de-risk the entire initiative. The key is to decompose the migration into small, verifiable, and reversible steps. This allows teams to build momentum and derisk the process incrementally.

    Hand-drawn system architecture diagram showing legacy transformation with components including ETW2, Service, Terraform, and Oracle

    Applying the Strangler Fig Pattern

    The Strangler Fig pattern is one of the most effective, low-risk methods for incremental modernisation. It involves placing a reverse proxy or API gateway in front of the legacy monolith, which initially routes all traffic to the old system. As new microservices are built to replace specific functionalities—such as user authentication or inventory management—the proxy's routing rules are updated to redirect traffic for that functionality to the new service.

    This pattern offers several key advantages:

    • Reduced Risk: You migrate small, isolated functionalities one at a time. If a new service fails, the proxy can instantly route traffic back to the legacy system, minimizing disruption.
    • Immediate Value: The business benefits from the improved performance and new features of the modernised components long before the entire project is complete.
    • Continuous Learning: The team gains hands-on experience with the new architecture and tooling on a manageable scale, allowing them to refine their processes iteratively.

    Over time, as more functionality is migrated to new services, the legacy monolith is gradually "strangled" until it can be safely decommissioned.

    Managing Complex Data Migration

    Data migration is often the most complex and critical part of the process. Data integrity must be maintained throughout the transition from a legacy database to a modern one. This requires a sophisticated, multi-stage approach.

    A proven strategy is to use data synchronization with Change Data Capture (CDC) tools like Debezium. CDC streams changes from the legacy database's transaction log to the new database in near real-time. This allows both systems to run in parallel, enabling thorough testing of the new services with live data without the pressure of an immediate cutover.

    The typical data migration process is as follows:

    1. Initial Bulk Load: Perform an initial ETL (Extract, Transform, Load) job to migrate the historical data.
    2. Continuous Sync: Implement CDC to capture and replicate ongoing changes from the legacy system to the new database.
    3. Validation: Run automated data validation scripts to continuously compare data between the two systems, ensuring consistency and identifying any discrepancies.
    4. Final Cutover: During a planned maintenance window, stop writes to the legacy system, allow CDC to replicate any final transactions, and then re-point all applications to the new database as the source of truth.

    Comprehensive Testing in a Hybrid Environment

    Testing in a hybrid environment where new microservices coexist with legacy components is exceptionally complex. Your testing strategy must validate not only the new services in isolation but also the integration points between the old and new systems.

    A critical mistake is to test new services in isolation. The real risk lies in the integration points. Your testing must rigorously validate the data contracts and communication patterns between your shiny new microservices and the decades-old monolith they still depend on.

    A comprehensive testing plan must include:

    • Unit & Integration Testing: Standard testing to ensure the correctness of individual services and their direct dependencies.
    • Contract Testing: Using tools like Pact to verify that services adhere to their API contracts, which is essential for preventing breaking changes in a distributed system.
    • End-to-End (E2E) Testing: Simulating user journeys that traverse both new microservices and legacy components to validate the entire workflow.
    • Performance & Load Testing: Stress-testing the new services and the proxy layer to ensure they meet performance SLOs under production load.

    Successful modernization projects often result in significant operational efficiency gains, such as 50% faster processing times. This is why IDC predicts that 65% of organizations will aggressively modernize their legacy systems. For a deeper academic analysis, see the strategic drivers of modernization in this Walden University paper.

    For teams moving to a cloud-native architecture, mastering the migration process is crucial. Learn more in our guide on how to migrate to cloud. By combining the Strangler Fig pattern with a meticulous data migration and testing strategy, you can execute a modernisation that delivers value incrementally while minimizing business risk.

    Managing Costs, Timelines, and Technical Teams

    Modernisation projects are significant engineering investments. Effective project management is the determining factor between a successful transformation and a costly failure. The success of any legacy system modernisation hinges on precise management of budget, schedule, and team structure. It's not just about technology; it's about orchestrating the resources to implement it effectively.

    Hand-drawn diagram showing legacy system migration process through microservices architecture to modern data state

    This requires a holistic view that extends beyond infrastructure costs. Disciplined project management is essential to prevent scope creep and ensure alignment with business objectives. For different frameworks, it’s worth exploring how to go about mastering IT infrastructure project management strategies.

    Calculating the True Total Cost of Ownership

    Underestimating the Total Cost of Ownership (TCO) is a common pitfall. The cost of cloud services and software licenses is only a fraction of the total investment. A realistic TCO model must account for all direct and indirect costs over the project's lifecycle.

    A comprehensive financial model must include:

    • Tooling and Licensing: Costs for new CI/CD platforms, observability stacks like Prometheus or Datadog, Kubernetes subscriptions, and commercial IaC tools.
    • Team Retraining and Upskilling: Budget for training engineers on new technologies such as containerisation, microservices architecture, and event-driven patterns. This is a critical investment in your team's capabilities.
    • Temporary Productivity Dips: Account for an initial drop in velocity as the team adapts to new tools and workflows. Factoring this into the project plan prevents reactive course corrections later.
    • Parallel Running Costs: During a phased migration (e.g., Strangler Fig pattern), you will incur costs for both the legacy system and the new infrastructure simultaneously. This period of dual operation must be accurately budgeted.

    Structuring Your Modernisation Teams

    Team topology has a direct impact on project velocity and outcomes. The two primary models are the dedicated team and the integrated team.

    The dedicated modernisation team is a separate squad focused exclusively on the modernisation initiative. This focus accelerates progress but can create knowledge silos and lead to difficult handovers upon project completion.

    The integrated product team model embeds modernisation work into the backlogs of existing product teams. This fosters a strong sense of ownership and leverages deep domain knowledge. However, progress may be slower as teams must balance this work with delivering new business features.

    A hybrid model is often the most effective. A small, central "platform enablement team" can build the core infrastructure and establish best practices. The integrated product teams then leverage this platform to modernise their own services. This combines centralized expertise with decentralized execution.

    Building Realistic Timelines with Agile Methodologies

    Rigid, multi-year Gantt charts are ill-suited for large-scale modernisation projects due to the high number of unknowns. An agile approach, focused on delivering value in small, iterative cycles, is a more effective and less risky methodology.

    By decomposing the project into sprints or delivery waves, you can:

    1. Deliver Value Sooner: Stakeholders see tangible progress every few weeks as new components are deployed, rather than waiting years for a "big bang" release.
    2. Learn and Adapt Quickly: An iterative process allows the team to learn from each migration phase and refine their approach based on real-world feedback.
    3. Manage Risk Incrementally: By tackling the project in small pieces, you isolate risk. A failure in a single microservice migration is a manageable issue, not a catastrophic event that derails the entire initiative.

    This agile mindset is essential for navigating the complexity of transforming deeply embedded legacy systems.

    Real-World Examples from the Field

    Theory is useful, but practical application is paramount. At OpsMoon, we’ve guided companies through these exact scenarios.

    A fintech client was constrained by a monolithic transaction processing system that was causing performance bottlenecks. We helped them establish a dedicated modernisation team to apply the Strangler Fig pattern, beginning with the user-authentication service. This initial success built momentum and demonstrated the value of the microservices architecture to stakeholders.

    In another instance, a logistics company was struggling with an outdated warehouse management system. They adopted an integrated team model, tasking the existing inventory tracking team with replatforming their module from an on-premise server to a containerized application in the cloud. While the process was slower, it ensured that critical domain knowledge was retained throughout the migration.

    Common Legacy Modernisation Questions

    Initiating a legacy system modernisation project inevitably raises critical questions from both technical and business stakeholders. Clear, data-driven answers are essential for maintaining alignment and ensuring project success. Here are some of the most common questions we address.

    How Do We Justify the Cost Against Other Business Priorities?

    Frame the project not as a technical upgrade but as a direct enabler of business objectives. The key is to quantify the cost of inaction.

    Provide specific metrics:

    • Opportunity Cost: Quantify the revenue lost from features that could not be built due to the legacy system's constraints.
    • Operational Drag: Calculate the engineering hours spent on manual deployments, incident response, and repetitive bug fixes that would be automated in a modern system.
    • Talent Attrition: Factor in the high cost of retaining engineers with obsolete skills and the difficulty of hiring for an unattractive tech stack.

    When the project is tied to measurable outcomes like improved speed to market and reduced operational costs, it becomes a strategic investment rather than an IT expense.

    Is a "Big Bang" or Phased Approach Better?

    A phased, iterative approach is almost always the correct choice for complex systems. A "big bang" cutover introduces an unacceptable level of risk. A single unforeseen issue can lead to catastrophic downtime, data loss, and a complete loss of business confidence.

    We strongly advocate for incremental strategies like the Strangler Fig pattern. This allows you to migrate functionality piece by piece, dramatically de-risking the project, delivering value sooner, and enabling the team to learn and adapt throughout the process.

    The objective is not a single, flawless launch day. The objective is a continuous, low-risk transition that ensures business continuity. A phased approach is the only rational method to achieve this.

    How Long Does a Modernisation Project Typically Take?

    The timeline varies significantly based on the project's scope. A simple rehost (lift-and-shift) might take a few weeks, while a full re-architecture could span several months to a year or more.

    However, a more relevant question is, "How quickly can we deliver value?"

    With an agile, incremental approach, the goal should be to deploy the first modernised component within the first few months. This could be a single microservice that handles a specific function. This early success validates the architecture, demonstrates tangible progress, and builds the momentum needed to drive the project to completion. The project is truly "done" only when the last component of the legacy system is decommissioned.


    Navigating the complexities of legacy system modernisation requires deep technical expertise and strategic planning. OpsMoon connects you with the top 0.7% of DevOps engineers to accelerate your journey from assessment to execution. Get started with a free work planning session and build the resilient, scalable architecture your business needs. Find your expert at OpsMoon.

  • site reliability engineering devops: A Practical SRE Implementation Guide

    site reliability engineering devops: A Practical SRE Implementation Guide

    Think of the relationship between Site Reliability Engineering (SRE) and DevOps like this: DevOps provides the architectural blueprint for building a house, focusing on collaboration and speed. SRE is the engineering discipline that comes in to pour the foundation, frame the walls, and wire the electricity, ensuring the structure is sound, stable, and won't fall down.

    They aren't competing ideas; they're two sides of the same coin, working together to build better software, faster and more reliably.

    How SRE Puts DevOps Philosophy into Practice

    Many teams jump into DevOps to tear down the walls between developers and operations. The goal is noble: ship software faster, collaborate better, and create a culture of shared ownership. But DevOps is a philosophy—it tells you what you should be doing, but it's often light on the how.

    This is where Site Reliability Engineering steps in. SRE provides the hard engineering and data-driven practices needed to make the DevOps vision a reality. It originated at Google out of the sheer necessity of managing massive, complex systems, fundamentally treating operations as a software problem.

    SRE is what happens when you ask a software engineer to design an operations function. It’s a discipline that applies software engineering principles to automate IT operations, making systems more scalable, reliable, and efficient.

    Architectural sketch comparing DevOps house structure with SRE urban infrastructure and monitoring systems

    SRE is all about finding that sweet spot between launching new features and ensuring the lights stay on. It achieves this balance using cold, hard numbers—not just good intentions. This is how SRE gives DevOps its technical teeth.

    Bridging Culture with Code

    SRE makes the abstract goals of DevOps concrete and measurable. Instead of just saying "we need to be reliable," SRE teams define reliability with mathematical precision through Service Level Objectives (SLOs). These aren't just targets; they're enforced by error budgets, which give teams a clear, data-backed license to innovate or pull back.

    This partnership is essential for modern distributed systems. When done right, the impact is huge. Research from the State of DevOps report shows that teams with mature operational practices are 1.8 times more likely to see better business outcomes. This synergy doesn't just stabilize your systems; it directly helps your business move faster without breaking things for your users.

    Comparing DevOps Philosophy and SRE Practice

    On the surface, DevOps and Site Reliability Engineering (SRE) look pretty similar. Both aim to get better software out the door faster, but they come at the problem from completely different directions. DevOps is a broad cultural philosophy. It’s all about breaking down the walls between teams to make work flow smoother. SRE, on the other hand, is a specific, prescriptive engineering discipline focused on one thing: reliability you can measure.

    Here’s a simple way to think about it: DevOps hits the gas pedal on the software delivery pipeline, pushing to get ideas into production as fast as possible. SRE is the sophisticated braking system, making sure that speed doesn't send the whole thing flying off the road.

    Goals and Primary Focus

    DevOps is fundamentally concerned with the how of software delivery. It’s the culture, the processes, and the tools that get developers and operations folks talking and working together instead of pointing fingers. The main goal? Shorten the development lifecycle from start to finish. If you want a deeper dive, you can explore the DevOps methodology in our detailed guide.

    SRE, by contrast, has a laser focus on a single, non-negotiable outcome: production stability and performance. Its goals aren't philosophical; they're mathematical. SREs use hard data to find the perfect, calculated balance between shipping cool new features and keeping the lights on for users.

    This difference creates very different pictures of success. A DevOps team might pop the champagne after cutting deployment lead time in half. An SRE team celebrates maintaining 99.95% availability while the company was shipping features at a breakneck pace.

    Metrics and Decision Making

    You can really see the difference when you look at what each discipline measures. DevOps tracks workflow efficiency, while SRE tracks the actual experience of your users.

    • DevOps Metrics: These are all about the pipeline. Think Deployment Frequency (how often can we ship?), Lead Time for Changes (how long from commit to production?), and Change Failure Rate (what percentage of our deployments break something?). These are often measured using DORA metrics.
    • SRE Metrics: This is where the math comes in. SRE is built on Service Level Indicators (SLIs), which are direct measurements of how your service is behaving (like request latency), and Service Level Objectives (SLOs), the target goals for those SLIs.

    The most powerful concept SRE brings to the site reliability engineering devops conversation is the error budget. It's derived directly from an SLO—for example, a 99.9% uptime SLO gives you a 0.1% error budget. This isn't just a number; it's a data-driven tool that dictates the pace of development.

    An error budget is the quantifiable amount of unreliability a system is allowed to have. If the system is operating well within its SLO, the team is free to use the remaining budget to release new features. If the budget is exhausted, all new feature development is frozen until reliability is restored.

    This simple tool completely changes the conversation. It removes emotion and office politics from the "should we ship it?" debate. The error budget makes the decision for you.

    DevOps Philosophy vs SRE Implementation

    To really nail down the distinction, let's put them head-to-head. The following table shows how the broad cultural ideas of DevOps get translated into concrete, engineering-driven actions by SRE.

    Aspect DevOps Philosophy SRE Implementation
    Primary Goal Increase delivery speed and remove cultural silos. Maintain a specific, quantifiable level of production reliability.
    Core Metric Workflow velocity (e.g., Lead Time, Deployment Frequency). User happiness (quantified via SLIs and SLOs).
    Failure Approach Minimize Change Failure Rate through better processes. Manage risk with a calculated error budget.
    Key Activity Automating the CI/CD pipeline. Defining SLOs and automating operational toil.
    Team Focus End-to-end software delivery lifecycle. Production operations and system stability.

    At the end of the day, DevOps gives you the "why"—the cultural push for speed and collaboration. SRE provides the "how"—the engineering discipline, hard metrics, and practical tools to achieve that speed without sacrificing the reliability that keeps your users happy and your business running.

    Putting the Core Pillars of SRE Into Practice

    Moving from high-level philosophy to the day-to-day grind of SRE means getting serious about four core pillars. These aren't just buzzwords; they're the engineering disciplines that give SRE its teeth. Get them right, and you’ll completely change how your teams handle reliability, risk, and the daily operational fire drills.

    This is where the abstract ideas of DevOps get real, backed by the hard data and engineering rigor of SRE. Let's dig into how to actually implement these foundational practices.

    Define Reliability With SLOs and Error Budgets

    First things first: you have to stop talking about reliability in vague, feel-good terms and start defining it with math. This all starts with Service Level Objectives (SLOs), which are precise, user-centric targets for your system's performance.

    An SLO is built on a Service Level Indicator (SLI), which is just a direct measurement of your service's behavior. A classic SLI for an API, for example, is request latency—how long it takes to give a response. The SLO then becomes the goal you set for that SLI over a certain amount of time.

    A Real-World Example: Setting an API Latency SLO

    1. Pick an SLI: Milliseconds it takes to process an HTTP GET request for a critical user endpoint. The Prometheus query for this might look like: http_request_duration_seconds_bucket{le="0.3", path="/api/v1/user"}.
    2. Define the SLO: "99.5% of GET requests to the /api/v1/user endpoint will complete in under 300ms over a rolling 28-day period."

    This single sentence instantly creates your error budget. The math is simple: it's just 100% - your SLO %, which in this case is 0.5%. This means that for every 1,000 requests, you can "afford" for up to 5 of them to take longer than 300ms without breaking your promise to users.

    This budget is now your currency for taking calculated risks. Is the budget healthy? Great, ship that new feature. Is it running low? All non-essential deployments get put on hold until reliability improves.

    Systematically Eliminate Toil

    Toil is the absolute enemy of SRE. It’s the repetitive, manual, tactical work that provides zero lasting engineering value and scales right alongside your service—and not in a good way. Think about tasks like manually spinning up a test environment, restarting a stuck service, or patching a vulnerability on a dozen servers one by one.

    SREs are expected to spend at least 50% of their time on engineering projects, and the number one target for that effort is automating away toil. It’s a systematic hunt.

    How to Find and Destroy Toil

    • Log Everything: For a couple of weeks, have your team log every single manual operational task they perform. Use a simple spreadsheet or a Jira project.
    • Analyze and Prioritize: Go through the logs and pinpoint the tasks that eat up the most time or happen most often. Calculate the man-hours spent per month on each task.
    • Automate It: Write a script, build a self-service tool, or configure an automation platform to do the job instead. A Python script using boto3 for AWS tasks is a common starting point.
    • Measure the Impact: Track the hours saved and pour that time back into high-value engineering, like improving system architecture.

    For example, if a team is burning three hours a week manually rotating credentials, an SRE would build an automated system using a tool like HashiCorp Vault to handle it. That one project kills that specific toil forever, freeing up hundreds of engineering hours over the course of a year.

    Master Incident Response and Blameless Postmortems

    Even the best-built systems are going to fail. What sets SRE apart is its approach to failure. The goal isn't to prevent every single incident—that's impossible. The goal is to shrink the impact and learn from every single one so it never happens the same way twice.

    A crucial part of SRE is having a rock-solid incident management process and a culture of learning. A structured approach like Mastering the 5 Whys Method for Root Cause Analysis can be a game-changer here. It forces teams to dig past the surface symptoms to uncover the real, systemic issues that led to an outage.

    A blameless postmortem focuses on identifying contributing systemic factors, not on pointing fingers at individuals. The fundamental belief is that people don't fail; the system allowed the failure to happen.

    This cultural shift is everything. When engineers feel safe to talk about what really happened without fear of blame, the organization gets an honest, technically deep understanding of what went wrong. For a deeper dive into building this out, check out some incident response best practices in our guide. Every single postmortem must end with a list of concrete action items, complete with owners and deadlines, to fix the underlying flaws.

    Conduct Proactive Capacity Planning

    The final pillar is looking ahead with proactive capacity planning. SREs don’t just wait for a service to crash under heavy traffic; they use data to see the future and scale the infrastructure before it becomes a problem. This isn't a one-off project; it’s a continuous, data-driven cycle.

    It involves analyzing organic growth trends (like new user sign-ups) and keeping an eye on non-organic events (like a big marketing launch). By modeling this data, SREs can forecast exactly when a system will hit its limits—be it CPU, memory, network bandwidth, or database connections. For example, using historical time-series data from Prometheus, an SRE can apply a linear regression model to predict when CPU utilization will cross the 80% threshold. This allows them to add more capacity or optimize what’s already there long before users even notice a slowdown. It's this forward-thinking approach that keeps things fast and reliable, even as the business grows like crazy.

    Your Roadmap to a Unified SRE and DevOps Model

    Making the switch to a blended site reliability engineering devops model is a journey, not just flipping a switch. It calls for a smart, phased rollout that builds momentum by starting small and proving its worth early on. This roadmap lays out a practical way to weave SRE's engineering discipline into your existing DevOps culture.

    Think of it like this: you wouldn't rewrite your entire application in one big bang. You’d start with a single microservice. The same idea applies here.

    Phase 1: Laying the Foundation

    This first phase is all about learning and setting a baseline. The real goal is to demonstrate the value of SRE on a small scale before you try to take over the world. This approach keeps risk low and helps you build the internal champions you'll need for a wider rollout.

    Your first move is to pick a pilot project. You want a service that’s important enough for people to care about, but not so tangled that it becomes a nightmare. A key internal-facing tool or a single, well-understood microservice are perfect candidates.

    Once you’ve got your pilot service, the fun begins. Your immediate goals should be to:

    • Define Your First SLOs: Sit down with product owners and developers to hash out one or two critical Service Level Objectives. For an API, this might be latency. For a data processing pipeline, it might be freshness. The point is to make it measurable and tied to what your users actually experience.
    • Establish a Reliability Baseline: You can't improve what you don't measure. Get your pilot service instrumented to track its SLIs and SLOs for a few weeks. For a web service, this means exporting metrics like latency and HTTP status codes to a system like Prometheus. This data gives you an honest look at its current performance and a starting line to measure improvements against.
    • Form a Virtual Team: Pull together a small group of enthusiastic developers and ops engineers to act as the first SRE team for this service. This crew will learn the ropes, champion the practices, and become your go-to experts.

    The point of this first phase isn't perfection; it's about gaining clarity. Just by defining a simple SLO and measuring it, you're forcing a data-driven conversation about reliability that probably hasn’t happened before.

    Phase 2: Building Structure and Policy

    After you've got a win under your belt with the pilot, it's time to make things official. This phase is all about creating the structures and policies that let SRE scale beyond just one team. This is where you figure out how SRE will actually operate inside your engineering org.

    You'll need to think about how to structure your SRE teams, as each model has its pros and cons.

    • Embedded SREs: An SRE is placed directly on a specific product or service team. This fosters deep product knowledge and super tight collaboration.
    • Centralized SRE Team: A single team acts like internal consultants, sharing their expertise and building common tools for all the other teams to use.
    • Hybrid Model: A central team builds the core platform and tools, while a few embedded SREs work directly with the most critical service teams.

    Right alongside the team structure, you need to create and enforce your error budget policies. This is the secret sauce that turns your SLOs from a pretty dashboard into a powerful tool for making decisions. Write down a clear policy: when a service burns through its error budget, all new feature development stops. The team's entire focus shifts to reliability work. This step is what gives SRE real teeth.

    This workflow shows the core pillars that guide an SRE's day-to-day, from setting targets all the way to continuous improvement.

    Workflow diagram showing SLOs, automated toil reduction, incident response communication, and planning calendar in sequence

    The flow starts with data-driven SLOs, which directly influence everything that follows, from how teams handle incidents to how they plan their next sprint.

    Phase 3: Scaling and Maturing the Practice

    The final phase is all about making SRE part of your engineering culture's DNA. With a solid foundation and clear policies in place, you can now focus on scaling the practice and taking on more advanced challenges. The ultimate goal is to make reliability a shared responsibility that everyone owns by default.

    This phase is defined by a serious investment in automation and tooling. You should be focused on:

    1. Building an Observability Stack: It's time to go beyond basic metrics. Implement a full-blown platform that gives you deep insights through metrics, logs, and distributed tracing. This gives your teams the data they need to debug nasty, complex issues in production—fast.
    2. Advanced Toil Automation: Empower your SREs to build self-service tools and platforms that let developers manage their own operational tasks safely. This could be anything from automated provisioning and canary deployment pipelines to self-healing infrastructure.
    3. Cultivating a Blameless Culture: Make blameless postmortems a non-negotiable for every significant incident. The focus must always be on fixing systemic problems, not pointing fingers at individuals. This builds the psychological safety needed for honest and effective problem-solving.

    By walking through these phases, you can weave SRE practices into your DevOps world in a way that’s manageable, measurable, and built to last.

    Building Your SRE and DevOps Toolchain

    DevOps workflow diagram showing observability, CI/CD, incident management, and collaboration components connected with arrows

    A high-performing site reliability engineering devops culture isn’t built on philosophy alone; it runs on a well-integrated set of tools. These platforms are more than just automation engines. They create the crucial feedback loops that turn raw production data into real, actionable engineering tasks.

    Building an effective toolchain means picking the right solution for each stage of the software lifecycle and, just as importantly, making sure they all talk to each other seamlessly. This is how you shift from reactive firefighting to a proactive, data-driven engineering practice, giving your teams the visibility and control they need to manage today’s complex systems.

    Observability and Monitoring Tools

    You simply can't make a system reliable if you can't see what's happening inside it. This is where observability tools come in. They provide the critical metrics, logs, and traces that let you understand system behavior and actually measure your SLOs.

    • Prometheus: Now the de facto standard for collecting time-series metrics, this open-source toolkit is a must-have, especially if you're running on Kubernetes.
    • Grafana: The perfect sidekick to Prometheus. Grafana lets you build slick, custom dashboards to visualize your metrics and keep a close eye on SLO compliance in real time.
    • Datadog: A comprehensive platform that brings infrastructure monitoring, APM, and log management together under one roof, giving you a single pane of glass to watch over your entire stack.

    These tools are your foundation. Without the data they provide, concepts like error budgets are just abstract theories. For a deeper dive, check out our guide on the best infrastructure monitoring tools.

    CI/CD and Automation Platforms

    Once the code is written, it needs a safe, repeatable path into production. CI/CD (Continuous Integration/Continuous Deployment) platforms automate the build, test, and deploy process, slashing human error and cranking up your delivery speed.

    And automation doesn't stop at the pipeline. Tools for infrastructure as code (IaC) and configuration management are just as vital for creating stable, predictable environments every single time.

    • GitLab CI/CD: A powerful, all-in-one solution that covers the entire DevOps lifecycle, from source code management and CI/CD right through to monitoring.
    • Jenkins: The classic, highly extensible open-source automation server. With thousands of plugins, it can be customized to handle literally any build or deployment workflow you can dream up.
    • Ansible: An agentless configuration management tool that's brilliant at automating application deployments, configuration changes, and orchestrating complex multi-step workflows.

    Integrating these automation tools is the whole point. The end goal is a hands-off process where a code commit automatically kicks off a series of quality gates and deployments, making sure every change is thoroughly vetted before it ever sees a user.

    Incident Management Systems

    Let's be real: things are going to break. When they do, a fast, coordinated response is everything. Incident management systems act as the command center for your response efforts, making sure the right people get alerted with the right context to fix things—fast.

    These platforms automate on-call schedules, escalations, and stakeholder updates, freeing up engineers to actually focus on solving the problem instead of managing the chaos.

    • PagerDuty: A leader in the digital operations space, providing rock-solid alerting, on-call scheduling, and powerful automation to streamline incident response.
    • Opsgenie: An Atlassian product offering flexible alerting and on-call management, with deep integrations into the Jira ecosystem for easy ticket tracking.

    As companies feel the sting of downtime, these systems have become standard issue. The rise of SRE itself is a direct answer to the complexity of modern software. In fact, by 2025, an estimated 85% of organizations will be actively using SRE practices to keep their services available and resilient. You can explore more about this trend in this detailed report on SRE adoption.

    Collaboration Hubs

    Finally, none of these tools can operate in a silo. Collaboration hubs are the glue that holds the entire toolchain together. They provide a central place for communication, documentation, and tracking the work that needs to get done.

    • Slack: The go-to platform for real-time communication. It's often integrated with monitoring and CI/CD tools to push immediate notifications into dedicated channels, so everyone stays in the loop.
    • Jira: A powerful project management tool used to turn insights from postmortems and observability data into trackable engineering tickets, effectively closing the feedback loop from production back to development.

    Building and Growing Your SRE Team

    Let's be honest: building a world-class Site Reliability Engineering team is tough. You're not just looking for ops engineers who can write some scripts. You need true systems thinkers—people who see operations as a software engineering problem waiting to be solved.

    The talent pool is incredibly competitive, and for good reason. The average SRE salary hovers around $130,000, and a whopping 88% of SREs feel their strategic importance has shot up recently. This isn't a role you can fill casually. If you want to dig deeper into where the industry is heading, the insights from the 2025 SRE report are a great place to start.

    Structuring Your Technical Interviews

    If you want to find the right people, your interview process has to be more than just another LeetCode grind. You need to test for a reliability-first mindset and a real knack for debugging complex systems under pressure.

    A solid SRE interview loop should always include:

    • Systems Design Scenarios: Hit them with an open-ended challenge. Something like, "Design a scalable, resilient image thumbnailing service." This isn't about getting the "right" answer; it's about seeing how they think through failure modes, redundancy, and the inevitable trade-offs.
    • Live Debugging Exercises: Throw a simulated production fire at them—maybe a sluggish database query or a service that keeps crashing. Watch how they troubleshoot in real-time. This is where you see their thought process and how they handle the heat.
    • Automation and Toil Reduction Questions: Ask about a time they automated a painfully manual task. Their answer will tell you everything you need to know about their commitment to crushing operational toil.

    Upskilling Your Internal Talent

    Don't get so focused on external hiring that you overlook the goldmine you might already have. Some of your best future SREs could be hiding in plain sight as software developers or sysadmins on your current teams.

    Think about creating an internal upskilling program. Pair your seasoned developers with your sharpest operations engineers on reliability-focused projects. This creates a powerful cross-pollination of skills. Developers learn the messy realities of production, and ops engineers get deep into automation. That's how you forge the hybrid expertise that defines a great SRE.

    Fostering a culture of psychological safety is completely non-negotiable for an SRE team. People have to feel safe enough to experiment, to fail, and to hold blameless postmortems without pointing fingers. It's the only way you'll ever unearth the real systemic issues and make lasting improvements.

    It also pays to get smart about the numbers behind hiring. Understanding your metrics can make a huge difference in managing your budget as the team grows. Learning how to optimize recruitment costs for your SRE team will help you build a sustainable pipeline for the long haul. A smart mix of strategic hiring and internal development is your ticket to a resilient and high-impact SRE function.

    Frequently Asked Questions About SRE and DevOps

    Even with the best roadmap, a few common questions always pop up when you start blending site reliability engineering devops. Getting these cleared up early saves a ton of confusion and keeps your teams pulling in the same direction.

    Here are the straight answers to the questions we hear most often.

    Can We Have SRE Without A DevOps Culture?

    You technically can, but it's like trying to run a high-performance engine on cheap gas. It just doesn't work well, and you miss the entire point. SRE gives you the engineering discipline, but a DevOps culture provides the collaborative fuel.

    Without that culture of shared ownership, SREs quickly turn into a new version of the old-school ops team, stuck in a silo fighting fires alone. This rebuilds the exact wall that DevOps was created to tear down. The real magic happens when everyone starts thinking like an SRE.

    The real power is unleashed when a developer, empowered by SRE tools and data, instruments their own code to meet an SLO. That is the fusion of SRE and DevOps in action.

    What Is The Most Important First Step In Adopting SRE?

    Pick one critical service and define its Service Level Objectives (SLOs). This is, without a doubt, the most important first step. Why? Because it forces a data-driven conversation about what "reliability" actually means to your users and the business.

    This simple exercise brings incredible clarity. It transforms reliability from a fuzzy concept into a hard, mathematical target. It also lays the technical groundwork for every other SRE practice that follows, like error budgets and automating away toil.

    Is SRE Just A New Name For The Operations Team?

    Not at all, and this is a crucial distinction to make. The biggest difference is that SREs are engineers first. They are required to spend at least 50% of their time on engineering projects aimed at making the system more automated, scalable, and reliable.

    Your traditional operations team is often 100% reactive, jumping from one ticket to the next. SRE is a proactive discipline focused on engineering problems so that systems can eventually run themselves.


    Ready to bridge the gap between your DevOps philosophy and SRE practice? OpsMoon provides the expert remote engineers and strategic guidance you need. Start with a free work planning session to build your reliability roadmap. Learn more at OpsMoon.

  • Mastering the Prometheus Query Language: A Technical Guide

    Mastering the Prometheus Query Language: A Technical Guide

    Welcome to your definitive technical guide for mastering the Prometheus Query Language (PromQL). This powerful functional language is the engine that transforms raw, high-volume time-series data into precise, actionable insights for system analysis, dashboarding, and alerting.

    Think of PromQL not as a traditional database language like SQL, but as a specialized, expression-based language designed exclusively for manipulating and analyzing time-series data. It is the key to unlocking the complex stories your metrics are trying to tell.

    What Is PromQL and Why Does It Matter?

    Without PromQL, Prometheus would be a passive data store, collecting vast quantities of metrics without providing a means to interpret them. PromQL is the interactive component that allows you to query, slice, aggregate, and transform time-series data into a coherent, real-time understanding of your system's operational health.

    This capability is what elevates Prometheus beyond simple monitoring tools. You are not limited to static graphs of raw metrics. Instead, you can execute complex calculations to derive service-level indicators (SLIs), error rates, and latency percentiles. For any SRE, platform, or DevOps engineer, proficiency in PromQL is the foundation for building intelligent dashboards, meaningful alerts, and a robust strategy for continuous monitoring.

    A Language Built for Observability

    SQL is designed for relational data in tables and rows. PromQL, in contrast, was engineered from the ground up for the specific structure of time-series data: a stream of timestamped values, uniquely identified by a metric name and a set of key-value pairs called labels.

    This specialized design makes it exceptionally effective at answering the critical questions that arise in modern observability practices:

    • What was the per-second request rate for my API, averaged over the last five minutes?
    • What is the 95th percentile of request latency for my web server fleet?
    • Which services are experiencing an error rate exceeding 5% over the last 15 minutes?

    At its core, PromQL is a functional language where every query expression, regardless of complexity, evaluates to one of four types: an instant vector, a range vector, a scalar, or a string. This consistent type system is what enables the chaining of functions and operators to build sophisticated, multi-layered queries.

    The Foundation of Modern Monitoring

    PromQL is the foundational query language for the Prometheus monitoring system, which was open-sourced in 2015 and has since become the de facto industry standard for time-series monitoring. It is purpose-built to operate on Prometheus's time-series database (TSDB), enabling granular analysis of high-cardinality metrics. For a comprehensive look at its capabilities, you can explore the many practical PromQL examples on the official Prometheus documentation.

    This guide provides a technical deep-dive into the language, from its fundamental data types and selectors to advanced, battle-tested functions and optimization strategies. By the end, you will be equipped to craft queries that not only monitor your systems but also provide the deep, actionable insights required for maintaining operational excellence. To understand how this fits into a broader strategy, review our guide on what is continuous monitoring.

    Understanding PromQL's Core Building Blocks

    To effectively leverage Prometheus, a firm grasp of its query language, PromQL, is non-negotiable. Think of it as learning the formal grammar required to ask your systems precise, complex questions. Every powerful query is constructed from a few foundational concepts.

    The entire observability workflow hinges on transforming a continuous stream of raw metric data into actionable intelligence. PromQL is the engine that executes this transformation.

    Data workflow diagram showing raw metrics processed through PromQL to generate actionable insights

    Without it, you have an unmanageable volume of numerical data. With it, you derive the insights necessary for high-fidelity monitoring and reliable alerting.

    The Four Essential Metric Types

    Before writing queries, you must understand the data structures you are querying. Prometheus organizes metrics into four fundamental types. Understanding their distinct characteristics is critical, as the type of a metric dictates which PromQL functions and operations are applicable.

    Here is a technical breakdown of the four metric types, each designed for a specific measurement scenario.

    Prometheus Metric Types Explained

    Metric Type Description Typical Use Case
    Counter A cumulative metric representing a monotonically increasing value. It resets to zero only on service restart. Total number of HTTP requests served (http_requests_total), tasks completed, or errors encountered.
    Gauge A single numerical value that can arbitrarily increase or decrease. Current memory usage (node_memory_MemAvailable_bytes), number of active connections, or items in a queue.
    Histogram Samples observations (e.g., request durations) and aggregates them into a set of configurable buckets, exposing them as a _bucket time series. Also provides a _sum and _count of all observed values. Calculating latency SLIs via quantiles (e.g., 95th percentile) or understanding the distribution of response sizes.
    Summary Similar to a histogram, it samples observations but calculates configurable quantiles on the client-side and exposes them directly. Used for client-side aggregation of quantiles, though histograms are generally preferred for their server-side aggregation flexibility and correctness.

    Mastering these types is the first step. Counters are for cumulative event counts, Gauges represent point-in-time measurements, and Histograms are essential for calculating accurate quantiles and understanding data distributions.

    Instant Vectors Versus Range Vectors

    This next concept is the most critical principle in PromQL. A correct understanding of the distinction between an instant vector and a range vector is the key to unlocking the entire language.

    An instant vector is a set of time series where each series has a single data point representing the most recent value at a specific evaluation timestamp. When you execute a simple query like http_requests_total, you are requesting an instant vector—the "now" value for every time series matching that metric name.

    A range vector, conversely, is a set of time series where each series contains a range of data points over a specified time duration. It represents a window of historical data. You create one using a range selector in square brackets, such as http_requests_total[5m], which fetches all recorded data points for the matching series within the last five minutes.

    The distinction is simple but profound: instant vectors provide the current state, while range vectors provide historical context. A range vector cannot be directly graphed as it contains multiple timestamps per series. It must be passed to a function like rate() or avg_over_time() which aggregates the historical data into a new instant vector, where each output series has a single, calculated value.

    Targeting Data With Label Selectors

    A metric name like http_requests_total alone identifies a set of time series. Its true power is realized through labels—key-value pairs such as job="api-server" or method="GET"—which add dimensionality and context, turning a flat metric into a rich, queryable dataset.

    PromQL's label selectors are the mechanism for filtering this data with surgical precision. They are specified within curly braces {} immediately following the metric name.

    Here are the fundamental selector operators:

    • Exact Match (=): Selects time series where a label's value is an exact string match.
      http_requests_total{job="api-server", status="500"}

    • Negative Match (!=): Excludes time series with a specific label value.
      http_requests_total{status!="200"}

    • Regex Match (=~): Selects series where a label's value matches a RE2 regular expression.
      http_requests_total{status=~"5.."} (Selects all 5xx status codes)

    • Negative Regex Match (!~): Excludes series where a label's value matches a regular expression.
      http_requests_total{path!~"/healthz|/ready"}

    Mastering the combination of a metric name and a set of label selectors is the foundation of every PromQL query. Whether you are constructing a dashboard panel, defining an alert, or performing ad-hoc analysis, it all begins with precise data selection.

    Unlocking PromQL Operators and Functions

    Once you have mastered selecting time series, the next step is to transform that data into meaningful information using Prometheus Query Language's rich set of operators and functions. These tools allow you to perform calculations, combine metrics, and derive new insights that are not directly exposed by your instrumented services. They are the verbs of PromQL, converting static data points into a dynamic narrative of your system's behavior.

    This process involves a logical progression from raw data, such as a counter's increase, to a more insightful metric like a per-second rate. From there, you can aggregate further into high-level views like a quantile_over_time to verify Service Level Objectives (SLOs).

    Diagram showing Prometheus query language operations converting increase to rate, then indices to quantile over time

    Let's dissect the essential tools for this transformation, starting with the fundamental arithmetic that underpins most queries.

    Performing Calculations with Arithmetic Operators

    PromQL supports standard arithmetic operators (+, -, *, /, %, ^) that operate between instant vectors on a one-to-one basis. This means Prometheus matches time series with the exact same set of labels from both the left and right sides of the operator and then performs the calculation for each matching pair.

    For example, to calculate the ratio of HTTP 5xx errors to total requests, you could write:

    # Calculate the ratio of 5xx errors to total requests, preserving endpoint labels
    sum by (job, path) (rate(http_requests_total{status=~"5.."}[5m]))
    /
    sum by (job, path) (rate(http_requests_total[5m]))
    

    This works perfectly when the labels match. However, when they don't, you must use vector matching clauses like on() and ignoring() to explicitly control which labels are used for matching. For many-to-one or one-to-many matches, you must also use group_left() or group_right() to define cardinality.

    Filtering Results with Logical Operators

    Logical operators (and, or, unless) are used for advanced set-based filtering. Unlike arithmetic operators that calculate new values, these operators filter a vector based on the presence of matching series in another vector.

    • vector1 and vector2: Returns elements from vector1 that have a matching label set in vector2.
    • vector1 or vector2: Returns all elements from vector1 plus any from vector2 that do not have a matching label set in vector1.
    • vector1 unless vector2: Returns elements from vector1 that do not have a matching label set in vector2.

    A practical application is to find high-CPU processes that are also exhibiting high memory usage, thereby isolating resource-intensive applications.

    Essential Functions for Counter Metrics

    Counters are the most prevalent metric type, but their raw, cumulative value is rarely useful for analysis. You need functions to derive their rate of change. The three primary functions for this are rate(), irate(), and increase().

    Key Takeaway: The primary difference between rate() and irate() is their calculation window. rate() computes an average over the entire time range, providing a smoothed, stable value ideal for alerting. irate(), in contrast, uses only the last two data points, making it highly responsive but volatile, and thus better suited for high-resolution graphing of rapidly changing series.

    • rate(v range-vector): This is the workhorse function for counters. It calculates the per-second average rate of increase over the specified time window. It is robust against scrapes being missed and is the recommended function for alerting and dashboards.
      # Calculate the average requests per second over the last 5 minutes
      rate(http_requests_total{job="api-server"}[5m])
      
    • irate(v range-vector): This calculates the "instantaneous" per-second rate of increase using only the last two data points in the range vector. It is more responsive to sudden changes but can be noisy and should be used cautiously for alerting.
      # Calculate the instantaneous requests per second
      irate(http_requests_total{job="api-server"}[5m])
      
    • increase(v range-vector): This calculates the total, absolute increase of a counter over the specified time range. It is essentially rate(v) * seconds_in_range. Use this when you need the total count of events in a window, not the rate.
      # Calculate the total number of requests in the last hour
      increase(http_requests_total{job="api-server"}[1h])
      

    Aggregating Data into Meaningful Views

    Analyzing thousands of individual time series is impractical. Aggregation operators are used to condense many series into a smaller, more meaningful set.

    Common aggregation operators include:

    • sum(): Calculates the sum over dimensions.
    • avg(): Calculates the average over dimensions.
    • count(): Counts the number of series in the vector.
    • topk(): Selects the top k elements by value.
    • quantile(): Calculates the φ-quantile (e.g., 0.95 for the 95th percentile) over dimensions.

    The by and without clauses provide control over grouping. For example, sum by (job) aggregates all series, preserving only the job label.

    # Calculate the 95th percentile of API request latency over the last 10 minutes, aggregated by endpoint path
    histogram_quantile(0.95, sum(rate(http_request_duration_seconds_bucket[10m])) by (le, path))
    

    This final example demonstrates PromQL's expressive power, chaining selectors, functions, and operators. It transforms a raw histogram metric into a precise SLI, answering a critical question about system performance.

    Advanced PromQL Techniques

    Moving beyond basic operations is where PromQL transforms from a simple query tool into a comprehensive diagnostic engine for your entire infrastructure. This is where you master advanced aggregation, subqueries, and rule evaluation to proactively identify and diagnose complex issues before they impact users.

    The following techniques are standard practice for any SRE or DevOps engineer responsible for building a robust, scalable monitoring solution. They enable the precomputation of expensive queries, the creation of intelligent, low-noise alerts, and multi-step calculations that uncover deep insights into system behavior.

    Fine-Tuning Aggregation with by and without

    We've seen how operators like sum() and avg() can aggregate thousands of time series into a single value. However, for meaningful analysis, you often need more granular control. The by (...) and without (...) clauses provide this control.

    These clauses modify the behavior of an aggregation operator, allowing you to preserve specific labels in the output vector.

    • by (label1, label2, ...): Aggregates the vector, but preserves the listed labels in the result. All other labels are removed.
    • without (label1, label2, ...): Aggregates the vector, removing the listed labels but preserving all others.

    For example, to calculate the total HTTP request rate while retaining the breakdown per application instance, the by (instance) clause is used:

    # Get the total request rate, broken down by individual instance
    sum by (instance) (rate(http_requests_total[5m]))
    

    This query aggregates away labels like method or status_code but preserves the instance label, resulting in a clean, per-instance summary. This level of precision is critical for building dashboards that tell a clear story without being cluttered by excessive dimensionality.

    Unleashing the Power of Subqueries

    Subqueries are one of PromQL's most advanced features, enabling you to run a query over the results of another query. This allows for two-step calculations that are impossible with a standard query.

    A subquery first evaluates an inner query as a range vector and then allows an outer function like rate() or max_over_time() to be applied to that intermediate result. The syntax is <instant_vector_query>[<duration>:<resolution>].

    A subquery facilitates a nested time-series calculation. First, an inner query is evaluated at regular steps over a duration. Then, an outer function operates on the resulting range vector. This is ideal for answering questions like, "What was the maximum 5-minute request rate over the past day?"

    Consider a common SRE requirement: "What was the peak 95th percentile API latency at any point in the last 24 hours?" A standard query can only provide the current percentile. A subquery solves this elegantly:

    # Calculate the maximum 95th percentile latency observed over the past 24 hours, evaluated every minute
    max_over_time(
      (histogram_quantile(0.95, sum(rate(api_latency_seconds_bucket[5m])) by (le)))[24h:1m]
    )
    

    The inner query histogram_quantile(...) calculates the 5-minute 95th percentile latency. The subquery syntax [24h:1m] executes this calculation for every minute over the last 24 hours, producing a range vector. Finally, the outer max_over_time() function scans this intermediate result to find the single highest value.

    Automating with Recording and Alerting Rules

    Executing complex queries ad-hoc is useful for investigation, but it is inefficient for dashboards and alerting. This repeated computation puts unnecessary load on Prometheus. Recording rules and alerting rules are the solution.

    Recording rules precompute frequently needed or expensive queries. Prometheus evaluates the expression at a regular interval and saves the result as a new time series. Dashboards and other queries can then use this new, lightweight metric for significantly faster performance.

    For example, a recording rule can continuously calculate the average CPU usage across a cluster:

    # rules.yml
    groups:
    - name: cpu_rules
      rules:
      - record: instance:node_cpu:avg_rate5m
        expr: avg by (instance) (rate(node_cpu_seconds_total{mode="idle"}[5m]))
    

    Alerting rules, conversely, are the core of proactive monitoring. A PromQL expression defines a failure condition. Prometheus evaluates it continuously, and if the expression returns a value (i.e., the condition is met) for a specified duration (for), it fires an alert.

    This example alert predicts if a server's disk will be full in the next four hours:

    - alert: HostDiskWillFillIn4Hours
      expr: predict_linear(node_filesystem_free_bytes{fstype!~"tmpfs"}[1h], 4 * 3600) < 0
      for: 10m
      labels:
        severity: warning
      annotations:
        summary: "Host disk is predicted to fill up in 4 hours (instance {{ $labels.instance }})"
        description: "Filesystem {{ $labels.mountpoint }} on {{ $labels.instance }} is projected to run out of space."
    

    These rules transform PromQL from an analytical tool into an automated infrastructure defense system, a core principle of effective infrastructure monitoring best practices.

    Industry data validates this trend. A recent survey shows that by 2025, over 50% of observability engineers report increased reliance on Prometheus and PromQL. This adoption highlights its critical role in managing the complexity and high-cardinality data of modern cloud-native architectures.

    Writing High-Performance PromQL Queries

    A powerful query is only effective if it executes efficiently. In a production environment, a poorly constructed PromQL expression can easily overload a Prometheus server, resulting in slow dashboards, delayed alerts, and significant operational friction. Writing high-performance PromQL is a critical skill for maintaining a reliable monitoring system.

    This section focuses on query performance optimization, covering common anti-patterns and actionable best practices for writing lean, fast, and scalable queries.

    Hand-drawn funnel diagram showing query optimization stages with labels for Stopwatch, Guidelines, and fan selectors

    Identifying Common Performance Bottlenecks

    Before optimizing, one must first identify common performance bottlenecks. Certain PromQL patterns are notorious for high consumption of CPU, memory, and disk I/O. As metric volume and cardinality grow, these inefficiencies can lead to systemic performance degradation.

    Be vigilant for these classic performance pitfalls:

    • Unselective Label Matching: A query like api_http_requests_total without specific label selectors forces Prometheus to load every time series for that metric name into memory before processing. This "series explosion" is a primary cause of server overload.
    • Expensive Regular Expressions: Using a broad regex like {job=~".*-server"} on a high-cardinality label forces Prometheus to execute the pattern match against every unique value for that label, leading to high CPU usage.
    • Querying Large Time Ranges: Requesting raw data points over extended periods (days or weeks) without aggregation necessitates fetching and processing a massive volume of samples from the on-disk TSDB.

    These issues often have a compounding effect. A single inefficient query on a frequently refreshed Grafana dashboard can create a "query of death" scenario, impacting the entire monitoring infrastructure.

    Best Practices for Lean and Fast Queries

    Writing efficient PromQL is an exercise in precision. The primary objective is to request the absolute minimum amount of data required to answer a question, thereby reducing the load on the Prometheus server and ensuring responsive dashboards and alerts. For a comprehensive look at optimizing system efficiency, including query performance, refer to this detailed guide on performance engineering.

    Incorporate these key strategies into your workflow:

    • Be Specific First: Always start with the most restrictive label selectors possible. A query like rate(api_http_requests_total{job="auth-service", env="prod"}[5m]) is orders of magnitude more efficient than one without selectors.
    • Anchor Regular Expressions: When a regex is unavoidable, anchor it to the start (^) or end ($) of the string where possible. job=~"^api-server" is significantly more performant than job=~".*api-server".
    • Utilize Recording Rules: For complex or slow queries that are used frequently (e.g., on key dashboards or in multiple alerts), precompute their results with recording rules. This shifts the computational load from query time to scrape time, drastically improving dashboard load times.

    Your primary optimization strategy should always be to reduce the number of time series processed by a query at each stage. The fewer series Prometheus must load from disk and hold in memory, the faster the query will execute. This is the fundamental principle of PromQL performance tuning.

    The Impact of Architecture on Query Speed

    Query performance is not solely a function of PromQL syntax; it is deeply interconnected with the underlying Prometheus architecture. Decisions regarding data collection, storage, and federation have a direct and significant impact on query latency.

    Consider these architectural factors:

    • Scrape Interval: A shorter scrape interval (e.g., 15 seconds) provides higher resolution data but also increases the number of samples stored. Queries over long time ranges will have more data points to process.
    • Data Retention: A long retention period is valuable for historical analysis but increases the on-disk data size. Queries spanning the full retention period will naturally be slower as they must read more data blocks.
    • Cardinality: The total number of unique time series is the single most critical factor in Prometheus performance. Actively managing and avoiding high-cardinality labels is essential for maintaining a healthy and performant instance. For expert guidance on architecting and managing your observability stack, consider specialized Prometheus services.

    At scale, Prometheus performance is bound by system resources. Benchmarks show it can average a disk I/O of 147 MiB/s, with complex query latencies around 1.83 seconds. These metrics underscore the necessity of optimization at every layer of the monitoring stack.

    Answering Common PromQL Questions

    PromQL is exceptionally powerful, but certain concepts can be challenging even for experienced engineers. This section addresses some of the most common questions and misconceptions to help you troubleshoot more effectively and build more reliable monitoring.

    What's the Real Difference Between rate() and irate()?

    This is a frequent point of confusion. Both rate() and irate() calculate the per-second rate of increase for a counter, but their underlying calculation methods are fundamentally different, leading to distinct use cases.

    rate() provides a smoothed, stable average. It considers all data points within the specified time window (e.g., [5m]) to calculate the average rate over that entire period. This averaging effect makes rate() the ideal function for alerting and dashboards. It is resilient to scrape misses and won't trigger false positives due to minor, transient fluctuations.

    irate(), in contrast, provides an "instantaneous" rate. It only uses the last two data points within the time window for its calculation. This makes it highly sensitive and prone to spikes. While useful for high-resolution graphs intended to visualize rapid changes, it is a poor choice for alerting due to its inherent volatility.

    How Do I Handle Counter Resets in My Queries?

    The good news: PromQL handles this for you automatically. Functions designed to operate on counters—rate(), irate(), and increase()—are designed to be robust against counter resets.

    When a service restarts, its counters typically reset to zero. When PromQL's rate-calculation functions encounter a value that is lower than the previous one in the series, they interpret this as a counter reset and automatically adjust their calculation. This built-in behavior ensures that your graphs and alerts remain accurate even during deployments or service restarts, preventing anomalous negative rates.

    Why Is My PromQL Query Returning Nothing?

    An empty result set from a query is a common and frustrating experience. The cause is usually a simple configuration or selection error. Systematically checking these common issues will resolve the problem over 90% of the time.

    • Is the Time Range Correct? First, verify the time window in your graphing interface (e.g., Grafana, Prometheus UI). Are you querying a period before the metric was being collected?
    • Any Typos in the Selector? This is a very common mistake. A typographical error in a metric name or label selector (e.g., stauts instead of status or "prod" instead of "production") will result in a selector that matches no series. Meticulously check every character.
    • Is There Data at This Exact Timestamp? An instant query (via the /api/v1/query endpoint) requires a data sample at the precise evaluation timestamp. If the last scrape was just before this timestamp, the result will be empty. To diagnose this, run a range query over a short period (e.g., my_metric[1m]) to see if the time series exists within that window.
    • Is the Target Up and Scraped? Navigate to the "Targets" page in the Prometheus UI. If the endpoint responsible for exposing the metric is listed as 'DOWN', Prometheus cannot scrape it, and therefore, no data will be available to query.

    By methodically working through this checklist, you can quickly identify and resolve the root cause of an empty query result.


    Ready to implement a rock-solid observability strategy without the overhead? At OpsMoon, we connect you with elite DevOps engineers who can design, build, and manage your entire monitoring stack, from Prometheus architecture to advanced PromQL dashboards and alerts. Start with a free work planning session and let's map out your path to operational excellence.

  • A Technical Guide to Bare Metal Kubernetes Performance

    A Technical Guide to Bare Metal Kubernetes Performance

    Bare metal Kubernetes is the practice of deploying Kubernetes directly onto physical servers, completely removing the virtualization layer. This architecture provides applications with direct, unimpeded access to hardware resources, resulting in superior performance and significantly lower latency for I/O and compute-intensive workloads.

    Think of it as the difference between a high-performance race car with the engine bolted directly to the chassis versus a daily driver with a complex suspension system. One is engineered for raw, unfiltered power and responsiveness; the other is designed for abstracted comfort at the cost of performance.

    Unleashing Raw Performance with Bare Metal Kubernetes

    An illustration of a server rack with network cables, symbolizing a bare metal Kubernetes setup.

    When engineering teams need to extract maximum performance, they turn to bare metal Kubernetes. The core principle is eliminating the hypervisor. In a typical cloud or on-prem VM deployment, a hypervisor sits between your application's operating system and the physical hardware, managing resource allocation.

    While hypervisors provide essential flexibility and multi-tenancy, they introduce a "virtualization tax"—a performance overhead that consumes CPU cycles, memory, and adds I/O latency. For most general-purpose applications, this is a reasonable trade-off for the convenience and operational simplicity offered by cloud providers. (We break down these benefits in our comparison of major cloud providers.)

    However, for high-performance computing (HPC), AI/ML, and low-latency financial services, this performance penalty is unacceptable.

    A bare metal Kubernetes setup is like a finely tuned race car. By mounting the engine (Kubernetes) directly to the chassis (the physical hardware), you get an unfiltered, powerful connection. A virtualized setup is more like a daily driver with a complex suspension system (the hypervisor)—it gives you a smoother, more abstracted ride, but you lose that raw speed and responsiveness.

    The Decisive Advantages of Direct Hardware Access

    Running Kubernetes directly on the server's host OS unlocks critical advantages that are non-negotiable for specific, demanding use cases. The primary benefits are superior performance, minimal latency, and greater cost-efficiency at scale.

    • Superior Performance: Applications gain direct, exclusive access to specialized hardware like GPUs, FPGAs, high-throughput network interface cards (NICs), and NVMe drives. This is mission-critical for AI/ML training, complex data analytics, and high-frequency trading platforms where hardware acceleration is key.
    • Rock-Bottom Latency: By eliminating the hypervisor, you remove a significant source of I/O and network latency. This translates to faster transaction times for databases, lower response times for caches, and more predictable performance for real-time data processing pipelines.
    • Significant Cost Savings: While initial capital expenditure can be higher, a bare metal approach eliminates hypervisor licensing fees (e.g., VMware). At scale, owning and operating hardware can result in a substantially lower total cost of ownership (TCO) compared to the consumption-based pricing of public clouds.

    Kubernetes adoption has exploded, with over 90% of enterprises now using the platform. As these deployments mature, organizations are recognizing the performance ceiling imposed by virtualization. By moving to bare metal, they observe dramatically lower storage latency and higher IOPS, especially for database workloads. Direct hardware access allows containers to interface directly with NVMe devices via the host OS, streamlining the data path and maximizing throughput.

    To provide a clear technical comparison, here is a breakdown of how these deployment models stack up.

    Kubernetes Deployment Model Comparison

    This table offers a technical comparison to help you understand the key trade-offs in performance, cost, and operational complexity for each approach.

    Attribute Bare Metal Kubernetes Cloud-Managed Kubernetes On-Prem VM Kubernetes
    Performance & Latency Highest performance, lowest latency Good performance, but with virtualization overhead Moderate performance, with hypervisor and VM overhead
    Cost Efficiency Potentially lowest TCO at scale, but high initial investment Predictable OpEx, but can be costly at scale High initial hardware cost plus hypervisor licensing fees
    Operational Overhead Highest; you manage everything from hardware up Lowest; cloud provider manages the control plane and infrastructure High; you manage the hardware, hypervisor, and Kubernetes control plane
    Hardware Control Full control over hardware selection and configuration Limited to provider's instance types and options Full control, but constrained by hypervisor compatibility
    Best For High-performance computing, AI/ML, databases, edge computing General-purpose applications, startups, teams prioritizing speed Enterprises with existing virtualization infrastructure and expertise

    Ultimately, the choice to run Kubernetes on bare metal is a strategic engineering decision. It requires balancing the pursuit of absolute control and performance against the operational simplicity of a managed service.

    Designing a Production-Ready Cluster Architecture

    Architecting a bare metal Kubernetes cluster is analogous to engineering a high-performance vehicle from individual components. You are responsible for every system: the chassis (physical servers), the engine (Kubernetes control plane), and the suspension (networking and storage). The absence of a hypervisor means every architectural choice has a direct and measurable impact on performance and reliability.

    Unlike cloud environments where VMs are ephemeral resources, bare metal begins with physical servers. This necessitates a robust and automated node provisioning strategy. Manual server configuration is not scalable and introduces inconsistencies that can destabilize the entire cluster.

    Automated provisioning is a foundational requirement.

    Automating Physical Node Provisioning

    To ensure consistency and velocity, you must employ tools that manage the entire server lifecycle—from PXE booting and firmware updates to OS installation and initial configuration—without manual intervention. This is Infrastructure as Code (IaC) applied to physical hardware.

    Two leading open-source solutions in this domain are:

    • MAAS (Metal as a Service): A project from Canonical, MAAS transforms your data center into a private cloud fabric. It automatically discovers hardware on the network (via DHCP and PXE), profiles its components (CPU, RAM, storage), and deploys specific OS images on demand, treating physical servers as composable, API-driven resources.
    • Tinkerbell: A CNCF sandbox project, Tinkerbell provides a flexible, API-driven workflow for bare-metal provisioning. It operates as a set of microservices, making it highly extensible for complex, multi-stage provisioning pipelines defined via YAML templates.

    Utilizing such tools ensures every node is a perfect, idempotent replica, which is a non-negotiable prerequisite for a stable Kubernetes cluster. As you design your architecture, remember that fundamental scaling decisions will also dictate your cluster's long-term efficiency and performance characteristics.

    High-Throughput Networking Strategies

    Networking on bare metal is fundamentally different from cloud environments. You exchange the convenience of managed VPCs and load balancers for raw, low-latency access to the physical network fabric. This hands-on approach delivers significant performance gains.

    The primary objective of bare-metal networking is to minimize the path length for packets traveling between pods and the physical network. By eliminating virtual switches and overlay networks (like VXLAN), you eradicate encapsulation overhead and reduce latency, providing applications with a high-bandwidth, low-latency communication path.

    For pod-to-pod communication and external service exposure, two key components are required:

    Networking Component Technology Example How It Works in Bare Metal
    Pod Networking (CNI) Calico with BGP Calico can be configured to peer directly with your Top-of-Rack (ToR) physical routers using the Border Gateway Protocol (BGP). This configuration advertises pod CIDR blocks as routable IP addresses on your physical network, enabling direct, non-encapsulated routing and eliminating overlay overhead.
    Service Exposure MetalLB MetalLB functions as a network load-balancer implementation for bare metal clusters. It operates in two modes: Layer 2 (using ARP/NDP to announce service IPs on the local network) or Layer 3 (using BGP to announce service IPs to nearby routers), effectively emulating the functionality of a cloud load balancer.

    Combining Calico in BGP mode with MetalLB provides a powerful, high-performance networking stack that mirrors the functionality of a cloud provider but runs entirely on your own hardware.

    Integrating High-Performance Storage

    Storage is where bare metal truly excels, allowing you to leverage direct-attached NVMe SSDs. Without a hypervisor abstracting the storage I/O path, containers can achieve maximum IOPS and minimal latency—a critical advantage for databases and other stateful applications.

    The Container Storage Interface (CSI) is the standard API for integrating storage systems with Kubernetes. On bare metal, you deploy a CSI driver that can provision and manage storage directly on your nodes' physical block devices. This direct data path is a primary performance differentiator for bare metal Kubernetes.

    This shift is not a niche trend. The global bare-metal cloud market was valued at $2.57 billion in 2021 and grew to $11.55 billion by 2024. Projections indicate it could reach $36.71 billion by 2030, driven largely by AI/ML workloads that demand the raw performance only dedicated hardware can deliver.

    Choosing the Right Deployment Tools

    Once the architecture is defined, the next step is implementation. Deploying Kubernetes on bare metal is a complex orchestration task, and your choice of tooling will profoundly impact your operational workflow and the cluster's long-term maintainability.

    This is a critical decision. The optimal tool depends on your team's existing skill set (e.g., Ansible vs. declarative YAML), your target scale, and the degree of automation required. Unlike managed services that abstract this complexity, on bare metal, the responsibility is entirely yours. The objective is to achieve a repeatable, reliable process for transforming a rack of servers into a fully functional Kubernetes control plane.

    Infographic about bare metal kubernetes

    Each tool offers a different approach to orchestrating the core pillars of provisioning, networking, and storage. Let's analyze the technical trade-offs.

    Automation-First Declarative Tools

    For any cluster beyond a small lab environment, declarative, automation-centric tools are essential. These tools allow you to define your cluster's desired state as code, enabling version control, peer review, and idempotent deployments—the most effective way to mitigate human error.

    Two dominant tools in this category are:

    • Kubespray (Ansible-based): For teams with deep Ansible expertise, Kubespray is the logical choice. It is a comprehensive collection of Ansible playbooks that automates the entire process of setting up a production-grade, highly available cluster. Its strength lies in its extreme customizability, allowing you to control every aspect, from the CNI plugin and its parameters to control plane component flags.
    • Rancher (RKE): Rancher Kubernetes Engine (RKE) provides a more opinionated and streamlined experience. The entire cluster—nodes, Kubernetes version, CNI, and add-ons—is defined in a single cluster.yml file. RKE then uses this manifest to deploy and manage the cluster. It is known for its simplicity and ability to rapidly stand up a production-ready cluster.

    The core philosophy is declarative configuration: you define the desired state in a file, and the tooling's reconciliation loop ensures the cluster converges to that state. This is a non-negotiable practice for managing bare metal Kubernetes at scale.

    The Foundational Approach With Kubeadm

    For engineers who need to understand and control every component, kubeadm is the foundational tool. It is not a complete automation suite but a command-line utility from the Kubernetes project that bootstraps a minimal, best-practice cluster.

    kubeadm handles the most complex tasks, such as generating certificates, initializing the etcd cluster, and configuring the API server. However, it requires you to make key architectural decisions, such as selecting and installing a CNI plugin manually. It is the "build-it-yourself" kit of the Kubernetes world, offering maximum flexibility at the cost of increased operational complexity.

    Teams typically do not use kubeadm directly in production. Instead, they wrap it in custom automation scripts (e.g., Bash or Ansible) or integrate it into a larger Infrastructure as Code framework. For a deeper look, our guide on using Terraform with Kubernetes demonstrates how to automate the underlying infrastructure before passing control to a tool like kubeadm.

    Lightweight Distributions For The Edge

    Not all servers reside in enterprise data centers. For edge computing, IoT, and other resource-constrained environments, a standard Kubernetes distribution is too resource-intensive. Lightweight distributions are specifically engineered for efficiency.

    • K3s: Developed by Rancher, K3s is a fully CNCF-certified Kubernetes distribution packaged as a single binary under 100MB. It replaces the resource-heavy etcd with an embedded SQLite database (with an option for external etcd) and removes non-essential features, making it ideal for IoT gateways, CI/CD runners, and development environments.
    • k0s: Marketed as a "zero friction" distribution, k0s is another single-binary solution. It bundles all necessary components and has zero host OS dependencies, simplifying installation and enhancing security. Its clean, minimal foundation makes it an excellent choice for isolated or air-gapped deployments.

    Bare Metal Kubernetes Deployment Tool Comparison

    Selecting the right deployment tool involves balancing automation, control, and operational complexity. This table summarizes the primary use cases for each approach to guide your technical decision.

    Tool Primary Method Best For Key Feature
    Kubespray Ansible Playbooks Teams with strong Ansible skills needing high customizability for large, complex clusters. Extensive configuration options and broad community support.
    Rancher (RKE) Declarative YAML Organizations seeking a streamlined, opinionated path to a production-ready cluster with a focus on ease of use. Simple cluster.yml configuration and integrated management UI.
    kubeadm Command-Line Utility Engineers who require granular control and want to build a cluster from foundational components. Provides the core building blocks for bootstrapping a conformant cluster.
    K3s / K0s Single Binary Edge computing, IoT, CI/CD, and resource-constrained environments where a minimal footprint is critical. Lightweight, fast installation, and low resource consumption.

    The optimal tool is one that aligns with your team's technical capabilities and the specific requirements of your project. Each of these options is battle-tested and capable of deploying a production-grade bare metal cluster.

    Implementing Production-Grade Operational Practices

    Deploying a bare metal Kubernetes cluster is only the beginning. The primary challenge is maintaining its stability, security, and scalability through day-to-day operations.

    Unlike a managed service where the cloud provider handles operational burdens, on bare metal, you are the provider. This means you are responsible for architecting and implementing robust solutions for high availability, upgrades, security, observability, and disaster recovery.

    This section provides a technical playbook for building a resilient operational strategy. We will focus on the specific tools and processes required to run a production-grade bare metal Kubernetes environment designed for failure tolerance and simplified management.

    Ensuring High Availability and Seamless Upgrades

    High availability (HA) in a bare metal cluster begins with the control plane. A failure of the API server or etcd datastore will render the cluster inoperable, even if worker nodes are healthy. For any production system, a multi-master architecture is a strict requirement.

    This architecture consists of at least three control plane nodes. The critical component is a stacked or external etcd cluster, typically with three or five members, to maintain quorum and tolerate node failures. This redundancy ensures that if one master node fails or is taken down for maintenance, the remaining nodes maintain cluster operations seamlessly.

    Upgrading applications and the cluster itself demands a zero-downtime strategy.

    • Rolling Updates: Kubernetes' native deployment strategy is suitable for stateless applications. It incrementally replaces old pods with new ones, ensuring service availability throughout the process.
    • Canary Deployments: For critical services, a canary strategy offers a safer, more controlled rollout. Advanced deployment controllers like Argo Rollouts integrate with service meshes (e.g., Istio) or ingress controllers to progressively shift a small percentage of traffic to the new version, allowing for performance monitoring and rapid rollback if anomalies are detected.

    In a bare metal environment, you are directly responsible for the entire lifecycle of the control plane and worker nodes. This includes not just Kubernetes version upgrades but also OS-level patching and security updates, which must be performed in a rolling fashion to avoid cluster-wide downtime.

    Building a Comprehensive Observability Stack

    Without the built-in dashboards of a cloud provider, you must construct your own observability stack from scratch. A complete solution requires three pillars: metrics, logs, and traces, providing a holistic view of cluster health and application performance.

    The industry-standard open-source stack includes:

    1. Prometheus for Metrics: The de facto standard for Kubernetes monitoring. Prometheus scrapes time-series metrics from the control plane, nodes (via node-exporter), and applications, enabling detailed performance analysis and alerting.
    2. Grafana for Dashboards: Grafana connects to Prometheus as a data source to build powerful, interactive dashboards for visualizing key performance indicators (KPIs) like CPU/memory utilization, API server latency, and custom application metrics.
    3. Loki for Logs: Designed for operational efficiency, Loki indexes metadata about log streams rather than the full log content. This architecture makes it highly cost-effective for aggregating logs from all pods in a cluster.
    4. Jaeger for Distributed Tracing: In a microservices architecture, a single request may traverse dozens of services. Jaeger implements distributed tracing to visualize the entire request path, pinpointing performance bottlenecks and debugging cross-service failures.

    Hardening Security from the Node Up

    Bare metal security is a multi-layered discipline, starting at the physical hardware level. You control the entire stack, so you must implement security controls at every layer, from the host operating system to the pod-to-pod network policies.

    A comprehensive security checklist must include:

    • Node Hardening: This involves applying mandatory access control (MAC) systems like SELinux or AppArmor to the host OS. Additionally, you must minimize the attack surface by removing unnecessary packages and implementing strict iptables or nftables firewall rules.
    • Network Policies: By default, Kubernetes allows all pods to communicate with each other. This permissive posture must be replaced with a zero-trust model using NetworkPolicy resources to explicitly define allowed ingress and egress traffic for each application.
    • Secrets Management: Never store sensitive data like API keys or database credentials in plain text within manifests. Use a dedicated secrets management solution like HashiCorp Vault, which provides dynamic secrets, encryption-as-a-service, and tight integration with Kubernetes service accounts. Our guide on autoscaling in Kubernetes also offers key insights into dynamically managing your workloads efficiently.

    Implementing Reliable Disaster Recovery

    Every production cluster requires a tested disaster recovery (DR) plan. Hardware fails, configurations are corrupted, and human error occurs. The ability to recover from a catastrophic failure depends entirely on your backup and restore strategy.

    The standard tool for Kubernetes backup and recovery is Velero. Velero provides more than just etcd backups; it captures the entire state of your cluster objects and can integrate with storage providers to create snapshots of your persistent volumes, enabling complete, point-in-time application recovery. For solid data management, it's crucial to prepare for data recovery by understanding different backup strategies like differential vs incremental backups.

    A robust DR plan includes:

    • Regular, Automated Backups: Configure Velero to perform scheduled backups and store the artifacts in a remote, durable location, such as an S3-compatible object store.
    • Stateful Workload Protection: Leverage Velero’s CSI integration to create application-consistent snapshots of your persistent volumes. This ensures data integrity by coordinating the backup with the application's state.
    • Periodic Restore Drills: A backup strategy is unproven until a restore has been successfully tested. Regularly conduct DR drills by restoring your cluster to a non-production environment to validate the integrity of your backups and ensure your team is proficient in the recovery procedures.

    When to Use Bare Metal Kubernetes

    The decision to adopt bare metal Kubernetes is a strategic one, driven by workload requirements and team capabilities. While managed cloud services like GKE or EKS offer unparalleled operational simplicity, certain use cases demand the raw performance that only direct hardware access can provide.

    The decision hinges on whether the "virtualization tax"—the performance overhead introduced by the hypervisor—is an acceptable cost for your application.

    A technical checklist on a digital tablet, symbolizing strategic decision-making for bare metal Kubernetes.

    For organizations operating at the performance frontier, where every microsecond and CPU cycle impacts the bottom line, this choice is critical.

    Ideal Workloads for Bare Metal

    Bare metal Kubernetes delivers its greatest value when applications are highly sensitive to latency and demand high I/O throughput. Eliminating the hypervisor creates a direct, high-bandwidth path between containers and hardware.

    • AI/ML Training and Inference: These workloads require direct, low-latency access to GPUs and high-speed storage. The hypervisor introduces I/O overhead that can significantly slow down model training and increase latency for real-time inference.
    • High-Frequency Trading (HFT): In financial markets where trades are executed in microseconds, the additional network latency from virtualization is a competitive disadvantage. HFT platforms require the lowest possible network jitter and latency, which bare metal provides.
    • Large-Scale Databases: High-transaction databases and data warehouses benefit immensely from direct access to NVMe storage. Bare metal delivers the highest possible IOPS and lowest latency, ensuring the data tier is never a performance bottleneck.
    • Real-Time Data Processing: Stream processing applications, such as those built on Apache Flink or Kafka Streams, cannot tolerate the performance jitter and unpredictable latency that a hypervisor can introduce.

    When Managed Cloud Services Are a Better Fit

    Conversely, the operational simplicity of managed Kubernetes services is often the more pragmatic choice. If your workloads are not performance-critical, can tolerate minor latency variations, or require rapid and unpredictable scaling, the public cloud offers a superior value proposition.

    Startups and teams focused on rapid product delivery often find that the operational overhead of managing bare metal infrastructure is a distraction from their core business objectives.

    The core question is this: Does the performance gain from eliminating the hypervisor justify the significant increase in operational responsibility your team must undertake?

    Interestingly, the potential for long-term cost savings is making bare metal more accessible. Small and medium enterprises (SMEs) are projected to capture 60.69% of the bare metal cloud market revenue by 2025. This adoption is driven by the lower TCO at scale. For detailed market analysis, Data Bridge Market Research provides excellent insights on the rise of bare metal cloud adoption.

    Ultimately, you must perform a thorough technical and business analysis to determine if your team is equipped to manage the entire stack, from physical hardware to the application layer.

    Common Questions About Bare Metal Kubernetes

    When engineering teams first explore bare metal Kubernetes, a common set of technical questions arises. Moving away from the abstractions of the cloud requires a deeper understanding of the underlying infrastructure.

    This section provides direct, practical answers to these frequently asked questions to help clarify the technical realities of a bare metal deployment.

    How Do You Handle Service Load Balancing?

    This is a primary challenge for teams accustomed to the cloud. In a cloud environment, creating a service of type LoadBalancer automatically provisions a cloud load balancer. On bare metal, this functionality must be implemented manually.

    The standard solution is MetalLB. MetalLB is a network load-balancer implementation for bare metal clusters that integrates with standard networking protocols. It can operate in two primary modes:

    • Layer 2 Mode: MetalLB responds to ARP requests on the local network for the service's external IP, directing traffic to one of the service's pods.
    • BGP Mode: For more advanced routing, MetalLB can establish a BGP session with your physical routers to announce the service's external IP, enabling true load balancing across multiple nodes.

    For Layer 7 (HTTP/S) traffic, you still deploy a standard Ingress controller like NGINX or Traefik. MetalLB handles the Layer 4 task of routing external traffic to the Ingress controller pods.

    What Is the Real Performance Difference?

    The performance difference is significant and measurable. By eliminating the hypervisor, you remove the "virtualization tax," which is the CPU and memory overhead required to manage virtual machines.

    This gives applications direct, unimpeded access to physical hardware, which is especially impactful for I/O-bound or network-intensive workloads.

    For databases, message queues, and AI/ML training, the performance improvement can range from 10% to over 30% in terms of throughput and reduced latency. The exact gain depends on the specific workload, hardware, and system configuration, but the benefits are substantial.

    Is Managing Bare Metal Significantly More Complex?

    Yes, the operational burden is substantially higher. Managed services like GKE and EKS abstract away the complexity of the underlying infrastructure. The cloud provider manages the control plane, node provisioning, upgrades, and security patching.

    On bare metal, your team assumes full responsibility for:

    • Hardware Provisioning: Racking, cabling, and configuring physical servers.
    • OS Installation and Hardening: Deploying a base operating system and applying security configurations.
    • Network and Storage Configuration: Integrating the cluster with physical network switches and storage arrays.
    • Full Kubernetes Lifecycle Management: Installing, upgrading, backing up, and securing the entire Kubernetes stack.

    You gain ultimate control and performance in exchange for increased operational complexity, requiring a skilled team with expertise in both Kubernetes and physical infrastructure management.

    How Do You Manage Persistent Storage?

    Persistent storage for stateful applications on bare metal is managed via the Container Storage Interface (CSI). CSI is a standard API that decouples storage logic from the core Kubernetes code, allowing any storage system to integrate with Kubernetes.

    You deploy a CSI driver specific to your storage backend. For direct-attached NVMe drives, you can use a driver like TopoLVM or the Local Path Provisioner to expose local block or file storage to pods. For external SAN or NAS systems, the vendor provides a dedicated CSI driver.

    A powerful strategy is to build a software-defined storage layer using a project like Rook-Ceph. Rook deploys and manages a Ceph storage cluster that pools the local disks from your Kubernetes nodes into a single, resilient, distributed storage system. Pods then consume storage via the Ceph CSI driver, gaining enterprise-grade features like replication, snapshots, and erasure coding on commodity hardware.


    Managing the complexities of a bare metal Kubernetes environment requires deep expertise. OpsMoon connects you with the top 0.7% of global DevOps engineers who specialize in building and operating high-performance infrastructure. Whether you need an end-to-end project delivery or expert hourly capacity, we provide the talent to accelerate your goals. Start with a free work planning session today at opsmoon.com.

  • A Technical Guide to PostgreSQL on Kubernetes for Production

    A Technical Guide to PostgreSQL on Kubernetes for Production

    Running PostgreSQL on Kubernetes represents a significant architectural evolution, migrating database management from static, imperative processes to a dynamic, declarative paradigm. This integration aligns the data layer with the cloud-native ecosystem housing your applications, establishing a unified, automated operational model.

    Why Run PostgreSQL on Kubernetes in Production

    A stylized graphic showing the PostgreSQL and Kubernetes logos connected, representing their integration.

    Let's be clear: deciding to run a stateful workhorse like PostgreSQL on Kubernetes is a major architectural choice. This isn't just about containerizing a database; it's a fundamental shift in managing your data persistence layer. Before addressing the "how," you must solidify the "why," which invariably ties back to the understanding non-functional requirements of your system, such as availability, scalability, and recoverability.

    This approach establishes an incredibly consistent environment from development through production. Your database lifecycle begins to adhere to the same declarative configuration and GitOps workflows as your stateless applications, eliminating operational silos.

    The Rise of a Standardized Platform

    Kubernetes is the de facto standard for container orchestration, with adoption rates hitting 96% and market dominance at 92%. This isn't transient hype; enterprises are standardizing on it for the automation and operational efficiencies it provides.

    This widespread adoption means your engineering teams can leverage existing Kubernetes expertise to manage the database, significantly flattening the learning curve and reducing the operational burden of maintaining disparate, bespoke database management toolchains.

    By treating the database as another workload within the cluster, you gain tangible benefits:

    • Infrastructure Consistency: The same YAML manifests, CI/CD pipelines, and monitoring stacks (e.g., Prometheus/Grafana) used for your applications can now manage your database's entire lifecycle.
    • Developer Self-Service: Developers can provision production-like database instances on-demand, within platform-defined guardrails, drastically accelerating development and testing cycles.
    • Cloud Neutrality: A Kubernetes-based PostgreSQL deployment is inherently portable. You can migrate the entire application stack—services and data—between on-premise data centers and various cloud providers with minimal refactoring.

    Unlocking GitOps for Databases

    Perhaps the most compelling advantage is managing database infrastructure via GitOps. This paradigm replaces manual configuration tweaks and imperative scripting against production databases with a fully declarative model. Your entire PostgreSQL cluster configuration—from the Postgres version and replica count to backup schedules and pg_hba.conf rules—is defined as code within a Git repository.

    This declarative approach doesn't just automate deployments. It establishes an immutable, auditable log of every change to your database infrastructure. For compliance audits (e.g., SOC 2, ISO 27001) and root cause analysis in a production environment, this is invaluable.

    Modern Kubernetes Operators extend this concept by encapsulating the complex logic of database administration. These operators function as automated DBAs, handling mission-critical tasks like high availability (HA), automated failover, backups, and point-in-time recovery (PITR). They are the core technology that makes running PostgreSQL on Kubernetes not just feasible, but a strategically sound choice for production workloads.

    Choosing Your Deployment Strategy

    Selecting the right deployment strategy for PostgreSQL on Kubernetes is a foundational decision that dictates operational workload, scalability patterns, and future flexibility. This choice balances control against convenience, presenting three primary technical paths, from a completely manual implementation to a fully managed service.

    Manual StatefulSets: The DIY Approach

    Employing manual StatefulSets is the most direct, low-level method for running PostgreSQL on Kubernetes. This approach grants you absolute, granular control over every component of your database cluster. You are responsible for scripting all operational logic: pod initialization, primary-replica configuration, backup orchestration, and failover procedures.

    This level of control allows for deep customization of PostgreSQL parameters and the implementation of bespoke high-availability topologies. However, this power comes at a significant operational cost. Your team must build and maintain the complex automation that a production-grade operator provides out-of-the-box.

    StatefulSets are generally reserved for teams with deep, dual expertise in both Kubernetes internals and PostgreSQL administration. If you have a non-standard requirement—such as a unique replication topology—that off-the-shelf operators cannot satisfy, this may be a viable option. For most use cases, the required engineering investment presents a significant barrier.

    Kubernetes Operators: The Automation Sweet Spot

    PostgreSQL Operators represent a paradigm shift for managing stateful applications on Kubernetes. An Operator is a domain-specific controller that extends the Kubernetes API to automate complex operational tasks. It effectively encodes the knowledge of an experienced DBA into software.

    With an Operator, you manage your database cluster via a Custom Resource Definition (CRD). Instead of manipulating individual Pods, Services, and ConfigMaps, you declare the desired state in a high-level YAML manifest. For example: "I require a three-node PostgreSQL 16 cluster with continuous archiving to an S3-compatible object store." The Operator then works to reconcile the cluster's current state with your declared state.

    • Automated Failover: The Operator continuously monitors the primary instance's health. Upon failure detection, it orchestrates a failover by promoting a suitable replica, updating the primary service endpoint, and ensuring minimal application downtime.
    • Simplified Backups: Backup schedules and retention policies are defined declaratively in the manifest. The Operator manages the entire backup lifecycle, including base backups and continuous WAL (Write-Ahead Log) archiving for Point-in-Time Recovery (PITR).
    • Effortless Upgrades: To apply a minor version update (e.g., 16.1 to 16.2), you modify a single line in the CRD. The Operator executes a controlled rolling update, minimizing service disruption.

    This strategy strikes an optimal balance. You retain full control over your infrastructure and data while offloading complex, error-prone database management tasks to battle-tested automation. If you're managing infrastructure as code, our guide on combining Terraform with Kubernetes can help you build a fully declarative workflow.

    Managed Services: The Hands-Off Option

    The third path is to use a managed Database-as-a-Service (DBaaS) built on a Kubernetes-native architecture, such as Amazon RDS on Outposts or Google Cloud's AlloyDB Omni. This is the simplest option from an operational perspective, abstracting away nearly all underlying infrastructure complexity.

    You receive a PostgreSQL endpoint, and the cloud provider manages patching, backups, availability, and scaling. It’s an excellent choice for teams that want to focus exclusively on application development and have no desire to manage database infrastructure.

    This convenience involves trade-offs: reduced control over specific PostgreSQL configurations, vendor lock-in, and potentially less granular control over data residency and network policies. The total cost of ownership (TCO) can also be significantly higher than a self-managed solution, particularly at scale.

    The industry is clearly converging on this model. A 2023 Gartner analysis highlights a market shift toward cloud neutrality, with organizations increasingly leveraging Kubernetes with PostgreSQL for portability. Major cloud providers like Microsoft now endorse PostgreSQL operators like CloudNativePG as a standard for production workloads on Azure Kubernetes Service (AKS). This endorsement, detailed in a CNCF blog post on cloud-neutral PostgreSQL on CNCF.io, signals that Operators are a mature, production-ready standard.


    To clarify the decision, here is a technical comparison of the three deployment strategies.

    PostgreSQL on Kubernetes Deployment Method Comparison

    Attribute Manual StatefulSets PostgreSQL Operator (e.g., CloudNativePG) Managed Cloud Service (DBaaS)
    Operational Overhead Very High. Requires deep, ongoing manual effort and custom scripting. Low. Automates lifecycle management (failover, backups, upgrades). Effectively Zero. Fully managed by the cloud provider.
    Control & Flexibility Maximum. Full control over PostgreSQL config, topology, and tooling. High. Granular control via CRD, but within the Operator's framework. Low to Medium. Limited to provider-exposed settings.
    Speed of Deployment Slow. Requires significant initial engineering to build automation. Fast. Deploy a production-ready cluster with a single YAML manifest. Very Fast. Provisioning via cloud console or API in minutes.
    Required Expertise Expert-level in both Kubernetes and PostgreSQL administration. Intermediate Kubernetes knowledge. Operator handles DB expertise. Minimal. Basic knowledge of the cloud provider's service is sufficient.
    Portability High. Can be deployed on any conformant Kubernetes cluster. High. Operator-based; portable across any cloud or on-prem K8s. Very Low. Tightly coupled to the specific cloud provider's ecosystem.
    Cost (TCO) Low to Medium. Primarily engineering and operational staff costs. Low. Open-source options have no license fees. Staff costs are reduced. High. Premium pricing for convenience, especially at scale.
    Best For Niche use cases requiring bespoke configurations; teams with deep in-house expertise. Most production workloads seeking a balance of control and automation. Teams prioritizing development speed over infrastructure control; smaller projects.

    Ultimately, the optimal choice is contingent on your team's skillset, application requirements, and business objectives. For most modern applications on Kubernetes, a well-supported PostgreSQL Operator provides the ideal combination of control, automation, and operational efficiency.

    Let's transition from theory to practical implementation. Deploying PostgreSQL on Kubernetes with an Operator like CloudNativePG allows you to provision a production-ready database cluster from a single, declarative manifest, a stark contrast to the procedural complexity of manual StatefulSets.

    The Cluster Custom Resource (CR) becomes the single source of truth for the database's entire lifecycle—its configuration, version, and architecture, making it a perfect fit for any GitOps workflow.

    A decision tree showing that if you don't need full control, and you do need automation, an Operator is the right choice for running PostgreSQL on Kubernetes.

    This decision comes down to finding the right balance. Operators are the ideal middle ground for teams who need serious automation but aren't willing to give up essential control. You get the best of both worlds—avoiding the heavy lifting of StatefulSets without being locked into the rigidity of a managed service.

    Installing the Operator

    Before provisioning a PostgreSQL cluster, the operator itself must be installed into your Kubernetes cluster. This is typically accomplished by applying a single manifest provided by the project maintainers.

    With CloudNativePG, this one-time setup deploys the controller manager, which acts as the reconciliation loop. It continuously watches for Cluster resources and takes action to create, update, or delete PostgreSQL instances to match your desired state.

    # Example command to install the CloudNativePG operator
    kubectl apply -f \
      https://raw.githubusercontent.com/cloudnative-pg/cloudnative-pg/release-1.23/releases/cnpg-1.23.0.yaml
    

    Once executed, the operator pod will start in its dedicated namespace (typically cnpg-system), ready to manage PostgreSQL clusters cluster-wide. Proper cluster management is foundational; for a deeper dive, review our guide on Kubernetes cluster management tools.

    Crafting a Production-Ready Cluster Manifest

    With the operator running, you define your PostgreSQL cluster by creating a YAML manifest for the Cluster custom resource. This manifest is where you specify every critical parameter for a highly available, resilient production deployment.

    Let's dissect a detailed manifest, focusing on production-grade fields.

    apiVersion: postgresql.cnpg.io/v1
    kind: Cluster
    metadata:
      name: postgres-production-db
    spec:
      instances: 3
      imageName: ghcr.io/cloudnative-pg/postgresql:16.2
    
      primaryUpdateStrategy: unsupervised
    
      storage:
        size: 20Gi
        storageClass: "premium-iops"
    
      postgresql:
        parameters:
          shared_buffers: "512MB"
          max_connections: "200"
    
      affinity:
        podAntiAffinity:
          requiredDuringSchedulingIgnoredDuringExecution:
          - labelSelector:
              matchExpressions:
              - key: cnpg.io/cluster
                operator: In
                values:
                - postgres-production-db
            topologyKey: "kubernetes.io/hostname"
    
      replication:
        synchronous:
          quorum: 2
    

    This manifest is a declarative specification for a resilient database system. Let's break down the key sections.

    Defining Core Cluster Attributes

    The initial fields establish the cluster's fundamental characteristics.

    • instances: 3: This is the core of your high-availability strategy. It instructs the operator to provision a three-node cluster: one primary and two hot standbys, a standard robust configuration.
    • imageName: ghcr.io/cloudnative-pg/postgresql:16.2: This explicitly pins the PostgreSQL container image version, preventing unintended automatic upgrades and ensuring a predictable, stable database environment.
    • storage: We request 20Gi of persistent storage via the storageClass: "premium-iops". This directive is crucial; it ensures the database volumes are provisioned on high-performance block storage, not a slow, default StorageClass that would create an I/O bottleneck for a production workload.

    Ensuring High Availability and Data Integrity

    The subsequent configuration blocks build in fault tolerance and data consistency.

    The affinity section is non-negotiable for a genuine HA setup. The podAntiAffinity rule instructs the Kubernetes scheduler to never co-locate two pods from this PostgreSQL cluster on the same physical node. If a node fails, this guarantees that replicas are running on other healthy nodes, ready for failover.

    This podAntiAffinity configuration is one of the most critical elements for eliminating single points of failure at the infrastructure level. It transforms a distributed set of pods into a truly fault-tolerant system.

    Furthermore, the replication block defines the data consistency model. By setting a synchronous quorum of 2, you enforce that any transaction must be successfully written to the primary and at least one replica before returning success to the application. This configuration guarantees zero data loss (RPO=0) during a failover, as the promoted replica is confirmed to have the latest committed data. The challenge of optimizing deployment strategies often mirrors broader discussions in workflow automation, such as those found in articles on AI workflow automation tools.

    Upon applying this manifest (kubectl apply -f your-cluster.yaml), the operator executes a complex workflow: it creates the PersistentVolumeClaims, provisions the underlying StatefulSet, initializes the primary database, configures streaming replication to the standbys, and creates the Kubernetes Services for application connectivity. This single command automates dozens of manual, error-prone steps, yielding a production-grade PostgreSQL cluster in minutes.

    Mastering Storage and High Availability

    The resilience of a stateful application like PostgreSQL is directly coupled to its storage subsystem. When running PostgreSQL on Kubernetes, data durability is contingent upon a correct implementation of Kubernetes' persistent storage and high availability mechanisms. This is non-negotiable for any production system.

    You must understand three core Kubernetes concepts: PersistentVolumeClaims (PVCs), PersistentVolumes (PVs), and StorageClasses. A PVC is a PostgreSQL pod's request for storage, analogous to its requests for CPU or memory. A PV is the actual provisioned storage resource that fulfills that request, and a StorageClass defines different tiers of storage available (e.g., high-IOPS SSDs vs. standard block storage).

    This declarative model abstracts storage management. Instead of manually provisioning and attaching disks to nodes, you declare your storage requirements in a manifest, and Kubernetes handles the underlying provisioning.

    Choosing the Right Storage Backend

    The choice of storage backend directly impacts database performance and durability. You must select a StorageClass that maps to a storage solution designed for the high I/O demands of a production database.

    Common storage patterns include:

    • Cloud Provider Block Storage: This is the most straightforward approach in cloud environments like AWS, GCP, or Azure. The StorageClass provisions services like EBS, Persistent Disk, or Azure Disk, offering high reliability and performance.
    • Network Attached Storage (NAS): Solutions like NFS can be viable but often become a write performance bottleneck for database workloads. Use with caution.
    • Distributed Storage Systems: For maximum performance and flexibility, particularly in on-premise or multi-cloud deployments, systems like Ceph or Portworx are excellent choices. They offer advanced capabilities like storage-level synchronous replication, which can significantly reduce failover times.

    A critical error is using the default StorageClass without verifying its underlying provisioner. For a production PostgreSQL workload, you must explicitly select a class that guarantees the IOPS and durability required by your application's service-level objectives (SLOs).

    Architecting for High Availability and Failover

    With a robust storage foundation, the next challenge is ensuring the database can survive node failures and network partitions. A mature Kubernetes operator automates the complex choreography of high availability (HA).

    The operator continuously monitors the health of the primary PostgreSQL instance. If it detects a failure (e.g., the primary pod becomes unresponsive), it initiates an automated failover. It manages the entire leader election process, promoting a healthy, up-to-date replica to become the new primary.

    Crucially, the operator also updates the Kubernetes Service object that acts as the stable connection endpoint for your applications. When the failover occurs, the operator instantly updates the Service's selectors to route traffic to the newly promoted primary pod. From the application's perspective, the endpoint remains constant, minimizing or eliminating downtime.

    Synchronous vs Asynchronous Replication Trade-Offs

    A key architectural decision is the choice between synchronous and asynchronous replication, typically configured via a single field in the operator's CRD.

    • Asynchronous Replication: The primary commits a transaction locally and then sends the WAL records to replicas without waiting for acknowledgement. This offers the lowest write latency but introduces a risk of data loss (RPO > 0) if the primary fails before the transaction is replicated.
    • Synchronous Replication: The primary waits for at least one replica to confirm it has received and durably written the transaction to its own WAL before acknowledging the commit to the client. This guarantees zero data loss (RPO=0) at the cost of slightly increased write latency.

    For most business-critical systems, synchronous replication is the recommended approach. The minor performance overhead is a negligible price for the guarantee of data integrity during a failover.

    Finally, never trust an untested failover mechanism. Conduct chaos engineering experiments: delete the primary pod, cordon its node, or inject network latency to simulate a real-world outage. You must empirically validate that the operator performs the failover correctly and that your application reconnects seamlessly. This is the only way to ensure your HA architecture will function as designed when it matters most.

    Implementing Backups and Performance Tuning

    A conceptual image showing a database icon with a circular arrow for backups and a speedometer for performance tuning.

    A PostgreSQL cluster on Kubernetes is not production-ready without a robust, tested backup and recovery strategy that stores data in a durable, off-site location. Similarly, an untuned database is a latent performance bottleneck.

    Modern PostgreSQL operators have made disaster recovery (DR) a declarative process. They orchestrate scheduling, log shipping, and restoration, allowing you to manage your entire backup strategy from a YAML manifest.

    Automating Backups and Point-in-Time Recovery

    The gold standard for database recovery is Point-in-Time Recovery (PITR). Instead of being limited to restoring a nightly snapshot, PITR allows you to restore the database to a specific microsecond—for instance, just before a data corruption event. This is achieved by combining periodic full backups with a continuous archive of Write-Ahead Logs (WAL).

    An operator like CloudNativePG can manage this entire workflow. You specify a destination for the backups—typically an object storage service like Amazon S3, GCS, or Azure Blob Storage—and the operator handles the rest. It schedules base backups and continuously archives every WAL segment to the object store as it is generated.

    Here is a sample configuration within a Cluster manifest:

    # In your Cluster CRD spec section
      backup:
        barmanObjectStore:
          destinationPath: "s3://your-backup-bucket/production-db/"
          endpointURL: "https://s3.us-east-1.amazonaws.com"
          # Credentials should be managed via a Kubernetes secret
          s3Credentials:
            accessKeyId:
              name: aws-creds
              key: ACCESS_KEY_ID
            secretAccessKey:
              name: aws-creds
              key: SECRET_ACCESS_KEY
        retentionPolicy: "30d"
        schedule: "0 0 4 * * *" # Daily at 4:00 AM UTC
    

    This configuration instructs the operator to:

    • Execute a full base backup daily at 4:00 AM UTC.
    • Continuously stream WAL files to the specified S3 bucket.
    • Enforce a retention policy, pruning backups and associated WAL files older than 30 days.

    Restoration is equally declarative. You create a new Cluster resource, reference the backup repository, and specify the target recovery timestamp. The operator then automates the entire recovery process: fetching the appropriate base backup and replaying WAL files to bring the new cluster to the desired state.

    Fine-Tuning Performance for Kubernetes

    Tuning PostgreSQL on Kubernetes requires a declarative mindset. Direct modification of postgresql.conf via exec is an anti-pattern. Instead, all configuration changes should be managed through the operator's CRD. This ensures settings are version-controlled and consistently applied across all cluster instances, eliminating configuration drift.

    Key parameters like shared_buffers (memory for data caching) and work_mem (memory for sorting and hashing operations) can be set directly in the Cluster manifest's postgresql.parameters section.

    However, the single most impactful performance optimization is connection pooling. PostgreSQL's process-per-connection model is resource-intensive. In a microservices architecture with potentially hundreds of ephemeral connections, this can lead to resource exhaustion and performance degradation.

    Tools like PgBouncer are essential. A connection pooler acts as a lightweight intermediary between applications and the database. Applications connect to PgBouncer, which maintains a smaller, managed pool of persistent connections to PostgreSQL. This dramatically reduces connection management overhead, allowing the database to support a much higher number of clients efficiently. Most operators include built-in support for deploying a PgBouncer pool alongside your cluster.

    The drive to optimize PostgreSQL is fueled by its expanding role in modern applications. Its dominance is supported by features critical for today's workloads, from vector data for AI/ML and JSONB for semi-structured data to time-series (via Timescale) and geospatial data (via PostGIS). These capabilities make it a cornerstone for analytics and AI, with some organizations reporting a 50% reduction in database TCO after migrating from NoSQL to open-source PostgreSQL. You can read more about PostgreSQL's growing market share at percona.com.

    By combining a robust PITR strategy with systematic performance tuning and connection pooling, you can build a PostgreSQL foundation on Kubernetes that is both resilient and highly scalable.

    Knowing When to Seek Expert Support

    Running PostgreSQL on Kubernetes effectively requires deep expertise across two complex domains. While many teams can achieve an initial deployment, the real challenges emerge during day-two operations.

    Engaging external specialists is not a sign of failure but a strategic decision to protect your team's most valuable resource: their time and focus on core product development.

    Key indicators that you may need expert support include engineers being consistently diverted from feature development to troubleshoot database performance issues, or an inability to implement a truly resilient and testable high-availability and disaster recovery strategy. These are symptoms of accumulating operational risk.

    The operational burden of managing a production database on Kubernetes can become a silent tax on innovation. When your platform team spends more time tuning work_mem than shipping features that help developers, you're bleeding momentum.

    Bringing in specialists provides a force multiplier. They offer deep, battle-tested expertise to solve specific, high-stakes problems efficiently, ensuring your infrastructure is stable, secure, and scalable without derailing your product roadmap. For a clearer understanding of this model, see our overview of Kubernetes consulting services.

    Frequently Asked Questions

    When architecting for PostgreSQL on Kubernetes, several critical questions consistently arise. Addressing these is key to a successful implementation.

    Let's tackle the most common technical inquiries from engineers integrating these two powerful technologies.

    Is It Really Safe to Run a Stateful Database Like PostgreSQL on Kubernetes?

    Yes, provided a robust architecture is implemented. Early concerns about running stateful services on Kubernetes are largely outdated. Modern Kubernetes primitives like StatefulSets and PersistentVolumes, when combined with a mature PostgreSQL Operator, provide the necessary stability and data persistence for production databases.

    The key is automation. A production-grade operator is engineered to handle failure scenarios gracefully. Its ability to automate failover and prevent data loss makes the resulting system as safe as—or arguably safer than—many traditionally managed database environments that rely on manual intervention.

    Can I Expect the Same Performance as a Bare-Metal Setup?

    You can achieve near-native performance, and for most applications, the operational benefits far outweigh any minor overhead. While there is a slight performance cost from containerization and network virtualization layers, modern container runtimes and high-performance CNI plugins like Calico make this impact negligible for most workloads.

    In practice, performance bottlenecks are rarely attributable to Kubernetes itself. The more common culprits are a misconfigured StorageClass using slow disk tiers or, most frequently, the absence of a connection pooler. By provisioning high-IOPS block storage and implementing a tool like PgBouncer, your database can handle intensive production loads effectively.

    The most significant performance gain is not in raw IOPS but in operational velocity. The ability to declaratively provision, scale, and manage database environments provides a strategic advantage that dwarfs the minor performance overhead for the vast majority of applications.

    What's the Single Biggest Mistake Teams Make?

    The most common and costly mistake is underestimating day-two operations. Deploying a basic PostgreSQL instance is straightforward. The true complexity lies in managing backups, implementing disaster recovery, executing zero-downtime upgrades, and performance tuning under load.

    Many teams adopt a DIY approach with manual StatefulSets, only to discover they have inadvertently committed to building and maintaining a complex distributed system from scratch. A battle-tested Kubernetes Operator abstracts away 90% of this operational complexity, allowing your team to focus on application logic instead of reinventing the database-as-a-service wheel.


    Let's be real: managing PostgreSQL on Kubernetes requires deep expertise in both systems. If your team is stuck chasing performance ghosts or can't nail down a reliable HA strategy, it might be time to bring in an expert. OpsMoon connects you with the top 0.7% of DevOps engineers who can stabilize and scale your database infrastructure, turning it into a rock-solid foundation for your business. Start with a free work planning session to map out your path to a production-grade setup.

  • A Technical Guide to Improving Developer Productivity

    A Technical Guide to Improving Developer Productivity

    Improving developer productivity is about systematically eliminating friction from the software development lifecycle (SDLC). It’s about instrumenting, measuring, and optimizing the entire toolchain to let engineers focus on solving complex business problems instead of fighting infrastructure. Every obstacle you remove, whether it’s a slow CI/CD pipeline or an ambiguous JIRA ticket, yields measurable dividends in feature velocity and software quality.

    Understanding the Real Cost of Developer Friction

    Developer friction isn't a minor annoyance; it's a systemic tax that drains engineering capacity. Every minute an engineer spends waiting for a build, searching for API documentation, or wrestling with a flaky test environment is a quantifiable loss of value-creation time.

    These delays compound, directly impacting business outcomes. Consider a team of ten engineers where each loses just one hour per day to inefficiencies like slow local builds or waiting for a CI runner. That's 50 hours per week—the equivalent of an entire full-time engineer's capacity, vaporized. This lost time directly degrades feature velocity, delays product launches, and creates an opening for competitors.

    The Quantifiable Impact on Business Goals

    The consequences extend beyond lost hours. When developers are constantly bogged down by process overhead, their capacity for deep, creative work diminishes. Context switching—the cognitive load of shifting between disparate tasks and toolchains—degrades performance and increases the probability of introducing defects.

    This creates a ripple effect across the business:

    • Delayed Time-to-Market: Slow CI/CD feedback loops mean features take longer to validate and deploy. A 30-minute build delay, run 10 times a day by a team of 10, amounts to 50 hours of dead wait time in a single day. This delays revenue and, critically, customer feedback.
    • Reduced Innovation: Engineers exhaust their cognitive budget navigating infrastructure complexity. This leaves minimal capacity for the algorithmic problem-solving and architectural design that drives product differentiation.
    • Increased Talent Attrition: A frustrating developer experience (DevEx) is a primary driver of engineer burnout. The cost to replace a senior engineer can exceed 150% of their annual salary, factoring in recruitment, onboarding, and the loss of institutional knowledge.

    The ultimate price of developer friction is opportunity cost. It's the features you never shipped, the market share you couldn't capture, and the brilliant engineer who left because they were tired of fighting the system.

    Data-Backed Arguments for Change

    To secure executive buy-in for platform engineering initiatives, you must present a data-driven case. Industry data confirms this is a critical business problem.

    The 2024 State of Developer Productivity report found that 90% of companies view improving productivity as a top initiative. Furthermore, 58% reported that developers lose more than 5 hours per week to unproductive work, with the most common estimate falling between 5 and 15 hours.

    Much of this waste originates from poorly defined requirements and ambiguous planning. To streamline your agile process and reduce estimation-related friction, a comprehensive guide to Planning Poker and user story estimation is an excellent technical starting point. Addressing these upstream issues prevents significant churn and rework during development sprints.

    Ultimately, investing in developer productivity is a strategic play for speed, quality, and talent retention. To learn how to translate these efforts into business-centric metrics, see our guide on engineering productivity measurement. The first step is recognizing that every moment of friction has a quantifiable cost.

    Conducting a Developer Experience Audit to Find Bottlenecks

    You cannot fix what you do not measure. Before investing in new tooling or re-architecting processes, you must develop a quantitative understanding of where your team is actually losing productivity. A Developer Experience (DevEx) audit provides this data-driven foundation.

    This isn't about collecting anecdotes like "the builds are slow." It's about instrumenting the entire SDLC to pinpoint specific, measurable bottlenecks so you can apply targeted solutions.

    The objective is to map the full lifecycle of a code change, from a local Git commit to a production deployment. This requires analyzing both the "inner loop"—the high-frequency cycle of coding, building, and testing locally—and the "outer loop," which encompasses code reviews, CI/CD pipelines, and release orchestration.

    Combining Qualitative and Quantitative Data

    A robust audit must integrate two data types: the "what" (quantitative metrics) and the "why" (qualitative feedback). You get the "what" from system telemetry, but you only uncover the "why" by interviewing your engineers.

    For the quantitative analysis, instrument your systems to gather objective metrics that expose wait times and inefficiencies. Key metrics include:

    • CI Build and Test Durations: Track the P50, P90, and P95 execution times for your CI jobs.
    • Deployment Frequency: How many successful deployments per day/week are you achieving?
    • Change Failure Rate: What percentage of deployments result in a production incident (e.g., require a rollback or hotfix)?
    • Mean Time to Restore (MTTR): When a production failure occurs, what is the average time to restore service?

    This data provides a baseline, but the critical insights emerge when you correlate it with qualitative feedback from structured workflow interviews and developer surveys. Ask engineers to walk you through their typical workflow, screen-sharing included. Where do they encounter friction? What tasks are pure toil?

    The most powerful insights emerge when you connect a developer's story of frustration to a specific metric. When an engineer says, "I waste my mornings waiting for CI," and you can point to a P90 build time of 45 minutes on your CI dashboard, you have an undeniable, data-backed problem to solve.

    Creating a Value Stream Map and Friction Log

    To make this data actionable, you must visualize it. A value stream map is a powerful tool for this. It charts every step in your development process, from ticket creation to production deployment, highlighting two key figures for each stage: value-add time (e.g., writing code) and wait time (e.g., waiting for a PR review). Often, the cumulative wait time between steps far exceeds the active work time.

    This visual map immediately exposes where the largest delays are hiding. Perhaps it’s the two days a pull request waits for a review or the six hours it sits in a deployment queue. These are your primary optimization targets.

    Concurrently, establish a friction log. This is a simple, shared system (like a JIRA project or a dedicated Slack channel) where developers can log any obstacle—no matter how small—that disrupts their flow state. This transforms anecdotal complaints into a structured, prioritized backlog of issues for the platform team to address.

    The cost of this friction accumulates rapidly, representing time that could have been allocated to innovation. This chart illustrates how seemingly minor friction points aggregate into a significant loss of productive time and a direct negative impact on business value.

    As the visualization makes clear, every moment of developer friction directly translates into lost hours. Those lost hours erode business value through delayed releases and a slower pace of innovation.

    Industry data corroborates this. A 2023 survey revealed that developers spend only 43% of their time writing code. Other studies identify common time sinks: 42% of developers frequently wait on machine resources, 37% wait while searching for documentation, and 41% are blocked by flaky tests. You can discover more insights about these software developer statistics on Allstacks.com to see just how widespread these issues are.

    This audit is just the first step. To see how these findings fit into a bigger picture, check out our guide on conducting a DevOps maturity assessment. It will help you benchmark where you are today and map out your next moves.

    Automating the Software Delivery Lifecycle

    Once you've mapped your bottlenecks, automation is your most effective lever for improving developer productivity. This isn't about replacing engineers; it's about eliminating repetitive, low-value toil and creating tight feedback loops so they can focus on what they were hired for—building high-quality software.

    A developer using a laptop with code and workflow diagrams floating around them.

    The first area to target is the Continuous Integration/Continuous Deployment (CI/CD) pipeline. When developers are stalled waiting for builds and tests, their cognitive flow is shattered. This wait time is pure waste and offers the most significant opportunities for quick wins.

    Supercharging Your CI/CD Pipeline

    A slow CI pipeline imposes a tax on every commit. To eliminate this tax, you must move beyond default configurations and apply advanced optimization techniques. Start by profiling your build and test stages to identify the slowest steps.

    Here are specific technical strategies that consistently slash wait times:

    • Build Parallelization: Decompose monolithic test suites. Configure your CI tool (Jenkins, GitLab CI, or GitHub Actions) to split your test suite across multiple parallel jobs. For a large test suite, this can reduce execution time by 50-75% or more.
    • Dependency Caching: Most builds repeatedly download the same dependencies. Implement caching for package manager artifacts (e.g., .m2, node_modules). This can easily shave minutes off every build.
    • Docker Layer Caching: If you build Docker images in CI, enable layer caching. This ensures that only the layers affected by code changes are rebuilt, dramatically speeding up the docker build process.
    • Dynamic, Auto-scaling Build Agents: Eliminate build queues by using containerized, ephemeral build agents that scale on demand. Configure your CI system to use technologies like Kubernetes to spin up agents for each job and terminate them upon completion.

    Ending Resource Contention with IaC

    A classic productivity killer is the contention for shared development and testing environments. When developers are queued waiting for a staging server, work grinds to a halt. Infrastructure as Code (IaC) is the definitive solution.

    Using tools like Terraform or Pulumi, you define your entire application environment—VPCs, subnets, compute instances, databases, load balancers—in version-controlled code. This enables developers to provision complete, isolated, production-parity environments on demand with a single command.

    Imagine this workflow: a developer opens a pull request. The CI pipeline automatically triggers a Terraform script to provision a complete, ephemeral environment for that specific PR. Reviewers can now interact with the live feature, providing higher-fidelity feedback and identifying bugs earlier. Upon merging the PR, a subsequent CI job executes terraform destroy, tearing down the environment and eliminating cost waste.

    This "ephemeral environments" model completely eradicates resource contention, enabling faster iteration and higher-quality code. For a deeper dive into tools that can help here, check out this complete guide to workflow automation software.

    Shifting Quality Left with Automated Gates

    Automation is critical for "shifting quality left"—detecting bugs and security vulnerabilities as early as possible in the SDLC. Fixing a defect found in a pull request is orders of magnitude cheaper and less disruptive than fixing one found in production. Automated quality gates in your CI pipeline are the essential safety net.

    These gates must provide fast, actionable feedback directly within the developer's workflow, ideally as pre-commit hooks or PR status checks.

    • Static Analysis (Linting & SAST): Integrate tools like SonarQube or ESLint to automatically scan code for bugs, anti-patterns, and security flaws (SAST). This enforces coding standards programmatically.
    • Dependency Scanning (SCA): Integrate a Software Composition Analysis (SCA) tool like Snyk or Dependabot to automatically scan project dependencies for known CVEs.
    • Contract Testing: In a microservices architecture, use a tool like Pact to verify that service-to-service interactions adhere to a shared contract, eliminating the need for slow, brittle end-to-end integration tests in CI.

    Each automated check offloads significant cognitive load from developers and reviewers, allowing them to focus on the business logic of a change, not on finding routine errors. Implementing these high-impact automations directly addresses common friction points. The benefits of workflow automation are clear: you ship faster, with higher quality, and maintain a more productive and satisfied engineering team.

    Building an Internal Developer Platform for Self-Service

    Internal Developer Platform

    The objective of an Internal Developer Platform (IDP) is to abstract away the complexity of underlying infrastructure, enabling developers to self-service their operational needs. It provides a "golden path"—a set of blessed, secure, and efficient tools and templates for building, deploying, and running services.

    This drastically reduces cognitive load. Developers spend less time wrestling with YAML files and cloud provider consoles, and more time shipping features. A well-architected IDP is built on several core technical pillars:

    • A Software Catalog: A centralized registry for all services, libraries, and resources, often powered by catalog-info.yaml files.
    • Software Templates: For scaffolding new applications from pre-configured, security-approved templates (e.g., "production-ready Go microservice").
    • Self-Service Infrastructure Provisioning: APIs or UI-driven workflows that allow developers to provision resources like databases, message queues, and object storage without filing a ticket.
    • Standardized CI/CD as a Service: Centralized, reusable pipeline definitions that developers can import and use with minimal configuration.
    • Centralized Observability: A unified portal for accessing logs, metrics, and traces for any service.
    • Integrated RBAC: Role-based access control tied into the company's identity provider (IdP) to ensure secure, least-privilege access to all resources.

    From Friction to Flow: A Pragmatic Approach

    Do not attempt to build a comprehensive IDP in a single "big bang" release. Successful platforms start by targeting the most significant bottlenecks identified in your DevEx audit.

    Build a small, targeted prototype and onboard a pilot team. Their feedback is crucial for iterative development. This ensures the IDP evolves based on real-world needs, not abstract assumptions. A simple CLI or UI can be the first step, abstracting complex tools like Terraform behind a user-friendly interface.

    # Provision a new service environment with a simple command
    opsmoon idp create-service \
      --name billing-service \
      --template nodejs-microservice-template \
      --env dev
    

    Remember, your IDP is a product for your internal developers. Treat it as such.

    Platforms are products, not projects. Our experience at OpsMoon shows that treating your IDP as an internal product—with a roadmap, user feedback loops, and clear goals—is the single biggest predictor of its success and adoption.

    A well-designed IDP can reduce environment setup time by 30-40%, a significant productivity gain.

    Developer Platform Tooling Approaches

    The build-vs-buy decision for your IDP involves critical tradeoffs. There is no single correct answer; the optimal choice depends on your organization's scale, maturity, and engineering capacity.

    This table breaks down the common strategies:

    Approach Core Tools Pros Cons Best For
    DIY Scripts Bash, Python, Terraform Low initial cost; highly customizable. Brittle; high maintenance overhead; difficult to scale. Small teams or initial proofs-of-concept.
    Open Source Backstage, Jenkins, Argo CD Strong community support; no vendor lock-in; flexible. Significant integration and maintenance overhead. Mid-size to large teams with dedicated platform engineering capacity.
    Commercial Cloud-native developer platforms Enterprise support; polished UX; fast time-to-value. Licensing costs; potential for vendor lock-in. Large organizations requiring turnkey, supported solutions.
    Hybrid Model Open source core + custom plugins Balances control and out-of-the-box functionality. Can increase integration complexity and maintenance costs. Growing teams needing flexibility combined with specific custom features.

    Ultimately, the best approach is the one that delivers value to your developers fastest while aligning with your long-term operational strategy.

    Common Mistakes to Avoid When Building an IDP

    Building an IDP involves navigating several common pitfalls:

    • Ignoring User Feedback: Building a platform in an architectural vacuum results in a tool that doesn't solve real developer problems.
    • Big-Bang Releases: Attempting to build a complete platform before releasing anything often leads to an over-engineered solution that misses the mark.
    • Neglecting Documentation: An undocumented platform is an unusable platform. Developers will revert to filing support tickets.
    • Overlooking Security: Self-service capabilities without robust security guardrails (e.g., OPA policies, IAM roles) is a recipe for disaster.

    Case Study: Fintech Startup Slashes Provisioning Time

    We partnered with a high-growth fintech company where manual provisioning resulted in a 2-day lead time for a new development environment. After implementing a targeted IDP focused on self-service infrastructure, they reduced this time to under 30 minutes.

    The results were immediate and impactful:

    • Environment spin-up time decreased by over 75%.
    • New developer onboarding time was reduced from two weeks to three days.
    • Deployment frequency doubled within the first quarter post-implementation.

    Measuring What Matters: Key Metrics for IDP Success

    To justify its existence, an IDP's success must be measured in terms of its impact on key engineering and business metrics.

    Define your KPIs from day one. Critical metrics include:

    • Lead Time for Changes: The time from a code commit to it running in production. (DORA metric)
    • Deployment Frequency: How often your teams successfully deploy to production. (DORA metric)
    • Change Failure Rate: The percentage of deployments that cause a production failure. (DORA metric)
    • Time to Restore Service (MTTR): How quickly you can recover from an incident. (DORA metric)
    • Developer Satisfaction (DSAT): Regular surveys to capture qualitative feedback and identify friction points.

    Set quantitative goals, such as reducing developer onboarding time to under 24 hours or achieving an IDP adoption rate above 80%. A 60% reduction in infrastructure-related support tickets is another strong indicator of success.

    What's Next for Your Platform?

    Once your MVP is stable and adopted, you can layer in more advanced capabilities. Consider integrating feature flag management with tools like LaunchDarkly, adding FinOps dashboards for dynamic cost visibility, or providing SDKs to standardize service-to-service communication, logging, and tracing.

    Building an IDP is an ongoing journey of continuous improvement, driven by the evolving needs of your developers and your business.

    OpsMoon can help you navigate this journey. Our expert architects and fractional SRE support can accelerate your platform delivery, pairing you with top 0.7% global talent. We even offer free architect hours to help you build a solid roadmap from the very beginning.

    Next, we’ll dive into how you can supercharge your software delivery lifecycle by integrating AI tools directly into your developer platform.

    Weaving AI into Your Development Workflow

    AI tools are proliferating, but their practical impact on developer productivity requires a nuanced approach. The real value is not in auto-generating entire applications, but in surgically embedding AI into the most time-consuming, repetitive parts of the development workflow.

    A common mistake is providing a generic AI coding assistant subscription and expecting productivity to magically increase. This often leads to more noise and cognitive overhead. The goal is to identify specific tasks where AI can serve as a true force multiplier.

    Where AI Actually Moves the Needle

    The most effective use of AI is to augment developer skills, not replace them. AI should handle the boilerplate and repetitive tasks, freeing engineers to focus on high-complexity problems that drive business value.

    High-impact, technically-grounded applications include:

    • Smarter Code Completion: Modern AI assistants can generate entire functions, classes, and complex boilerplate from a natural language comment or code context. This is highly effective for well-defined, repetitive logic like writing API clients or data transformation functions.
    • Automated Test Generation: AI can analyze a function's logic and generate a comprehensive suite of unit tests, including positive, negative, and edge-case scenarios. This significantly reduces the toil associated with achieving high code coverage.
    • Intelligent Refactoring: AI tools can analyze complex or legacy code and suggest specific refactorings to improve performance, simplify logic, or modernize syntax. This lowers the activation energy required to address technical debt.
    • Self-Updating Documentation: AI can parse source code and automatically generate or update documentation, such as README files or API specifications, ensuring that documentation stays in sync with the code.

    The Hidden Productivity Traps of AI

    Despite their potential, AI tools introduce new risks. The most significant is the hidden tax of cognitive overhead. If a developer spends more time verifying, debugging, and securing AI-generated code than it would have taken to write it manually, the tool has created a productivity deficit. This is especially true when working on novel problems where the AI's training data is sparse.

    The initial velocity gains from an AI tool can create a dangerous illusion of productivity. Teams feel faster, but the cumulative time spent validating and correcting AI suggestions can silently erode those gains, particularly in the early stages of adoption.

    This is not merely anecdotal. A randomized controlled trial in early 2025 with experienced developers found that using AI tools led to a 19% increase in task completion time compared to a control group without AI. This serves as a stark reminder that perceived velocity is not the same as actual effectiveness. You can dig into the full research on these AI adoption findings on metr.org to see the detailed analysis.

    A No-Nonsense Guide to AI Adoption

    To realize the benefits of AI while mitigating the risks, a structured adoption strategy is essential. This should be a phased rollout focused on learning and measurement.

    1. Run a Small Pilot: Select a small team of motivated developers to experiment with a single AI tool. Define clear success criteria upfront. For example, aim to reduce the time spent writing unit tests by 25%.
    2. Target a Specific Workflow: Do not simply "turn on" the tool. Instruct the pilot team to focus its use on a specific, well-defined workflow, such as generating boilerplate for new gRPC service endpoints. This constrains the experiment and yields clearer results.
    3. Collect Quantitative and Qualitative Feedback: Track metrics like pull request cycle time and code coverage. Critically, conduct interviews with the team. Where did the tool provide significant leverage? Where did it introduce friction or generate incorrect code?
    4. Develop an Internal Playbook: Based on your learnings, create internal best practices. This should include guidelines for writing effective prompts, a checklist for verifying AI-generated code, and strict policies regarding the use of AI with proprietary or sensitive data.

    Answering the Tough Questions About Developer Productivity

    Engineering leaders must be prepared to quantify the return on investment (ROI) for any platform engineering or DevEx initiative. This requires connecting productivity improvements directly to business outcomes. It is not sufficient to say things are "faster."

    For example, reducing CI build times by 60% is a technical win, but its business value is the reclaimed engineering time. For many developers, this can translate to 5 hours of productive time recovered each week.

    Across a team of 20 engineers, this unlocks 1,000 hours of engineering capacity per month that was previously lost to waiting. That is a metric that resonates with business leadership.

    Here's how you build that business case:

    • Define Your Metrics: Select a few key performance indicators (KPIs) that matter. Lead Time for Changes and Change Failure Rate are industry standards (DORA metrics) because they directly measure velocity and quality.
    • Establish a Baseline: Before implementing any changes, instrument your systems and collect data on your current performance. This is your "before" state.
    • Measure the Impact: After your platform improvements are deployed, track the same metrics and compare them to your baseline. This provides quantitative proof of the gains.

    How Do I Measure the ROI of Platform Investments?

    Measuring ROI becomes concrete when you map saved engineering hours to cost reductions and increased feature throughput.

    This is where you assign a dollar value to developer time and connect it to revenue-generating activities.

    Key Insight: I've seen platform teams secure funding for their next major initiative by demonstrating a 15% reduction in lead time. It proves the value of the platform and builds trust with business stakeholders.

    Here’s what that looks like in practice:

    Metric Before After Impact
    Lead Time (hrs) 10 6 -40%
    Deployment Frequency 4/week 8/week +100%
    CI Queues (mins) 30 10 -67%

    How Do We Get Developers to Actually Use This?

    Adoption of new platforms and tools is primarily a cultural challenge, not a technical one. An elegant platform that developers ignore is a failed investment.

    Successful adoption hinges on demonstrating clear value and involving developers in the process from the outset.

    • Start with a Pilot Group: Identify a team of early adopters to trial new workflows. Their feedback is invaluable, and their success becomes a powerful internal case study.
    • Publish a Roadmap: Be transparent about your platform's direction. Communicate what's coming, when, and—most importantly—the "why" behind each initiative. Solicit feedback at every stage.
    • Build a Champion Network: Identify respected senior engineers in different teams and empower them as advocates. Peer-to-peer recommendations are far more effective than top-down mandates.

    And don't forget to highlight the quick wins. Reducing CI job times by a few minutes may seem small, but these incremental improvements build momentum and trust.

    I've seen early quick wins transform the biggest skeptics into supporters in just a few days.

    What if We Have Limited Resources?

    Most teams cannot fund a large, comprehensive platform project from day one. This is normal and expected. The key is to be strategic and data-driven. Revisit your DevEx audit and target the one or two bottlenecks causing the most pain.

    1. Fix the Inner Loop: Start by optimizing local build and test cycles. This is often where developers experience the most friction and can account for up to 70% of their unproductive time.
    2. Automate Environments: You don't need a full-blown IDP to eliminate manual environment provisioning. Simple, reusable IaC modules can eradicate long waits and human error.
    3. Leverage Open Source: You can achieve significant results with mature, community-backed projects like Backstage or Terraform without any licensing costs.

    These steps do not require a large budget but can easily deliver 2x faster feedback loops. Such early proof points are critical for securing resources for future investment.

    Approach Cost Setup Time Impact
    Manual Scripts Low 1 week +10% speed
    Efficient IaC Low-Med 2 days +30% speed
    Paid Platform High 2 weeks +60% speed

    Demonstrating this type of progressive value is how you gain executive support for more ambitious initiatives.

    Starting small and proving value is the most reliable way I know to grow a developer productivity program.

    What Are the Common Pitfalls to Avoid?

    The most common mistake is chasing new tools ("shiny object syndrome") instead of solving fundamental, measured bottlenecks.

    The solution is to remain disciplined and data-driven. Always prioritize based on the data from your DevEx audit—what is costing the most time and occurring most frequently?

    • Overengineering: Do not build a complex platform when a simple script or automation will suffice. Focus on solving real problems, not building features nobody has asked for.
    • Ignoring Feedback: A tool is only useful if it solves the problems your developers actually have. Conduct regular surveys and interviews to ensure you remain aligned with their needs.
    • Forgetting to Measure: You must track your KPIs after every rollout. This is the only way to prove value and detect regressions before they become significant problems.

    If you are stuck, engaging external experts can fill knowledge gaps and accelerate progress. A good consultant will embed with your team, provide pragmatic technical advice, and help establish sustainable workflows.

    How Do We Measure Success in the Long Run?

    Improving productivity is not a one-time project; it is a continuous process. To achieve sustained gains, you must establish continuous measurement and feedback loops.

    Combine quantitative data with qualitative feedback to get a complete picture and identify emerging trends.

    • Quarterly Reviews: Formally review your DORA metrics alongside developer satisfaction survey results. Are the metrics improving? Are developers happier and less frustrated?
    • Adapt Your Roadmap: The bottleneck you solve today will reveal the next one. Use your data to continuously refine your priorities.
    • Communicate Results: Share your wins—and your learnings—across the entire engineering organization. This builds momentum and reinforces the value of your work.

    Use these questions as a framework for developing your own productivity strategy. Identify which issues resonate most with your team, and let that guide your next actions. The goal is to create a program that continuously evolves to meet your needs.

    Just keep iterating and improving.


    Ready to boost your team's efficiency? Get started with OpsMoon.

  • What Is Service Discovery Explained

    What Is Service Discovery Explained

    In any distributed system, from sprawling microservice architectures to containerized platforms like Kubernetes, services must dynamically locate and communicate with each other. The automated mechanism that enables this is service discovery. It's the process by which services register their network locations and discover the locations of other services without manual intervention or hardcoded configuration files.

    At its core, service discovery relies on a specialized, highly available key-value store known as a service registry. This registry maintains a real-time database of every available service instance, its network endpoint (IP address and port), and its operational health status, making it the single source of truth for service connectivity.

    Why Static Configurations Fail in Modern Architectures

    Consider a traditional monolithic application deployed on a set of virtual machines with static IP addresses. In this environment, configuring service communication was straightforward: you'd simply hardcode the IP address of a database or an upstream API into a properties file. This static approach worked because the infrastructure was largely immutable.

    Modern cloud-native architectures, however, are fundamentally dynamic and ephemeral. Static configuration is not just inefficient; it's a direct path to system failure.

    • Autoscaling: Container orchestrators and cloud platforms automatically scale services horizontally based on load. New instances are provisioned with dynamically assigned IP addresses and must be immediately discoverable.
    • Failures and Redeployment: When an instance fails a health check, it is terminated and replaced by a new one, which will have a different network location. Automated healing requires automated discovery.
    • Containerization: Technologies like Docker and container orchestration platforms like Kubernetes abstract away the underlying host, making service locations even more fluid and unpredictable. An IP address is tied to a container, which is a transient entity.

    Attempting to manage this dynamism with static IP addresses and manual configuration changes would require constant updates and redeployments, introducing significant operational overhead and unacceptable downtime. Service discovery solves this by providing a programmatic and automated way to handle these constant changes.

    The Role of a Central Directory

    To manage this complexity, service discovery introduces a central, reliable component: the service registry. This registry functions as a live, real-time directory for all network endpoints within a system. When a new service instance is instantiated, it programmatically registers itself, publishing its network location (IP address and port), health check endpoint, and other metadata.

    A service registry acts as the single source of truth for all service locations. It ensures that any service needing to communicate with another can always query a reliable, up-to-date directory to find a healthy target.

    When that service instance terminates or becomes unhealthy, it is automatically deregistered. This dynamic registration and deregistration cycle is critical for building resilient, fault-tolerant applications, as it prevents traffic from being routed to non-existent or failing instances. For a deeper dive into the architectural principles at play, our guide on understanding distributed systems provides essential context.

    While our focus is on microservices, this concept is broadly applicable. For example, similar principles are used for discovery within IT Operations Management (ITOM), where the goal is to map infrastructure assets dynamically. Ultimately, without automated discovery, modern distributed systems would be too brittle and operationally complex to function at scale.

    Understanding the Core Service Discovery Patterns

    With a service registry established as the dynamic directory, the next question is how client services interact with it to find the services they need. The implementation of this interaction is defined by two primary architectural patterns: client-side discovery and server-side discovery.

    The fundamental difference lies in where the discovery logic resides. Is the client application responsible for querying the registry and selecting a target instance, or is this logic abstracted away into a dedicated network component like a load balancer or proxy? The choice has significant implications for application code, network topology, and operational complexity.

    This flow chart illustrates the basic concept: a new service instance registers with the registry, making it discoverable by other services that need to consume it.

    Infographic about what is service discovery

    The registry acts as the broker, decoupling service producers from service consumers.

    Client-Side Service Discovery

    In the client-side discovery pattern, the client application contains all the logic required to interact with the service registry. The responsibility for discovering and connecting to a downstream service rests entirely within the client's codebase.

    The process typically involves these steps:

    1. Query the Registry: The client service (e.g., an order-service) directly queries the service registry (like HashiCorp Consul or Eureka) for the network locations of a target service (e.g., payment-service).
    2. Select an Instance: The registry returns a list of healthy instances (IPs and ports). The client then applies a load-balancing algorithm (e.g., round-robin, least connections, latency-weighted) to select a single instance from the list.
    3. Direct Connection: The client makes a direct network request to the selected instance's IP address and port.

    With client-side discovery, the application is "discovery-aware." It embeds a library or client that handles registry interaction, instance selection, and connection management, including retries and failover.

    The Netflix OSS stack is a classic example of this pattern. A service uses a dedicated Eureka client library to communicate with the Eureka registry, and the Ribbon library provides sophisticated client-side load-balancing capabilities.

    The advantage of this pattern is direct control and the elimination of an extra network hop. However, it tightly couples the application to the discovery infrastructure. You must maintain discovery client libraries for every language and framework in your stack, which can increase maintenance overhead.

    Server-Side Service Discovery

    In contrast, server-side discovery abstracts the discovery logic out of the client application and into a dedicated infrastructure component, such as a load balancer, reverse proxy, or API gateway.

    The workflow is as follows:

    1. Request to a Virtual Address: The client sends its request to a stable, well-known endpoint (e.g., a virtual IP or a DNS name like payment-service.internal-proxy). This endpoint is managed by the proxy/load balancer.
    2. Proxy-led Discovery: The proxy intercepts the request. It is the component responsible for querying the service registry to fetch the list of healthy backend instances.
    3. Routing and Forwarding: The proxy applies its own load-balancing logic to select an instance and forwards the client's request to it.

    The client application is completely oblivious to the service registry's existence; its only dependency is the static address of the proxy. This is the predominant model in modern cloud platforms. An AWS Elastic Load Balancer (ELB) routing traffic to an Auto Scaling Group is a prime example of server-side discovery.

    Similarly, in Kubernetes, a Service object provides a stable virtual IP (ClusterIP) and DNS name that acts as a proxy. When a client Pod sends a request to this service name, the request is intercepted by kube-proxy, which transparently routes it to a healthy backend Pod. The discovery and load balancing are handled by the platform, not the application. For more details on this, see our guide on microservices architecture design patterns.

    Comparing the Two Patterns

    The choice between these patterns involves a clear trade-off between application complexity and infrastructure complexity.

    Aspect Client-Side Discovery Server-Side Discovery
    Discovery Logic Embedded within the client application's code. Centralized in a network proxy, load balancer, or gateway.
    Client Complexity High. Requires a specific client library for registry interaction and load balancing. Low. The client only needs to know a static endpoint; it is "discovery-unaware."
    Network Hops Fewer. The client connects directly to the target service instance. More. An additional network hop is introduced through the proxy.
    Technology Coupling High. Tightly couples the application to a specific service discovery implementation. Low. Decouples the application from the underlying discovery mechanism.
    Control High. Developers have granular control over load-balancing strategies within the application. Low. Control is centralized in the proxy, abstracting it from developers.
    Common Tools Netflix Eureka + Ribbon, HashiCorp Consul (with client library) Kubernetes Services, AWS ELB, NGINX, API Gateways (e.g., Kong, Traefik)

    Server-side discovery is now the more common pattern, as it aligns better with the DevOps philosophy of abstracting infrastructure concerns away from application code. However, client-side discovery can still be advantageous in performance-critical scenarios where minimizing network latency is paramount.

    The Service Registry: Your System's Dynamic Directory

    The service registry is the cornerstone of any service discovery mechanism. It is a highly available, distributed database specifically designed to store and serve information about service instances, including their network locations and health status. This registry becomes the definitive source of truth that enables the dynamic wiring of distributed systems.

    Without a registry, services would have no reliable way to find each other in an ephemeral environment. A consumer service queries the registry to obtain a list of healthy producers, forming the foundation for both client-side and server-side discovery patterns.

    Diagram showing a service registry as a central hub for microservices

    A registry is not a static list; it's a living database that must accurately reflect the system's state in real-time. This is achieved through two core processes: service registration and health checking.

    How Services Register Themselves

    When a new service instance starts, its first task is to perform service registration. The instance sends a request to the registry API, providing essential metadata about itself.

    This payload typically includes:

    • Service Name: The logical identifier of the service (e.g., user-api).
    • Network Location: The specific IP address and port where the service is listening for traffic.
    • Health Check Endpoint: A URL (e.g., /healthz) that the registry can poll to verify the instance's health.
    • Metadata: Optional key-value pairs for additional information, such as version, region, or environment tags.

    The registry receives this information and adds the new instance to its catalog of available endpoints for that service. This is typically implemented via a self-registration pattern, where the instance itself is responsible for this action, often during its bootstrap sequence.

    The Critical Role of Health Checks

    Knowing that a service instance exists is insufficient; the registry must know if it is capable of serving traffic. An instance could be running but stuck, overloaded, or unable to connect to its own dependencies. Sending traffic to such an instance leads to errors and potential cascading failures. Health checks are the mechanism to prevent this.

    The service registry's most important job isn't just knowing where services are; it's knowing which services are actually working. An outdated or inaccurate registry is more dangerous than no registry at all.

    The registry continuously validates the health of every registered instance. If an instance fails a health check, the registry marks it as unhealthy and immediately removes it from the pool of discoverable endpoints. This deregistration is what ensures system resilience.

    Common health checking strategies include:

    • Heartbeating (TTL): The service instance is responsible for periodically sending a "heartbeat" signal to the registry. If the registry doesn't receive a heartbeat within a configured Time-To-Live (TTL) period, it marks the instance as unhealthy.
    • Active Polling: The registry actively polls a specific health check endpoint (e.g., an HTTP /health URL) on the service instance. A successful response (e.g., HTTP 200 OK) indicates health.
    • Agent-Based Checks: A local agent running alongside the service performs more sophisticated checks (e.g., checking CPU load, memory usage, or script execution) and reports the status back to the central registry.

    Consistency vs. Availability: The CAP Theorem Dilemma

    Choosing a service registry technology forces a confrontation with the CAP theorem, a fundamental principle of distributed systems. The theorem states that a distributed data store can only provide two of the following three guarantees:

    1. Consistency (C): Every read receives the most recent write or an error.
    2. Availability (A): Every request receives a (non-error) response, without the guarantee that it contains the most recent write.
    3. Partition Tolerance (P): The system continues to operate despite network partitions (dropped messages between nodes).

    Since network partitions are a given in any distributed environment, the real choice is between consistency and availability.

    • CP Systems (Consistency & Partition Tolerance): Tools like Consul and etcd prioritize strong consistency. During a network partition, they may become unavailable for writes to prevent data divergence. They guarantee that if you get a response, it is the correct, most up-to-date data.
    • AP Systems (Availability & Partition Tolerance): Tools like Eureka prioritize availability. During a partition, nodes will continue to serve discovery requests from their local cache, even if that data might be stale. This maximizes uptime but introduces a small risk of clients being directed to a failed instance.

    This is a critical architectural decision. A system requiring strict transactional integrity or acting as a control plane (like Kubernetes) must choose a CP system. A system where uptime is paramount and clients can tolerate occasional stale reads might prefer an AP system.

    A Practical Comparison of Service Discovery Tools

    Selecting a service discovery tool is a foundational architectural decision with long-term consequences for system resilience, operational complexity, and scalability. While many tools perform the same basic function, their underlying consensus models and feature sets vary significantly.

    Let's analyze four prominent tools: Consul, etcd, Apache ZooKeeper, and Eureka. The primary differentiator among them is their position on the CAP theorem spectrum—whether they favor strong consistency (CP) or high availability (AP). This choice dictates system behavior during network partitions, which are an inevitable part of distributed computing.

    Consul: The All-in-One Powerhouse

    HashiCorp's Consul is a comprehensive service networking platform that provides service discovery, a key-value store, health checking, and service mesh capabilities in a single tool.

    Consul uses the Raft consensus algorithm to ensure strong consistency, making it a CP system. In the event of a network partition that prevents a leader from being elected, Consul will become unavailable for writes to guarantee data integrity. This makes it ideal for systems where an authoritative and correct state is non-negotiable.

    Key features include:

    • Advanced Health Checking: Supports multiple check types, including script-based, HTTP, TCP, and Time-to-Live (TTL).
    • Built-in KV Store: A hierarchical key-value store for dynamic configuration, feature flagging, and leader election.
    • Multi-Datacenter Federation: Natively supports connecting multiple data centers over a WAN, allowing for cross-region service discovery.

    etcd: The Heartbeat of Kubernetes

    Developed by CoreOS (now Red Hat), etcd is a distributed, reliable key-value store designed for strong consistency and high availability. Like Consul, it uses the Raft consensus algorithm, classifying it as a CP system.

    While etcd can be used as a general-purpose service registry, it is most famous for being the primary data store for Kubernetes. It stores the entire state of a Kubernetes cluster, including all objects like Pods, Services, Deployments, and ConfigMaps. The Kubernetes API server is its primary client.

    Every kubectl apply command results in a write to etcd, and every kubectl get command is a read. Its central role in Kubernetes is a testament to its reliability for building consistent control planes.

    Its simple HTTP/gRPC API and focus on being a minimal, reliable building block make it a strong choice for custom distributed systems that require strong consistency.

    Apache ZooKeeper: The grizzled veteran

    Apache ZooKeeper is a mature, battle-tested centralized service for maintaining configuration information, naming, providing distributed synchronization, and providing group services. It was a foundational component for large-scale systems like Hadoop and Kafka.

    ZooKeeper uses the ZooKeeper Atomic Broadcast (ZAB) protocol, which is functionally similar to Paxos and Raft, making it a CP system that prioritizes consistency. During a partition, a ZooKeeper "ensemble" will not serve requests if it cannot achieve a quorum, thus preventing stale reads.

    Its data model is a hierarchical namespace of "znodes," similar to a file system, which clients can manipulate and watch for changes. While powerful, its operational complexity and older API have led many newer projects to adopt more modern alternatives like etcd or Consul.

    Eureka: All About Availability

    Developed and open-sourced by Netflix, Eureka takes a different approach. It is an AP system, prioritizing availability and partition tolerance over strong consistency.

    Eureka eschews consensus algorithms like Raft. Instead, it uses a peer-to-peer replication model where every node replicates information to every other node. If a network partition occurs, isolated nodes continue to serve discovery requests based on their last known state (local cache).

    This design reflects Netflix's philosophy that it is better for a service to receive a slightly stale list of instances (and handle potential connection failures gracefully) than to receive no list at all. This makes Eureka an excellent choice for applications where maximizing uptime is the primary goal, and the application layer is built to be resilient to occasional inconsistencies.

    Feature Comparison of Leading Service Discovery Tools

    The ideal tool depends on your system's specific requirements for consistency and resilience. The table below summarizes the key differences.

    Tool Consistency Model Primary Use Case Key Features
    Consul Strong (CP) via Raft All-in-one service networking KV store, multi-datacenter, service mesh
    etcd Strong (CP) via Raft Kubernetes data store, reliable KV store Simple API, proven reliability, lightweight
    ZooKeeper Strong (CP) via ZAB Distributed system coordination Hierarchical namespace, mature, battle-tested
    Eureka Eventual (AP) via P2P Replication High-availability discovery Prefers availability over consistency

    For systems requiring an authoritative source of truth, a CP tool like Consul or etcd is the correct choice. For user-facing systems where high availability is paramount, Eureka's AP model offers a compelling alternative.

    How Service Discovery Works in Kubernetes

    Kubernetes provides a powerful, out-of-the-box implementation of server-side service discovery that is deeply integrated into its networking model. In a Kubernetes cluster, applications run in Pods, which are ephemeral and assigned dynamic IP addresses. Manually tracking these IPs would be impossible at scale.

    To solve this, Kubernetes introduces a higher-level abstraction called a Service. A Service provides a stable, virtual IP address and a DNS name that acts as a durable endpoint for a logical set of Pods. Client applications connect to the Service, which then intelligently load-balances traffic to the healthy backend Pods associated with it.

    Diagram illustrating the Kubernetes service discovery model

    This abstraction decouples service consumers from the transient nature of individual Pods, enabling robust cloud-native application development.

    The Core Components: ClusterIP and CoreDNS

    By default, creating a Service generates one of type ClusterIP. Kubernetes assigns it a stable virtual IP address that is routable only from within the cluster.

    To complement this, Kubernetes runs an internal DNS server, typically CoreDNS. When a Service is created, CoreDNS automatically generates a DNS A record mapping the service name to its ClusterIP. This allows any Pod in the cluster to resolve the Service using a predictable DNS name.

    For example, a Service named my-api in the default namespace is assigned a fully qualified domain name (FQDN) of:
    my-api.default.svc.cluster.local

    Pods within the same default namespace can simply connect to my-api, and the internal DNS resolver will handle the resolution to the correct ClusterIP. This DNS-based discovery is the standard and recommended pattern in Kubernetes.

    A Practical YAML Manifest Example

    Services are defined declaratively using YAML manifests. Consider a Deployment managing three replicas of a backend API. Note the app: my-api label, which is the key to linking the Pods to the Service.

    apiVersion: apps/v1
    kind: Deployment
    metadata:
      name: my-api-deployment
    spec:
      replicas: 3
      selector:
        matchLabels:
          app: my-api
      template:
        metadata:
          labels:
            app: my-api
        spec:
          containers:
          - name: api-container
            image: my-api-image:v1
            ports:
            - containerPort: 8080
    

    Next, the Service is created to expose the Deployment. The selector field in the Service manifest (app: my-api) must match the labels of the Pods it is intended to target.

    apiVersion: v1
    kind: Service
    metadata:
      name: my-api-service
    spec:
      selector:
        app: my-api
      ports:
        - protocol: TCP
          port: 80       # Port the service is exposed on
          targetPort: 8080 # Port the container is listening on
      type: ClusterIP
    

    When this YAML is applied, Kubernetes creates a Service named my-api-service with a ClusterIP. It listens on port 80 and forwards traffic to port 8080 on any healthy Pod with the app: my-api label.

    The Role of Kube-Proxy and EndpointSlices

    The translation from the virtual ClusterIP to a real Pod IP is handled by a daemon called kube-proxy, which runs on every node in the cluster.

    kube-proxy is the network agent that implements the Service abstraction. It watches the Kubernetes API server for changes to Service and EndpointSlice objects and programs the node's networking rules (typically using iptables, IPVS, or eBPF) to correctly route and load-balance traffic.

    Initially, for each Service, Kubernetes maintained a single Endpoints object containing the IP addresses of all matching Pods. This became a scalability bottleneck in large clusters, as updating a single Pod required rewriting the entire massive Endpoints object.

    To address this, Kubernetes introduced EndpointSlice objects. EndpointSlices split the endpoints for a single Service into smaller, more manageable chunks. Now, when a Pod is added or removed, only a small EndpointSlice object needs to be updated, drastically improving performance and scalability.

    This combination of a stable Service (with its ClusterIP and DNS name), kube-proxy for network programming, and scalable EndpointSlices provides a robust, fully automated service discovery system that is fundamental to Kubernetes.

    Beyond the Basics: Building a Resilient Service Discovery Layer

    Implementing a service discovery tool is only the first step. To build a production-grade, resilient system, you must address security, observability, and failure modes. A misconfigured or unmonitored service discovery layer can transform from a single source of truth into a single point of failure.

    Securing the Service Discovery Plane

    Communication between services and the registry is a prime attack vector. Unsecured traffic can lead to sensitive data exposure or malicious service registration, compromising the entire system.

    Two security practices are non-negotiable:

    • Mutual TLS (mTLS): Enforces cryptographic verification of both the client (service) and server (registry) identities before any communication occurs. It also encrypts all data in transit, preventing eavesdropping and man-in-the-middle attacks.
    • Access Control Lists (ACLs): Provide granular authorization, defining which services can register themselves (write permissions) and which can discover other services (read permissions). ACLs are essential for isolating environments and enforcing the principle of least privilege.

    Security in service discovery is not an add-on; it is a foundational requirement. mTLS and ACLs should be considered the minimum baseline for protecting your architecture's central nervous system.

    Observability and Dodging Common Pitfalls

    Effective observability is crucial for maintaining trust in your service discovery system. Monitoring key metrics provides the insight needed to detect and mitigate issues before they cause outages.

    Key metrics to monitor include:

    • Registry Health: For consensus-based systems like Consul or etcd, monitor leader election churn and commit latency. For all registries, track API query latency and error rates. A slow or unhealthy registry will degrade the performance of the entire system.
    • Registration Churn: A high rate of service registrations and deregistrations ("flapping") often indicates underlying application instability, misconfigured health checks, or resource contention.

    Common pitfalls to avoid include poorly configured health check Time-To-Live (TTL) values, which can lead to stale data in the registry, and failing to plan for split-brain scenarios during network partitions, particularly with AP systems. Designing robust, multi-faceted health checks and understanding the consistency guarantees of your chosen tool are critical for building a system that is resilient in practice, not just in theory.

    Frequently Asked Questions About Service Discovery

    We've covered the technical underpinnings of service discovery. Here are answers to common questions that arise during practical implementation.

    What's the Difference Between Service Discovery and a Load Balancer?

    They are distinct but complementary components. A load balancer distributes incoming network traffic across a set of backend servers. Service discovery is the process that provides the load balancer with the dynamic list of healthy backend servers.

    In a modern architecture, the load balancer queries the service registry to get the real-time list of available service instances. The service discovery mechanism finds the available targets, and the load balancer distributes work among them.

    How Does Service Discovery Handle Service Failures?

    This is a core function of service discovery and is essential for building self-healing systems. The service registry continuously performs health checks on every registered service instance.

    When an instance fails a health check (e.g., stops responding to a health endpoint or its heartbeat TTL expires), the registry immediately removes it from the pool of available instances. This automatic deregistration ensures that no new traffic is routed to the failed instance, preventing cascading failures and maintaining overall application availability.

    Can't I Just Use DNS for Service Discovery?

    While DNS is a form of discovery (resolving a name to an IP), traditional DNS is ill-suited for the dynamic nature of microservices. The primary issue is caching. DNS records have a Time-To-Live (TTL) that instructs clients on how long to cache a resolved IP address. In a dynamic environment, a long TTL can cause clients to hold onto the IP of a service instance that has already been terminated and replaced.

    Modern systems like Kubernetes use an integrated DNS server with very low TTLs and an API-driven control plane to mitigate this. More importantly, a true service discovery system provides critical features that DNS lacks, such as integrated health checking, service metadata, and a programmatic API for registration, which are essential for cloud-native applications.


    Ready to build a resilient, scalable infrastructure without the operational overhead? The experts at OpsMoon can help you design and implement the right service discovery strategy for your needs. Schedule your free work planning session to create a clear roadmap for your DevOps success.

  • A Technical Guide to Legacy System Modernization

    A Technical Guide to Legacy System Modernization

    Legacy system modernization is the strategic, technical process of re-engineering outdated, monolithic, and high-cost systems into agile, secure, and performant assets that accelerate business velocity. This is not a superficial tech refresh; it is a fundamental re-architecting of core business capabilities to enable innovation and reduce operational drag.

    The Strategic Imperative of Modernization

    Operating with legacy technology in a modern digital landscape is a significant competitive liability. These systems, often characterized by monolithic architectures, procedural codebases (e.g., COBOL, old Java versions), and tightly coupled dependencies, create systemic friction. They actively impede innovation cycles, present an enormous attack surface, and make attracting skilled engineers who specialize in modern stacks nearly impossible.

    This technical debt is not a passive problem; it actively accrues interest in the form of security vulnerabilities, operational overhead, and lost market opportunities.

    The decision to modernize is a critical inflection point where an organization shifts from a reactive, maintenance-focused posture to a proactive, engineering-driven one. The objective is to build a resilient, scalable, and secure technology stack that functions as a strategic enabler, not an operational bottleneck.

    Why Modernization Is a Business Necessity

    Deferring modernization does not eliminate the problem; it compounds it. The longer legacy systems remain in production, the higher the maintenance costs, the greater the security exposure, and the deeper the chasm between their capabilities and modern business requirements.

    The technical drivers for modernization are clear and quantifiable:

    • Security Vulnerabilities: Legacy platforms often lack support for modern cryptographic standards (e.g., TLS 1.3), authentication protocols (OAuth 2.0/OIDC), and are difficult to patch, making them prime targets for exploits.
    • Sky-High Operational Costs: Budgets are consumed by exorbitant licensing fees for proprietary software (e.g., Oracle databases), maintenance contracts for end-of-life hardware, and the high salaries required for engineers with rare, legacy skill sets.
    • Lack of Agility: Monolithic architectures demand that the entire application be rebuilt and redeployed for even minor changes. This results in long, risky release cycles, directly opposing the need for rapid, iterative feature delivery.
    • Regulatory Compliance Headaches: Adhering to regulations like GDPR, CCPA, or PCI-DSS is often unachievable on legacy systems without expensive, brittle, and manually intensive workarounds.

    This market is exploding for a reason. Projections show the global legacy modernization market is set to nearly double, reaching USD 56.87 billion by 2030. This isn't hype; it's driven by intense regulatory pressure and the undeniable need for real-time data integrity. You can read the full research about the legacy modernization market drivers to see what's coming.

    Your Blueprint for Transformation

    This guide provides a technical and strategic blueprint for executing a successful modernization initiative. We will bypass high-level theory in favor of an actionable, engineering-focused roadmap. This includes deep-dive technical assessments, detailed migration patterns, automation tooling, and phased implementation strategies designed to align technical execution with measurable business outcomes.

    Conducting a Deep Technical Assessment

    A team of engineers collaborating around a screen showing complex system architecture diagrams.

    Attempting to modernize a legacy system without a comprehensive technical assessment is analogous to performing surgery without diagnostic imaging. Before devising a strategy, it is imperative to dissect the existing system to gain a quantitative and qualitative understanding of its architecture, codebase, and data dependencies.

    This audit is the foundational data-gathering phase that informs all subsequent architectural, financial, and strategic decisions. Its purpose is to replace assumptions with empirical data, enabling an accurate evaluation of the system's condition and the creation of a risk-aware modernization plan.

    Quantifying Code Complexity and Technical Debt

    Legacy codebases are often characterized by high coupling, low cohesion, and a significant lack of documentation. A manual review is impractical. Static analysis tooling is essential for objective measurement.

    Tools like SonarQube, CodeClimate, or Veracode automate the scanning of entire codebases to produce objective metrics that define the application's health.

    Key metrics to analyze:

    • Cyclomatic Complexity: This metric quantifies the number of linearly independent paths through a program's source code. A value exceeding 15 per function or method indicates convoluted logic that is difficult to test, maintain, and debug, signaling a high-risk area for refactoring.
    • Technical Debt: SonarQube estimates the remediation effort for identified issues in man-days. A system with 200 days of technical debt represents a quantifiable liability that can be presented to stakeholders.
    • Code Duplication: Duplicated code blocks are a primary source of maintenance overhead and regression bugs. A duplication percentage above 5% is a significant warning sign.
    • Security Vulnerabilities: Scanners identify common vulnerabilities (OWASP Top 10) such as SQL injection, Cross-Site Scripting (XSS), and the use of libraries with known CVEs (Common Vulnerabilities and Exposures).

    Mapping Data Dependencies and Infrastructure Bottlenecks

    A legacy application is rarely a self-contained unit. It typically interfaces with a complex web of databases, message queues, file shares, and external APIs, often with incomplete or nonexistent documentation. Identifying these hidden data dependencies is critical to prevent service interruptions during migration.

    The initial step is to create a complete data flow diagram, tracing every input and output, mapping database calls via connection strings, and identifying all external API endpoints. This process often uncovers undocumented, critical dependencies.

    Concurrently, a thorough audit of the underlying infrastructure is necessary.

    Your infrastructure assessment should produce a risk register. This document must inventory every server running an unsupported OS (e.g., Windows Server 2008), every physical server nearing its end-of-life (EOL), and every network device acting as a performance bottleneck. This documentation provides the technical justification for infrastructure investment.

    Applying a System Maturity Model

    The data gathered from code, data, and infrastructure analysis should be synthesized into a system maturity model. This framework provides an objective scoring mechanism to evaluate the legacy system across key dimensions such as maintainability, scalability, security, and operational stability.

    Using this model, each application module or service can be categorized, answering the critical question: modernize, contain, or decommission? This data-driven approach allows for the creation of a prioritized roadmap that aligns technical effort with the most significant business risks and opportunities, ensuring the modernization journey is based on empirical evidence, not anecdotal assumptions.

    Choosing Your Modernization Strategy

    With a data-backed technical assessment complete, the next phase is to select the appropriate modernization strategy. This decision is a multi-variable equation influenced by business objectives, technical constraints, team capabilities, and budget. While various frameworks like the "7 Rs" exist, we will focus on the four most pragmatic and widely implemented patterns: Rehost, Replatform, Rearchitect, and Replace.

    Rehosting: The "Lift-and-Shift"

    Rehosting involves migrating an application from on-premise infrastructure to a cloud IaaS (Infrastructure-as-a-Service) provider like AWS or Azure with minimal to no modification of the application code or architecture. This is a pure infrastructure play, effectively moving virtual machines (VMs) from one hypervisor to another.

    This approach is tactically advantageous when:

    • The primary driver is an imminent data center lease expiration or hardware failure.
    • The team is nascent in its cloud adoption and requires a low-risk initial project.
    • The application is a black box with no available source code or institutional knowledge.

    However, rehosting does not address underlying architectural deficiencies. The application remains a monolith and will not natively benefit from cloud-native features like auto-scaling or serverless computing. For a deeper dive into this first step, check out our guide on how to migrate to cloud.

    Replatforming: The "Tweak-and-Move"

    Replatforming extends the rehosting concept by introducing minor, targeted modifications to leverage cloud-managed services, without altering the core application architecture.

    A canonical example is migrating a self-hosted PostgreSQL database to a managed service like Amazon RDS or Azure Database for PostgreSQL. Another common replatforming tactic is containerizing a monolithic application with Docker to run it on a managed orchestration service like Amazon EKS or Azure Kubernetes Service (AKS).

    This strategy offers a compelling balance of effort and return, delivering tangible benefits like reduced operational overhead and improved scalability without the complexity of a full rewrite.

    Replatforming a monolith to Kubernetes is often a highly strategic intermediate step. It provides immediate benefits in deployment automation, portability, and resilience, deferring the significant architectural complexity of a full microservices decomposition until a clear business case emerges.

    Rearchitecting for Cloud-Native Performance

    Rearchitecting is the most transformative approach, involving a fundamental redesign of the application to a modern, cloud-native architecture. This typically means decomposing a monolith into a collection of loosely coupled, independently deployable microservices. This is the most complex and resource-intensive strategy, but it yields the greatest long-term benefits in terms of agility, scalability, and resilience.

    This path is indicated when:

    • The monolith has become a development bottleneck, preventing parallel feature development and causing deployment contention.
    • The application requires the integration of modern technologies (e.g., AI/ML services, event-driven architectures) that are incompatible with the legacy stack.
    • The business requires high availability and fault tolerance that can only be achieved through a distributed systems architecture.

    A successful microservices transition requires a mature DevOps culture, robust CI/CD automation, and advanced observability practices.

    Comparing Legacy System Modernization Strategies

    A side-by-side comparison of these strategies clarifies the trade-offs between speed, cost, risk, and transformational value.

    Strategy Technical Approach Ideal Use Case Cost & Effort Risk Level Key Benefit
    Rehost Move application to IaaS with no code changes. Rapidly moving off legacy hardware; first step in cloud journey. Low Low Speed to market; reduced infrastructure management.
    Replatform Make minor cloud optimizations (e.g., managed DB, containers). Gaining cloud benefits without a full rewrite; improving operational efficiency. Medium Medium Improved performance and scalability with moderate investment.
    Rearchitect Decompose monolith into microservices; adopt cloud-native patterns. Monolith is a bottleneck; need for high agility and resilience. High High Maximum agility, scalability, and long-term innovation.
    Replace Decommission legacy app and switch to a SaaS/COTS solution. Application supports a non-core business function (e.g., CRM, HR). Variable Medium Eliminates maintenance overhead; immediate access to modern features.

    This matrix serves as a decision-making framework to align the technical strategy with specific business objectives.

    Replacing With a SaaS Solution

    In some cases, the optimal engineering decision is to stop maintaining a bespoke application altogether. Replacing involves decommissioning the legacy system in favor of a commercial off-the-shelf (COTS) or Software-as-a-Service (SaaS) solution. This is a common strategy for commodity business functions like CRM (e.g., Salesforce), HRIS (e.g., Workday), or finance.

    The critical decision criterion is whether a market solution can satisfy at least 80% of the required business functionality out-of-the-box. If so, replacement is often the most cost-effective path, eliminating all future development and maintenance overhead. This is a significant factor, as approximately 70% of banks worldwide continue to operate on expensive-to-maintain legacy systems.

    For organizations pursuing cloud-centric strategies, adopting a structured methodology like the Azure Cloud Adoption Framework provides a disciplined, phase-based approach to migration. Ultimately, the choice of strategy must be grounded in the empirical data gathered during the technical assessment.

    Automating Your Modernization Workflow

    Attempting to execute a legacy system modernization with manual processes is inefficient, error-prone, and unscalable. A robustly automated workflow for build, test, and deployment is a non-negotiable prerequisite for de-risking the project and accelerating value delivery.

    This automated workflow is the core engine of the modernization effort, providing the feedback loops and safety nets necessary for rapid, iterative development. The objective is to make software delivery a predictable, repeatable, and low-risk activity.

    Building a Robust CI/CD Pipeline

    The foundation of the automated workflow is a Continuous Integration and Continuous Deployment (CI/CD) pipeline. This pipeline automates the process of moving code from a developer's commit to a production deployment, enforcing quality gates at every stage.

    Modern CI/CD tools like GitLab CI or GitHub Actions are configured via declarative YAML files (.gitlab-ci.yml or a file in .github/workflows/) stored within the code repository. This practice, known as Pipelines as Code, ensures the build and deploy process is version-controlled and auditable.

    For a legacy modernization project, the pipeline must be versatile enough to manage both the legacy and modernized components. This might involve a pipeline stage that builds a Docker image for a new microservice alongside another stage that packages a legacy component for deployment to a traditional application server. Our guide on CI/CD pipeline best practices provides a detailed starting point.

    Managing Environments with Infrastructure as Code

    As new microservices are developed, they require corresponding infrastructure (compute instances, databases, networking rules). Manual provisioning of this infrastructure leads to configuration drift and non-reproducible environments. Infrastructure as Code (IaC) is the solution.

    Using tools like Terraform (declarative) or Ansible (procedural), the entire cloud infrastructure is defined in version-controlled configuration files. This enables the automated, repeatable creation of identical environments for development, staging, and production.

    For example, a Terraform configuration can define a Virtual Private Cloud (VPC), subnets, security groups, and the compute instances required for a new microservice. This is the only scalable method for managing the environmental complexity of a hybrid legacy/modern architecture.

    Containerization and Orchestration

    Containers are a key enabling technology for modernization, providing application portability and environmental consistency. Docker allows applications and their dependencies to be packaged into a standardized, lightweight unit that runs identically across all environments. Both new microservices and components of the monolith can be containerized.

    As the number of containers grows, manual management becomes untenable. A container orchestrator like Kubernetes automates the deployment, scaling, and lifecycle management of containerized applications.

    Kubernetes provides critical capabilities:

    • Self-healing: Automatically restarts failed containers.
    • Automated rollouts: Enables zero-downtime deployments and rollbacks.
    • Scalability: Automatically scales application replicas based on CPU or custom metrics.

    Establishing Full-Stack Observability

    Effective monitoring is critical for a successful modernization. A comprehensive observability stack provides the telemetry (metrics, logs, and traces) needed to benchmark performance, diagnose issues, and validate the success of the migration.

    A common failure pattern is deferring observability planning until after the migration. It is essential to capture baseline performance metrics from the legacy system before modernization begins. Without this baseline, it is impossible to quantitatively prove that the new system represents an improvement.

    A standard, powerful open-source observability stack includes:

    • Prometheus: For collecting time-series metrics from applications and infrastructure.
    • Grafana: For building dashboards to visualize Prometheus data.
    • ELK Stack (Elasticsearch, Logstash, Kibana): For centralized log aggregation and analysis.

    This instrumentation provides deep visibility into system performance and is a prerequisite for data-driven optimization. As recent data shows, with 62% of U.S. IT professionals still working with aging platforms, modernizing with observable systems is what enables the adoption of advanced capabilities like AI and analytics. Discover more insights about legacy software trends in 2025 and see why this kind of automation is no longer optional.

    Executing a Phased Rollout and Cutover

    The "big bang" cutover, where the old system is turned off and the new one is turned on simultaneously, is an unacceptably high-risk strategy. It introduces a single, massive point of failure and often results in catastrophic outages and complex rollbacks.

    A phased rollout is the disciplined, risk-averse alternative. It involves a series of incremental, validated steps to migrate functionality and traffic from the legacy system to the modernized platform. This approach de-risks the transition by isolating changes and providing opportunities for validation at each stage.

    The rollout is not a single event but a continuous process of build, deploy, monitor, and iterate, underpinned by the automation established in the previous phase.

    Infographic about legacy system modernization

    This process flow underscores that modernization is a continuous improvement cycle, not a finite project.

    Validating Your Approach With a Proof of Concept

    Before committing to a full-scale migration, the viability of the proposed architecture and toolchain must be validated with a Proof of Concept (PoC). A single, low-risk, and well-isolated business capability should be selected for the PoC.

    The objective of the PoC extends beyond simply rewriting a piece of functionality. It is a full-stack test of the entire modernization workflow. Can the CI/CD pipeline successfully build, test, and deploy a containerized service to the target environment? Does the observability stack provide the required visibility? The PoC serves as a technical dress rehearsal.

    A successful PoC provides invaluable empirical data and builds critical stakeholder confidence and team momentum.

    Implementing the Strangler Fig Pattern

    Following a successful PoC, the Strangler Fig pattern is an effective architectural strategy for incremental modernization. New, modern services are built around the legacy monolith, gradually intercepting traffic and replacing functionality until the old system is "strangled" and can be decommissioned.

    This is implemented by placing a routing layer, such as an API Gateway or a reverse proxy like NGINX or HAProxy, in front of all incoming application traffic. This facade acts as the central traffic director.

    The process is as follows:

    • Initially, the facade routes 100% of traffic to the legacy monolith.
    • A new microservice is developed to handle a specific function, e.g., user authentication. The facade is configured to route all requests to /api/auth to the new microservice.
    • All other requests continue to be routed to the monolith, which remains unaware of the change.

    This process is repeated iteratively, service by service, until all functionality has been migrated to the new platform. The monolith's responsibilities shrink over time until it can be safely retired.

    The primary benefit of the Strangler Fig pattern is its incremental nature. It enables the continuous delivery of business value while avoiding the risk of a monolithic cutover. Each deployed microservice is a measurable, incremental success.

    Managing Data Migration and Traffic Shifting

    Data migration is often the most complex and critical phase of the cutover. Our guide on database migration best practices provides a detailed methodology for this phase.

    Two key techniques for managing the transition are:

    • Parallel Runs: For a defined period, both the legacy and modernized systems are run in parallel, processing live production data. The outputs of both systems are compared to verify that the new system produces identical results under real-world conditions. This is a powerful validation technique that builds confidence before the final cutover.
    • Canary Releases: Rather than a binary traffic switch, a canary release involves routing a small percentage of user traffic (e.g., 5%) to the new system. Performance metrics and error rates are closely monitored. If the system remains stable, traffic is incrementally increased—to 25%, then 50%, and finally 100%.

    As the phased rollout nears completion, the final step involves the physical retirement of legacy infrastructure. This often requires engaging specialized partners who provide data center decommissioning services to ensure secure data destruction and environmentally responsible disposal of old hardware, fully severing dependencies on the legacy environment.

    Hitting the cutover button on your legacy modernization project feels like a huge win. And it is. But it’s the starting line, not the finish. The real payoff comes later, through measurable improvements and a solid plan for continuous evolution. If you don't have a clear way to track success, you’re just flying blind—you can't prove the project's ROI or guide the new system to meet future business goals.

    Once you deploy, the game shifts from migration to optimization. You need to lock in a set of key performance indicators (KPIs) that tie your technical wins directly to business outcomes. This is how you show stakeholders the real-world impact of all that hard work.

    Defining Your Key Performance Indicators

    You'll want a balanced scorecard of business and operational metrics. This way, you’re not just tracking system health but also its direct contribution to the bottom line. Vague goals like "improved agility" won't cut it. You need hard numbers.

    Business-Focused KPIs

    • Total Cost of Ownership (TCO): Track exactly how much you're saving by decommissioning old hardware, dropping expensive software licenses, and slashing maintenance overhead. A successful project might deliver a 30% TCO reduction within the first year.
    • Time-to-Market for New Features: How fast can you get an idea from a whiteboard into production? If it used to take six months to launch a new feature and now it's down to three weeks, that’s a win you can take to the bank.
    • Revenue Uplift: This one is crucial. You need to draw a straight line from the new system's capabilities—like better uptime or brand-new features—to a direct increase in customer conversions or sales.

    Operational KPIs (DORA Metrics)

    The DORA metrics are the industry gold standard for measuring the performance of high-performing technology organizations. They are essential for quantifying operational efficiency.

    • Deployment Frequency: How often do you successfully push code to production? Moving from quarterly releases to daily deployments is a massive improvement.
    • Lead Time for Changes: What’s the clock time from a code commit to it running live in production? This metric tells you just how efficient your entire development cycle is.
    • Change Failure Rate: What percentage of your deployments result in a production failure that requires a hotfix or rollback? Elite teams aim for a rate under 15%.
    • Time to Restore Service (MTTR): When things inevitably break, how quickly can you fix them? This is a direct measure of your system's resilience and your team's ability to respond.

    A pro tip: Get these KPIs onto dedicated dashboards in tools like Grafana or Power BI. Don't hide them away—make them visible to the entire organization. This kind of transparency builds accountability and keeps everyone focused on improvement long after the initial modernization project is "done."

    Choosing the Right Engagement Model for Evolution

    Your shiny new system is going to need ongoing care and feeding to keep it optimized and evolving. It's totally normal to have skill gaps on your team, and finding the right external expertise is key to long-term success. Generally, you'll look at three main ways to bring in outside DevOps and cloud talent.

    Engagement Model Best For Key Characteristic
    Staff Augmentation Filling immediate, specific skill gaps (e.g., you need a Kubernetes guru for the next 6 months). Engineers slot directly into your existing teams and report to your managers.
    Project-Based Consulting Outsourcing a well-defined project with a clear start and end (like building a brand-new CI/CD pipeline). A third party takes full ownership from discovery all the way to delivery.
    Managed Services Long-term operational management of a specific domain (think 24/7 SRE support for your production environment). An external partner takes ongoing responsibility for system health and performance.

    Each model comes with its own trade-offs in terms of control, cost, and responsibility. The right choice really hinges on your internal team's current skills and where you want to go strategically. A startup, for instance, might go with a project-based model to get its initial infrastructure built right, while a big enterprise might use staff augmentation to give a specific team a temporary boost.

    Platforms like OpsMoon give you the flexibility to tap into top-tier remote DevOps engineers across any of these models. This ensures you have the right expertise at the right time to keep your modernized system an evolving asset—not tomorrow's technical debt.

    Got Questions? We've Got Answers

    When you're staring down a legacy modernization project, a lot of questions pop up. It's only natural. Let's tackle some of the most common ones I hear from technical and business leaders alike.

    Where Do We Even Start With a Legacy Modernization Project?

    The first step is always a deep, data-driven assessment. Do not begin writing code or provisioning cloud infrastructure until this phase is complete.

    The assessment must be multifaceted: a technical audit to map code complexity and dependencies using static analysis tools, a business value assessment to identify which system components are mission-critical, and a cost analysis to establish a baseline Total Cost of Ownership (TCO).

    Skipping this discovery phase is the most common cause of modernization failure, leading to scope creep, budget overruns, and unforeseen technical obstacles.

    How Can I Justify This Huge Cost to the Board?

    Frame the initiative as an investment with a clear ROI, not as a cost center. The business case must be built on quantitative data, focusing on the cost of inaction.

    Use data from your assessment to project TCO reduction from decommissioning hardware and eliminating software licensing. Quantify the risk of security breaches associated with unpatched legacy systems. Model the opportunity cost of slow time-to-market compared to more agile competitors.

    The most powerful tool in your arsenal is the cost of inaction. Use the data from your assessment to put a dollar amount on how much that legacy system is costing you every single day. Show the stakeholders the real-world risk of security breaches, missed market opportunities, and maintenance bills that just keep climbing. The question isn't "can we afford to do this?" it's "can we afford not to?"

    Is It Possible to Modernize Without Bringing the Business to a Halt?

    Yes, by adopting a phased, risk-averse migration strategy. A "big bang" cutover is not an acceptable approach for any critical system. The Strangler Fig pattern is the standard architectural approach for this, allowing for the incremental replacement of legacy functionality with new microservices behind a routing facade.

    To ensure a zero-downtime transition, employ specific technical validation strategies:

    • Parallel Runs: Operate the legacy and new systems simultaneously against live production data streams, comparing outputs to guarantee behavioral parity before redirecting user traffic.
    • Canary Releases: Use a traffic-splitting mechanism to route a small, controlled percentage of live user traffic to the new system. Monitor performance and error rates closely before incrementally increasing the traffic share.

    These techniques systematically de-risk the migration, ensuring business continuity throughout the modernization process.


    At OpsMoon, we don't just talk about modernization roadmaps—we build them and see them through. Our top-tier remote DevOps experts have been in the trenches and have the deep technical experience to guide your project from that first assessment all the way to a resilient, scalable, and future-proof system.

    Start your modernization journey with a free work planning session today.

  • How to Check IaC: A Technical Guide for DevOps

    How to Check IaC: A Technical Guide for DevOps

    To properly validate Infrastructure as Code (IaC), you must implement a multi-layered strategy that extends far beyond basic syntax checks. A robust validation process integrates static analysis, security scanning, and policy enforcement directly into the development and deployment lifecycle. The primary objective is to systematically detect and remediate misconfigurations, security vulnerabilities, and compliance violations before they reach a production environment.

    Why Modern DevOps Demands Rigorous IaC Validation

    In modern cloud-native environments, the declarative definition of infrastructure through IaC is standard practice. However, for DevOps and platform engineers, the critical task is ensuring that this code is secure, compliant, and cost-efficient. Deploying unvalidated IaC introduces significant risk, potentially creating security vulnerabilities, causing uncontrolled cloud expenditure, or resulting in severe compliance breaches.

    This guide provides a technical, multi-layered framework for validating IaC. We will cover local validation techniques like static analysis and linting, progress to automated security and policy-as-code checks, and integrate these stages into a CI/CD pipeline for early detection. This framework is engineered to accelerate infrastructure delivery while enhancing security and reliability.

    The Shift From Manual Checks to Automated Guardrails

    The complexity of modern cloud infrastructure renders manual reviews insufficient and prone to error. A single misconfigured security group or an over-privileged IAM role can expose an entire organization to significant risk. Automated validation acts as a set of programmatic guardrails, ensuring every infrastructure change adheres to predefined technical and security standards.

    This approach codifies an organization's operational best practices and security policies directly into the development workflow, shifting from a reactive to a proactive security posture. For a deeper analysis of foundational principles, refer to our guide on Infrastructure as Code best practices.

    The core principle is to subject infrastructure code to the same rigorous validation pipeline as application code. This includes linting, static analysis, security scanning, and automated testing at every stage of its lifecycle.

    Understanding the Core Components of IaC Validation

    A robust IaC validation strategy is composed of several distinct, complementary layers, each serving a specific technical function:

    • Static Analysis & Linting: This is the first validation gate, performed locally or in early CI stages. It identifies syntactical errors, formatting deviations, and the use of deprecated or non-optimal resource attributes before a commit.
    • Security & Compliance Scanning: This layer scans IaC definitions for known vulnerabilities and configuration weaknesses. It audits the code against established security benchmarks (e.g., CIS) and internal security policies.
    • Policy as Code (PaC): This layer enforces organization-specific governance rules. Examples include mandating specific resource tags, restricting deployments to approved geographic regions, or prohibiting the use of certain instance types.
    • Dry Runs & Plans: This is the final pre-execution validation step. It simulates the changes that will be applied to the target environment, generating a detailed execution plan for review without modifying live infrastructure.

    This screenshot from Terraform's homepage illustrates the standard write, plan, and apply workflow.

    The plan stage is a critical validation step, providing a deterministic preview of the mutations Terraform intends to perform on the infrastructure state.

    Implement Static Analysis for Early Feedback

    The most efficient validation occurs before code is ever committed to a repository. Static analysis provides an immediate, local feedback loop by inspecting code for defects without executing it. This practice is a core tenet of the shift-left testing philosophy, which advocates for moving validation as early as possible in the development lifecycle to minimize the cost and complexity of remediation. By integrating these checks into the local development environment, you drastically reduce the likelihood of introducing trivial errors into the CI/CD pipeline. For a comprehensive overview of this approach, read our article on what is shift-left testing.

    Starting with Built-in Validation Commands

    Most IaC frameworks include native commands for basic validation. These should be integrated into your workflow as a pre-commit hook or executed manually before every commit.

    For engineers using Terraform, the terraform validate command is the foundational check. It performs several key verifications:

    • Syntax Validation: Confirms that the HCL (HashiCorp Configuration Language) is syntactically correct and parsable.
    • Schema Conformance: Checks that resource blocks, data sources, and module calls conform to the expected schema.
    • Reference Integrity: Verifies that all references to variables, locals, and resource attributes are valid within their scope.

    A successful validation produces a concise success message.

    $ terraform validate
    Success! The configuration is valid.
    

    It is critical to understand the limitations of terraform validate. It does not communicate with cloud provider APIs, so it cannot detect invalid resource arguments (e.g., non-existent instance types) or logical errors. Its sole purpose is to confirm syntactic and structural correctness.

    For Pulumi users, the equivalent command is pulumi preview --diff. This command communicates with the cloud provider to generate a detailed plan, and the --diff flag provides a color-coded output highlighting the exact changes to be applied. It is an essential step for identifying logical errors and understanding the real-world impact of code modifications from the command line.

    Leveling Up with Linters

    To move beyond basic syntax, you must employ dedicated linters. These tools analyze code against an extensible ruleset of best practices, common misconfigurations, and potential bugs, providing a deeper level of static analysis.

    Two prominent open-source linters are TFLint for Terraform and cfn-lint for AWS CloudFormation.

    Using TFLint for Terraform

    TFLint is specifically engineered to detect issues that terraform validate overlooks. It inspects provider-specific attributes, such as flagging incorrect instance types for an AWS EC2 resource or warning about the use of deprecated arguments.

    To use it, first initialize TFLint for your project, which downloads necessary provider plugins, and then run the analysis.

    # Initialize TFLint to download provider-specific rulesets
    $ tflint --init
    
    # Run the linter against the current directory
    $ tflint
    

    Example output might identify a common performance-related misconfiguration:

    Warning: instance_type "t2.nano" is not recommended for production workloads. (aws_instance_invalid_type)
    
      on main.tf line 18:
      18:   instance_type = "t2.nano"
    
    Reference: https://github.com/terraform-linters/tflint-ruleset-aws/blob/v0.22.0/docs/rules/aws_instance_invalid_type.md
    

    This type of immediate, actionable feedback is invaluable. For an optimal developer experience, integrate TFLint into your IDE using a plugin to get real-time analysis as you write code. The demand for such precision is reflected in various industries; for instance, the Idle Air Control (IAC) actuator market, valued at USD 1.04 billion in 2024, is projected to reach USD 2.36 billion by 2032 due to the need for precise engine components, as detailed by SNS Insider.

    Running cfn-lint for CloudFormation

    For teams standardized on AWS CloudFormation, cfn-lint is the official and essential linter. It validates templates against the official CloudFormation resource specification, detecting invalid property values, incorrect resource types, and other common errors.

    Execution is straightforward:

    $ cfn-lint my-template.yaml
    

    Pro Tip: Commit a shared linter configuration file (e.g., .tflint.hcl or .cfnlintrc) to your version control repository. This ensures that all developers and CI/CD jobs operate with a consistent, versioned ruleset, enforcing a uniform quality standard across the engineering team.

    By mandating static analysis as part of the local development loop, you establish a solid foundation of code quality, catching simple errors instantly and freeing up CI/CD resources for more complex security and policy validation.

    Automate Security and Compliance with Policy as Code

    While static analysis addresses code quality, the next critical validation layer is enforcing security and compliance requirements. This is accomplished through Policy as Code (PaC), a practice that transforms security policies from static documents into executable code that is evaluated alongside your IaC definitions.

    Instead of relying on manual pull request reviews to detect an unencrypted S3 bucket or an IAM role with excessive permissions, PaC tools function as automated security gatekeepers. They scan your Terraform, CloudFormation, or other IaC files against extensive libraries of security best practices, flagging misconfigurations before they are deployed. For a broader perspective on cloud security, review these essential cloud computing security best practices.

    A Look at the Top IaC Security Scanners

    The open-source ecosystem provides several powerful tools for IaC security scanning. Three of the most widely adopted are Checkov, tfsec, and Terrascan. Each has a distinct focus and set of capabilities.

    Comparison of IaC Security Scanning Tools

    Tool Primary Focus Supported IaC Custom Policies
    Checkov Broad security & compliance coverage Terraform, CloudFormation, Kubernetes, Dockerfiles, etc. Python, YAML
    tfsec High-speed, developer-centric Terraform security scanning Terraform YAML, JSON, Rego
    Terrascan Extensible security scanning with Rego policies Terraform, CloudFormation, Kubernetes, Dockerfiles, etc. Rego (OPA)

    Checkov is an excellent starting point for most teams due to its extensive rule library and broad support for numerous IaC frameworks, making it ideal for heterogeneous environments.

    Installation and execution are straightforward using pip:

    # Install Checkov
    pip install checkov
    
    # Scan a directory containing IaC files
    checkov -d .
    

    The tool scans all supported file types and generates a detailed report, including remediation guidance and links to relevant documentation. The output is designed to be immediately actionable for developers.

    This output provides precise, actionable feedback by identifying the failed check ID, the file path, and the specific line of code, eliminating ambiguity and accelerating remediation.

    Implementing Custom Policies with OPA and Conftest

    While out-of-the-box security rules cover common vulnerabilities, organizations require enforcement of specific internal governance policies. These might include mandating a particular resource tagging schema, restricting deployments to certain geographic regions, or limiting the allowable sizes of virtual machines.

    This is the ideal use case for Open Policy Agent (OPA) and its companion tool, Conftest.

    OPA is a general-purpose policy engine that uses a declarative language called Rego to define policies. Conftest allows you to apply these Rego policies to structured data files, including IaC. This combination provides granular control to codify any custom rule. For more on integrating security into your development lifecycle, refer to our guide on DevOps security best practices.

    Consider a technical example: enforcing a mandatory CostCenter tag on all AWS S3 buckets. This rule can be expressed in a Rego file:

    package main
    
    # Deny if an S3 bucket resource exists without a CostCenter tag
    deny[msg] {
        input.resource.aws_s3_bucket[name]
        not input.resource.aws_s3_bucket[name].tags.CostCenter
        msg := sprintf("S3 bucket '%s' is missing the required 'CostCenter' tag", [name])
    }
    

    Save this code as policy/tags.rego. To validate a Terraform plan against this policy, you first convert the plan to a JSON representation and then execute Conftest.

    # Generate a binary plan file
    terraform plan -out=plan.binary
    
    # Convert the binary plan to JSON
    terraform show -json plan.binary > plan.json
    
    # Test the JSON plan against the Rego policy
    conftest test plan.json
    

    If any S3 bucket in the plan violates the policy, Conftest will exit with a non-zero status code and output the custom error message, effectively blocking a non-compliant change. This powerful combination enables the creation of a fully customized validation pipeline that enforces business-critical governance rules.

    Build a Bulletproof IaC Validation Pipeline

    Integrating static analysis and policy scanning into an automated CI/CD pipeline is the key to creating a systematic and reliable validation process. This transforms disparate checks into a cohesive quality gate that vets every infrastructure change before it reaches production. The objective is to provide developers with fast, context-aware feedback directly within their version control system, typically within a pull request. This approach programmatic enforcement of security and compliance, shifting the responsibility from individual reviewers to an automated system.

    This diagram illustrates the core stages of an automated IaC validation pipeline, from code commit to policy enforcement.

    This workflow exemplifies the "shift-left" principle by embedding validation directly into the development lifecycle, ensuring immediate feedback and fostering a culture of continuous improvement.

    Structuring a Multi-Stage IaC Pipeline

    A well-architected IaC pipeline uses a multi-stage approach to fail fast, conserving CI resources by catching simple errors before executing more time-consuming scans. Adhering to robust CI/CD pipeline best practices is crucial for building an effective and maintainable workflow.

    A highly effective three-stage structure is as follows:

    1. Lint & Validate: This initial stage is lightweight and fast. It executes commands like terraform validate and linters such as TFLint. Its purpose is to provide immediate feedback on syntactical and formatting errors within seconds.
    2. Security Scan: Upon successful validation, the pipeline proceeds to deeper analysis. This stage executes security and policy-as-code tools like Checkov, tfsec, or a custom Conftest suite to identify security vulnerabilities, misconfigurations, and policy violations.
    3. Plan Review: With syntax and security validated, the final stage generates an execution plan using terraform plan. This step confirms that the code is logically sound and can be successfully translated into a series of infrastructure changes, serving as the final automated sanity check.

    This layered approach improves efficiency and simplifies debugging by isolating the source of failures.

    Implementing the Pipeline in GitHub Actions

    GitHub Actions is an ideal platform for implementing these workflows due to its tight integration with source control. A workflow can be configured to trigger on every pull request, execute the validation stages, and surface the results directly within the PR interface.

    The following is a production-ready example for a Terraform project. Save this YAML configuration as .github/workflows/iac-validation.yml in your repository.

    name: IaC Validation Pipeline
    
    on:
      pull_request:
        branches:
          - main
        paths:
          - 'terraform/**'
    
    jobs:
      validate:
        name: Lint and Validate
        runs-on: ubuntu-latest
        steps:
          - name: Checkout Code
            uses: actions/checkout@v3
    
          - name: Setup Terraform
            uses: hashicorp/setup-terraform@v2
            with:
              terraform_version: 1.5.0
    
          - name: Terraform Format Check
            run: terraform fmt -check -recursive
            working-directory: ./terraform
    
          - name: Terraform Init
            run: terraform init -backend=false
            working-directory: ./terraform
    
          - name: Terraform Validate
            run: terraform validate
            working-directory: ./terraform
    
      security:
        name: Security Scan
        runs-on: ubuntu-latest
        needs: validate # Depends on the validate job
        steps:
          - name: Checkout Code
            uses: actions/checkout@v3
    
          - name: Run Checkov Scan
            uses: bridgecrewio/checkov-action@v12
            with:
              directory: ./terraform
              soft_fail: true # Log issues but don't fail the build
              output_format: cli,sarif
              output_file_path: "console,results.sarif"
    
          - name: Upload SARIF file
            uses: github/codeql-action/upload-sarif@v2
            with:
              sarif_file: results.sarif
    
      plan:
        name: Terraform Plan
        runs-on: ubuntu-latest
        needs: security # Depends on the security job
        steps:
          - name: Checkout Code
            uses: actions/checkout@v3
    
          - name: Setup Terraform
            uses: hashicorp/setup-terraform@v2
            with:
              terraform_version: 1.5.0
    
          - name: Configure AWS Credentials
            uses: aws-actions/configure-aws-credentials@v2
            with:
              aws-access-key-id: ${{ secrets.AWS_ACCESS_KEY_ID }}
              aws-secret-access-key: ${{ secrets.AWS_SECRET_ACCESS_KEY }}
              aws-region: us-east-1
    
          - name: Terraform Init
            run: terraform init
            working-directory: ./terraform
    
          - name: Terraform Plan
            run: terraform plan -no-color
            working-directory: ./terraform
    

    Key Takeaway: The soft_fail: true parameter for the Checkov action is a critical strategic choice during initial implementation. It allows security findings to be reported without blocking the pipeline, enabling a gradual rollout of policy enforcement. Once the team has addressed the initial findings, this can be set to false for high-severity issues to enforce a hard gate.

    Actionable Feedback in Pull Requests

    The final step is to deliver validation results directly to the developer within the pull request. The example workflow utilizes the github/codeql-action/upload-sarif action, which ingests the SARIF (Static Analysis Results Interchange Format) output from Checkov. GitHub automatically parses this file and displays the findings in the "Security" tab of the pull request, with annotations directly on the affected lines of code.

    This creates a seamless, low-friction feedback loop. A developer receives immediate, contextual feedback within minutes of pushing a change, empowering them to remediate issues autonomously. This transforms the security validation process from a bottleneck into a collaborative and educational mechanism, continuously improving the security posture of the infrastructure codebase.

    Detect and Remediate Configuration Drift

    Infrastructure deployment is merely the initial state. Over time, discrepancies will emerge between the infrastructure's declared state (in code) and its actual state in the cloud environment. This phenomenon, known as configuration drift, is a persistent challenge to maintaining stable and secure infrastructure.

    Drift is typically introduced through out-of-band changes, such as manual modifications made via the cloud console during an incident response or urgent security patching. While often necessary, these manual interventions break the single source of truth established by the IaC repository, introducing unknown variables and risk.

    Identifying Drift with Your Native Tooling

    The primary tool for drift detection is often the IaC tool itself. For Terraform users, the terraform plan command is a powerful drift detector. When executed against an existing infrastructure, it queries the cloud provider APIs, compares the real-world resource state with the Terraform state file, and reports any discrepancies.

    To automate this process, configure a scheduled CI/CD job to run terraform plan at regular intervals (e.g., daily or hourly for critical environments).

    The command should use the -detailed-exitcode flag for programmatic evaluation:

    terraform plan -detailed-exitcode -no-color
    

    This flag provides distinct exit codes for CI/CD logic:

    • 0: No changes detected; infrastructure is in sync with the state.
    • 1: An error occurred during execution.
    • 2: Changes detected, indicating configuration drift.

    The CI job can then use this exit code to trigger automated alerts via Slack, PagerDuty, or other notification systems, transforming drift detection from a manual audit to a proactive monitoring process.

    Advanced Drift Detection with Specialized Tools

    Native tooling can only detect drift in resources it manages. It is blind to "unmanaged" resources created outside of its purview (i.e., shadow IT).

    For comprehensive drift detection, a specialized tool like driftctl is required. It scans your entire cloud account, compares the findings against your IaC state, and categorizes resources into three buckets:

    1. Managed Resources: Resources present in both the cloud environment and the IaC state.
    2. Unmanaged Resources: Resources existing in the cloud but not defined in the IaC state.
    3. Deleted Resources: Resources defined in the IaC state but no longer present in the cloud.

    Execution is straightforward:

    driftctl scan --from tfstate://path/to/your/terraform.tfstate
    

    The output provides a clear summary of all discrepancies, enabling you to identify and either import unmanaged resources into your code or decommission them.

    The core principle here is simple yet critical: the clock starts the moment you know about a problem. Once drift is detected, you own it. Ignoring it allows inconsistencies to compound, eroding the integrity of your entire infrastructure management process.

    Strategies for Remediation

    Detecting drift necessitates a clear remediation strategy, which will vary based on organizational maturity and risk tolerance.

    There are two primary remediation models:

    • Manual Review and Reconciliation: This is the safest approach, particularly during initial adoption. Upon drift detection, the pipeline can automatically open a pull request or create a ticket detailing the changes required to bring the code back into sync. A human engineer then reviews the proposed plan, investigates the root cause of the drift, and decides whether to revert the cloud change or update the IaC to codify it.
    • Automated Rollback: For highly secure or regulated environments, the pipeline can be configured to automatically apply a plan that reverts any detected drift. This enforces a strict "code is the source of truth" policy, ensuring the live environment always reflects the repository. This approach requires an extremely high degree of confidence in the validation pipeline to prevent unintended service disruptions.

    Effective drift management completes the IaC validation lifecycle, extending checks from pre-deployment to continuous operational monitoring. This is the only way to ensure infrastructure remains consistent, predictable, and secure over its entire lifecycle.

    Frequently Asked IaC Checking Questions

    Implementing a comprehensive IaC validation strategy inevitably raises technical questions. Addressing these common challenges proactively can significantly streamline adoption and improve outcomes for DevOps and platform engineering teams.

    This section provides direct, technical answers to the most frequent queries encountered when building and scaling IaC validation workflows.

    How Do I Start Checking IaC in a Large Legacy Codebase?

    Scanning a large, mature IaC repository for the first time often yields an overwhelming number of findings. Attempting to fix all issues at once is impractical and demoralizing. The solution is a phased, incremental rollout.

    Follow this technical strategy for a manageable adoption:

    • Establish a Baseline in Audit Mode: Configure your scanning tool (e.g., Checkov or tfsec) to run in your CI pipeline with a "soft fail" or "audit-only" setting. This populates a dashboard or log with all current findings without blocking builds, providing a clear baseline of your technical debt.
    • Enforce a Single, High-Impact Policy: Begin by enforcing one critical policy for all new or modified code only. Excellent starting points include policies that detect publicly accessible S3 buckets or IAM roles with *:* permissions. This demonstrates immediate value without requiring a large-scale refactoring effort.
    • Manage Existing Findings as Tech Debt: Triage the baseline findings and create tickets in your project management system. Prioritize these tickets based on severity and address them incrementally over subsequent sprints.

    This methodical approach prevents developer friction, provides immediate security value, and makes the process of improving a legacy codebase manageable.

    Which Security Tool Is Best: Checkov, tfsec, or Terrascan?

    There is no single "best" tool; the optimal choice depends on your specific technical requirements and ecosystem.

    Each tool has distinct advantages:

    • tfsec: A high-performance scanner dedicated exclusively to Terraform. Its speed makes it ideal for local pre-commit hooks and early-stage CI jobs where rapid feedback is critical.
    • Checkov: A versatile, multi-framework scanner supporting Terraform, CloudFormation, Kubernetes, Dockerfiles, and more. Its extensive policy library and broad framework support make it an excellent choice for organizations with heterogeneous technology stacks.
    • Terrascan: Another multi-framework tool notable for its ability to map findings to specific compliance frameworks (e.g., CIS, GDPR, PCI DSS). This is a significant advantage for organizations operating in regulated industries.

    A common and effective strategy is to use Checkov for broad coverage in a primary CI/CD security stage and empower developers with tfsec locally for faster, iterative feedback.

    For maximum control and customization, the most advanced solution is to leverage Open Policy Agent (OPA) with Conftest. This allows you to write custom policies in the Rego language, enabling you to enforce any conceivable organization-specific rule, from mandatory resource tagging schemas to constraints on specific VM SKUs.

    Can I Write My Own Custom Policy Rules?

    Yes, and you absolutely should. While the default rulesets provided by scanning tools cover universal security best practices, true governance requires codifying your organization's specific architectural standards, cost-control measures, and compliance requirements.

    Most modern tools support custom policies. Checkov, for instance, allows custom checks to be written in both YAML and Python.

    This capability elevates your validation from generic security scanning to automated architectural governance. By codifying your internal engineering standards, you ensure every deployment aligns with your organization's specific technical and business objectives, enforcing consistency and best practices at scale.


    Managing a secure and compliant infrastructure requires real-world expertise and the right toolkit. At OpsMoon, we connect you with the top 0.7% of DevOps engineers who live and breathe this stuff. They can build and manage these robust validation pipelines for you. Start with a free work planning session to map out your IaC strategy.

  • How to Reduce Operational Costs: A Technical Guide

    How to Reduce Operational Costs: A Technical Guide

    Reducing operational costs requires more than budget cuts; it demands a systematic, technical approach focused on four key domains: granular process analysis, intelligent automation, infrastructure optimization, and a culture of continuous improvement. This is not a one-time initiative but an engineering discipline designed to build financial resilience by systematically eliminating operational waste.

    Your Blueprint for Slashing Operational Costs

    To decrease operational expenditure, you must move beyond generic advice and engineer a technical blueprint. The objective is to systematically identify and quantify the inefficiencies embedded in your daily workflows and technology stack.

    This guide provides an actionable framework for implementing sustainable cost reduction initiatives that deliver measurable savings. It's about transforming operational efficiency from a business buzzword into a quantifiable core function.

    The Four Pillars of Cost Reduction

    A robust cost-reduction strategy is built on a technical foundation. These four pillars represent the highest-yield opportunities for impacting your operational expenditure.

    • Process Analysis: This phase requires a deep, quantitative analysis of how work is executed. You must map business processes end-to-end using methods like value stream mapping to identify bottlenecks, redundant approval gates, and manual tasks that consume valuable compute and human cycles.
    • Intelligent Automation: After pinpointing inefficiencies, automation is the primary tool for remediation. This can range from implementing Robotic Process Automation (RPA) for deterministic data entry tasks to deploying AI/ML models for optimizing complex supply chain logistics or predictive maintenance schedules.
    • Infrastructure Optimization: Conduct a rigorous audit of your physical and digital infrastructure. Every asset—from data center hardware and office real estate to IaaS/PaaS services and SaaS licenses—is a significant cost center ripe for optimization through techniques like rightsizing, auto-scaling, and license consolidation.
    • Continuous Improvement: Cost reduction is not a static project. It demands a culture of continuous monitoring and refinement, driven by real-time data from performance dashboards and analytics platforms. This is the essence of a DevOps or Kaizen mindset applied to business operations.

    A study by Gartner revealed that organizations can slash operational costs by up to 30% by implementing hyperautomation technologies. This statistic validates the financial impact of coupling rigorous process analysis with intelligent, targeted automation.

    The following table provides a high-level schematic for this framework.

    Strategy Pillar Technical Focus Expected Outcome
    Process Analysis Value stream mapping, process mining, time-motion studies, identifying process debt. A quantitative baseline of process performance and identified waste vectors.
    Intelligent Automation Applying RPA, AI/ML, and workflow orchestration to eliminate manual, repetitive tasks. Increased throughput, reduced error rates, and quantifiable savings in FTE hours.
    Infrastructure Optimization Auditing and rightsizing cloud instances, servers, and software license utilization. Lower TCO, reduced OpEx, and improved resource allocation based on actual demand.
    Continuous Improvement Establishing KPIs, monitoring dashboards, and feedback loops for ongoing refinement. Sustainable cost savings and a more agile, resilient, and data-driven operation.

    This framework provides a structured methodology for cost reduction, ensuring you are making strategic technical improvements that strengthen the business's long-term financial health.

    As you engineer your blueprint, it's critical to understand the full technical landscape. For example, exploring the key benefits of business process automation reveals how these initiatives compound, impacting everything from data accuracy to employee productivity. Adopting this strategic, technical mindset is what distinguishes minor adjustments from transformative financial results.

    Conducting a Granular Operational Cost Audit

    Before you can reduce operational costs, you must quantify them at a granular level. A high-level P&L statement is insufficient. True optimization begins with a technical audit that deconstructs your business into its component processes, mapping every input, function, and output to its specific cost signature.

    This is not about broad categories like "Software Spend." The objective is to build a detailed cost map of your entire operation, linking specific activities and resources to their financial impact. This map will reveal the hidden inefficiencies and process debt actively draining your budget.

    Mapping End-to-End Business Processes

    First, decompose your core business processes into their constituent parts. Do not limit your analysis to departmental silos. Instead, trace a single process, like "procure-to-pay," from the initial purchase requisition in your ERP system through vendor selection, PO generation, goods receipt, invoice processing, and final payment settlement.

    By mapping this value stream, you expose friction points and quantify their cost. You might discover a convoluted approval workflow where a simple software license request requires sign-offs from four different managers, adding days of cycle time and wasted salary hours. Define metrics for each step: cycle time, touch time, and wait time. Inefficient workflows with high wait times are prime targets for re-engineering.

    This infographic illustrates the cyclical nature of cost reduction—from deep analysis to tactical execution and back to monitoring.

    Infographic about how to reduce operational costs

    This continuous loop demonstrates that managing operational expenditure is a sustained engineering discipline, not a one-off project.

    Using Technical Tools for Deeper Insights

    To achieve the required level of granularity, manual analysis is inadequate. You must leverage specialized tools to extract and correlate data from your operational systems.

    • Process Mining Software: Tools like Celonis or UIPath Process Mining programmatically analyze event logs from systems like your ERP, CRM, and ITSM. They generate visual, data-driven process maps that highlight deviations from the ideal workflow ("happy path"), pinpoint bottlenecks, and quantify the frequency of redundant steps that manual discovery would miss.
    • Time-Motion Studies: For manual processes in logistics or manufacturing, conduct formal time-motion studies to establish quantitative performance baselines. Use this data to identify opportunities for automation, ergonomic improvements, or process redesign that can yield measurable efficiency gains.
    • Resource Utilization Analysis: This is critical. Query the APIs of your cloud providers, CRM, and other SaaS platforms to extract hard utilization data. How many paid software licenses have a last-login date older than 90 days? Are your EC2 instances consistently running at 20% CPU utilization while being provisioned (and billed) for 100% capacity? Answering these questions exposes direct financial waste.

    A common finding in software asset management (SAM) audits is that 30% or more of licensed software seats are effectively "shelfware"—provisioned but unused. This represents a significant and easily correctable operational expense.

    By combining these technical methods, your audit becomes a strategic operational analysis, not just a financial accounting exercise. You are no longer asking, "What did we spend?" but rather, "Why was this resource consumed, and could we have achieved the same technical outcome with less expenditure?"

    The detailed cost map you build becomes the quantitative foundation for every targeted cost-reduction action you execute.

    Leveraging Automation for Supply Chain Savings

    Automated robotic arms working in a modern warehouse, symbolizing supply chain automation.

    The supply chain is a prime candidate for cost reduction through targeted automation. Often characterized by manual processes and disparate systems, it contains significant opportunities for applying AI and Robotic Process Automation (RPA) to logistics, procurement, and inventory management for tangible financial returns.

    This is not about personnel replacement. It is about eliminating operational friction that creates cost overhead: data entry errors on purchase orders, latency in vendor payments, or suboptimal inventory levels. Automation directly addresses these systemic inefficiencies.

    Predictive Analytics for Inventory Optimization

    Inventory carrying costs—capital, warehousing, insurance, and obsolescence—are a major operational expense. Over-provisioning ties up capital, while under-provisioning leads to stockouts and lost revenue. Predictive analytics offers a direct solution to this optimization problem.

    By training machine learning models on historical sales data, seasonality, and exogenous variables like market trends or macroeconomic indicators, AI-powered systems can forecast demand with high accuracy. This enables the implementation of a true just-in-time (JIT) inventory model, reducing carrying costs that often constitute 20-30% of total inventory value.

    A common error is relying on simple moving averages of past sales for demand forecasting. Modern predictive models utilize more sophisticated algorithms (e.g., ARIMA, LSTM networks) and ingest a wider feature set, including competitor pricing and supply chain disruptions, to generate far more accurate forecasts and minimize costly overstocking or understocking events.

    The quantitative results are compelling. Early adopters of AI-enabled supply chain management have reported a 15% reduction in logistics costs and inventory level reductions of up to 35%. You can find supporting data in recent supply chain statistics and reports.

    Automating Procurement and Vendor Management

    The procure-to-pay lifecycle is another process ripe for automation. Manual processing of purchase orders, invoices, and payments is slow and introduces a high probability of human error, leading to payment delays, strained vendor relations, and late fees.

    Here is a technical breakdown of how automated workflows mitigate these issues:

    • RPA for Purchase Orders: Configure RPA bots to monitor inventory levels in your ERP system. When stock for a specific SKU drops below a predefined threshold, the bot can automatically generate and transmit a purchase order to the approved vendor via API or email, requiring zero human intervention.
    • AI-Powered Invoice Processing: Utilize Optical Character Recognition (OCR) and Natural Language Processing (NLP) tools to automatically extract key data from incoming invoices (e.g., invoice number, amount, PO number). The system can then perform an automated three-way match against the purchase order and goods receipt record, flagging exceptions for human review and routing validated invoices directly to the accounts payable system.
    • Automated Vendor Onboarding: A workflow automation platform can orchestrate the entire vendor onboarding process, from collecting necessary documentation (W-9s, insurance certificates) via a secure portal to running compliance checks and provisioning the vendor profile in your financial system.

    Implementing these systems dramatically reduces cycle times, minimizes costly errors, and reallocates procurement specialists from administrative tasks to high-value activities like strategic sourcing and contract negotiation. To understand how this fits into a broader strategy, review our article on the benefits of workflow automation. This is about transforming procurement from a reactive cost center into a strategic, data-driven function.

    Optimizing Your Technology and Infrastructure Spend

    Technicians working in a modern data center, representing infrastructure optimization.

    Your technology stack is either a significant competitive advantage or a major source of financial leakage. Optimizing IT operational costs requires a technical, data-driven playbook that goes beyond surface-level budget reviews to re-engineer how your infrastructure operates.

    The primary target for optimization is often cloud expenditure. The elasticity of cloud platforms provides incredible agility but also facilitates overspending. Implementing rigorous cloud cost management is one of the most direct ways to impact your operational budget.

    Mastering Cloud Cost Management

    A significant portion of cloud spend is wasted on idle or over-provisioned resources. A common example is running oversized VM instances. An instance operating at 15% CPU utilization incurs the same cost as one running at 90%. Rightsizing instances to match actual workload demands is a fundamental and high-impact optimization.

    Here are specific technical actions to implement immediately:

    • Implement Reserved Instances (RIs) and Savings Plans: For predictable, steady-state workloads, leverage commitment-based pricing models like RIs or Savings Plans. These offer substantial discounts—often up to 75%—compared to on-demand pricing in exchange for a one- or three-year commitment. Use utilization data to model your baseline capacity and maximize commitment coverage.
    • Automate Shutdown Schedules: Non-production environments (development, staging, QA) rarely need to run 24/7. Use native cloud schedulers (e.g., AWS Instance Scheduler, Azure Automation) or Infrastructure as Code (IaC) scripts to automatically power down these resources outside of business hours and on weekends, immediately cutting their operational cost by over 60%.
    • Implement Storage Tiering and Lifecycle Policies: Not all data requires high-performance, high-cost storage. Automate the migration of older, less frequently accessed data from hot storage (e.g., AWS S3 Standard) to cheaper, archival tiers (e.g., S3 Glacier Deep Archive, Azure Archive Storage) using lifecycle policies.

    Shifting from a reactive "pay-the-bill" model to proactive FinOps pays significant dividends. For instance, the video platform Kaltura reduced its observability operational costs by 60% by migrating to a more efficient, managed service on AWS, demonstrating the power of architectural optimization.

    Eliminating 'Shelfware' and Optimizing Licenses

    Beyond infrastructure, software licenses are another major source of hidden costs. It is common for businesses to pay for "shelfware"—software that is licensed but completely unused. A thorough software asset management (SAM) audit is the first step to reclaiming these costs.

    This requires extracting and analyzing usage data. Query your SaaS management platform or single sign-on (SSO) provider logs (e.g., Okta, Azure AD) to identify user accounts with no login activity in the last 90 days. This empirical data provides the leverage needed to de-provision licenses and negotiate more favorable terms during enterprise agreement renewals.

    A comprehensive guide to managed cloud computing can provide the strategic context for these decisions. For a deeper technical dive, our guide on cloud computing cost reduction strategies offers more specific, actionable tactics. By integrating these strategies, you convert technology spend from a liability into a strategic, optimized asset.

    Streamlining Support Functions with Shared Services

    One of the most impactful structural changes for reducing operational costs is the centralization of support functions. Instead of maintaining siloed HR, finance, and IT teams within each business unit, these functions are consolidated into a single shared services center (SSC).

    This model is not merely about headcount reduction. It is an exercise in process engineering, creating a highly efficient, specialized hub that serves the entire organization. It eliminates redundant roles and mandates the standardization of processes, fundamentally transforming administrative functions from distributed cost centers into a unified, high-performance service delivery organization. The result is a significant reduction in G&A expenses and a marked improvement in process consistency and quality.

    The Feasibility and Standardization Phase

    The implementation begins with a detailed feasibility study. This involves mapping the as-is processes within each support function across all business units to identify variations, duplicative efforts, and ingrained inefficiencies.

    For example, your analysis might reveal that one business unit has a five-step, manually-intensive approval process for invoices, while another uses a three-step, partially automated workflow. The objective is to identify and eliminate such discrepancies.

    Once this process landscape is mapped, the next phase is standardization. The goal is to design a single, optimized "to-be" process for each core task—be it onboarding an employee, processing an expense report, or resolving a Tier 1 IT support ticket. These standardized, documented workflows form the operational bedrock of the shared services model.

    Adopting a shared services model is a strategic architectural decision, not just a cost-reduction tactic. It compels an organization to adopt a unified, process-centric operating model, which builds the foundation for scalable growth and sustained operational excellence.

    Building the Centralized Model

    With standardized processes defined, the next step is to build the operational and technical framework for the SSC. This involves several critical components.

    • Technology Platform Selection: A robust Enterprise Resource Planning (ERP) system or a dedicated service management platform (like ServiceNow) is essential. This platform becomes the central nervous system of the SSC, automating workflows, providing a single source of truth for all transactions, and enabling performance monitoring through dashboards.
    • Navigating Change Management: Centralization often faces internal resistance, as business units may be reluctant to relinquish dedicated support staff. A structured change management program is crucial, with clear communication that articulates the benefits: faster service delivery, consistent execution, and access to better data and insights.
    • Defining Service Level Agreements (SLAs): To ensure accountability and measure performance, you must establish clear, quantitative SLAs for every service provided by the SSC. These agreements define metrics like ticket resolution time, processing accuracy, and customer satisfaction, transforming the internal support function into a true service provider with measurable performance.

    The financial impact of this consolidation can be substantial. General Electric reported over $500 million in savings from centralizing its finance operations. Procter & Gamble's shared services organization generated $900 million in savings over five years. Organizations that successfully implement this model typically achieve cost reductions between 20% to 40% in the targeted functions.

    This strategy often includes consolidating external vendors. For guidance on optimizing those relationships, our technical guide on vendor management best practices can be a valuable resource. By streamlining both internal and external service delivery, you unlock a new level of operational efficiency and cost control.

    A Few Common Questions About Cutting Operational Costs

    Even with a technical blueprint, specific questions will arise during implementation. Addressing these with clear, data-driven answers is critical for turning strategy into measurable savings. Here are answers to common technical and operational hurdles.

    My objective is to provide the technical clarity required to execute your plan effectively.

    What’s the Absolute First Thing I Should Do?

    Your first action must be a comprehensive operational audit. The impulse to immediately start cutting services is a common mistake that often addresses symptoms rather than root causes. You must begin with impartial, quantitative data. This audit should involve mapping your core business processes end-to-end.

    Analyze key value streams—procurement, IT service delivery, HR onboarding—to precisely identify and quantify inefficiencies. Use process mining tools to analyze system event logs or, at a minimum, conduct detailed workflow analysis to uncover bottlenecks, redundant manual tasks, and other forms of operational waste. Without this data-driven baseline, any subsequent actions are based on conjecture.

    A classic mistake is to immediately cancel a few software subscriptions to feel productive. A proper audit might reveal the real problem is a poorly designed workflow forcing your team to use three separate tools when a single, properly integrated platform would suffice. Data prevents you from solving the wrong problem.

    How Can a Small Business Actually Apply This Stuff?

    For small businesses, the focus should be on high-impact, low-overhead solutions that are highly scalable. You do not need an enterprise-grade ERP system to achieve significant results. Leverage affordable SaaS platforms for accounting, CRM, and project management to automate core workflows.

    Here are specific, actionable starting points:

    • Leverage Public Cloud Services: Utilize platforms like AWS or Azure on a pay-as-you-go basis. This eliminates the significant capital expenditure and ongoing maintenance costs associated with on-premise servers.
    • Conduct a Software License Audit: Perform a systematic review of all monthly and annual software subscriptions. Query usage logs and de-provision any license that has not been accessed in the last 90 days.
    • Map Core Processes (Even on a Whiteboard): You do not need specialized software. Simply diagramming a key workflow, such as sales order processing, can reveal obvious redundancies and bottlenecks that can be addressed immediately.

    For a small business, the strategy is to prioritize automation and optimization that delivers the highest return on investment for the lowest initial cost and complexity.

    How Do I Actually Measure the ROI of an Automation Project?

    To accurately calculate the Return on Investment (ROI) for an automation project, you must quantify both direct and indirect savings.

    Direct savings are tangible and easy to measure. This includes reduced labor hours (calculated using the fully-loaded cost of an employee, including salary, benefits, and overhead), decommissioned software licenses, and a reduction in the cost of rework stemming from human error.

    Indirect savings, while harder to quantify, are equally important. These include improved customer satisfaction due to faster service delivery, increased innovation capacity as staff are freed from mundane tasks, and improved data accuracy. The formula remains straightforward: ROI = (Net Savings – Project Cost) / Project Cost. It is critical to establish baseline metrics before implementation and track them after to accurately measure the project's financial impact.


    Ready to optimize your DevOps and reduce infrastructure spend? The experts at OpsMoon provide top-tier remote engineers to manage your Kubernetes, Terraform, and CI/CD pipelines. Start with a free work planning session to build a clear roadmap for cost-effective, scalable operations. Learn more and book your free consultation at opsmoon.com.