Integrating CI/CD with Kubernetes is a transformative step for software delivery. By automating the build, test, and deployment of containerized applications on an orchestrated platform, you establish a resilient, scalable, and reproducible process. This combination definitively solves legacy pipeline constraints and eliminates the "it works on my machine" anti-pattern.
Why Kubernetes Is Essential for Modern CI/CD
Legacy CI/CD systems often relied on a fleet of dedicated, static build servers. This architecture was a breeding ground for systemic issues: resource contention during concurrent builds, prolonged queue times, and environment drift between development, testing, and production. A single build server failure could halt all development velocity. Scaling this model was a manual, error-prone, and expensive task.
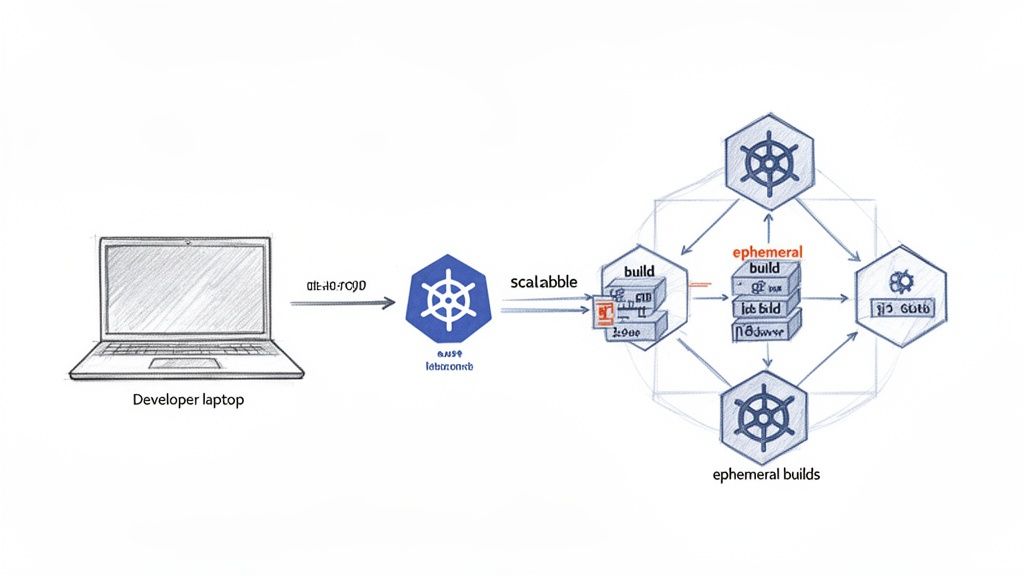
Kubernetes fundamentally changes this paradigm. Instead of fixed infrastructure, you have a dynamic, API-driven platform for orchestrating containers. This allows your CI/CD system to provision clean, isolated, and fully configured build environments on-demand for every pipeline execution. We call these ephemeral build agents.
The workflow is straightforward: a developer pushes code, triggering a pipeline that instantly schedules a Kubernetes Pod. This Pod contains all necessary build tools, compilers, and dependencies defined in its container spec. It executes the build and test stages in a pristine environment. Upon completion, the Pod is terminated, and its resources are reclaimed by the cluster, ready for the next job.
Solving Legacy Pipeline Bottlenecks
This on-demand model eradicates scalability bottlenecks. As development activity peaks, Kubernetes can automatically scale the number of build agent Pods via the Cluster Autoscaler to meet demand. During lulls, it scales them back down, optimizing resource utilization and cost. Achieving this level of elasticity with traditional CI/CD required significant bespoke engineering effort.
Crucially, Kubernetes enforces environmental consistency. Build environments are defined declaratively as container images (e.g., Dockerfiles), guaranteeing that every pipeline executes in an identical context. This consistency extends from CI all the way to production. The exact same container image artifact that passes all tests is the one promoted through environments, achieving true build-to-runtime parity.
The core strength of Kubernetes lies in its declarative model. You shift from writing imperative scripts that specify how to deploy an application to creating manifest files (e.g., YAML) that declare the desired state. Kubernetes' control loop continuously works to reconcile the cluster's current state with your desired state. This is the foundation of modern, reliable automation.
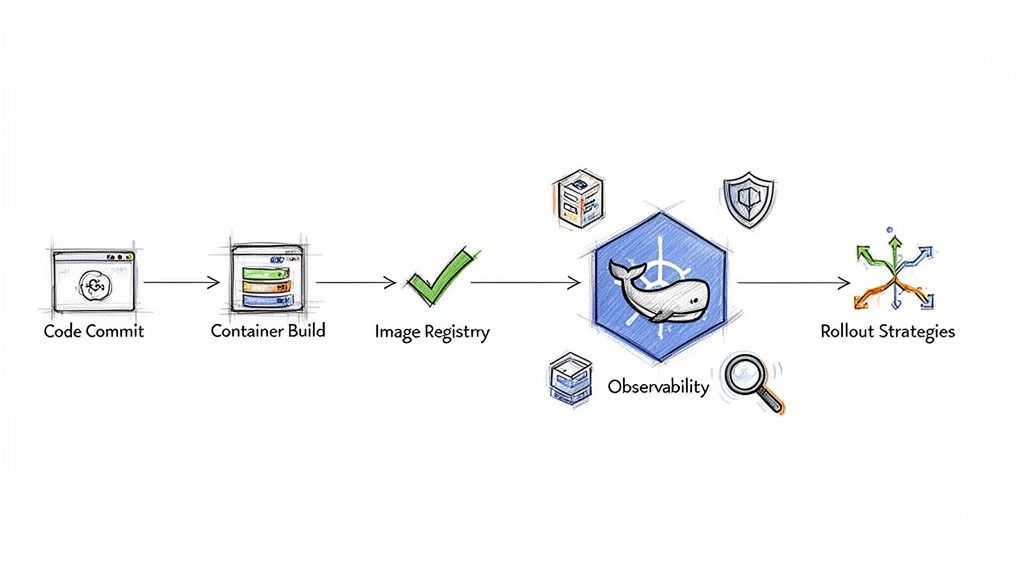
The entire process, from a git push to a container-native deployment, becomes a seamless, automated flow orchestrated by Kubernetes.
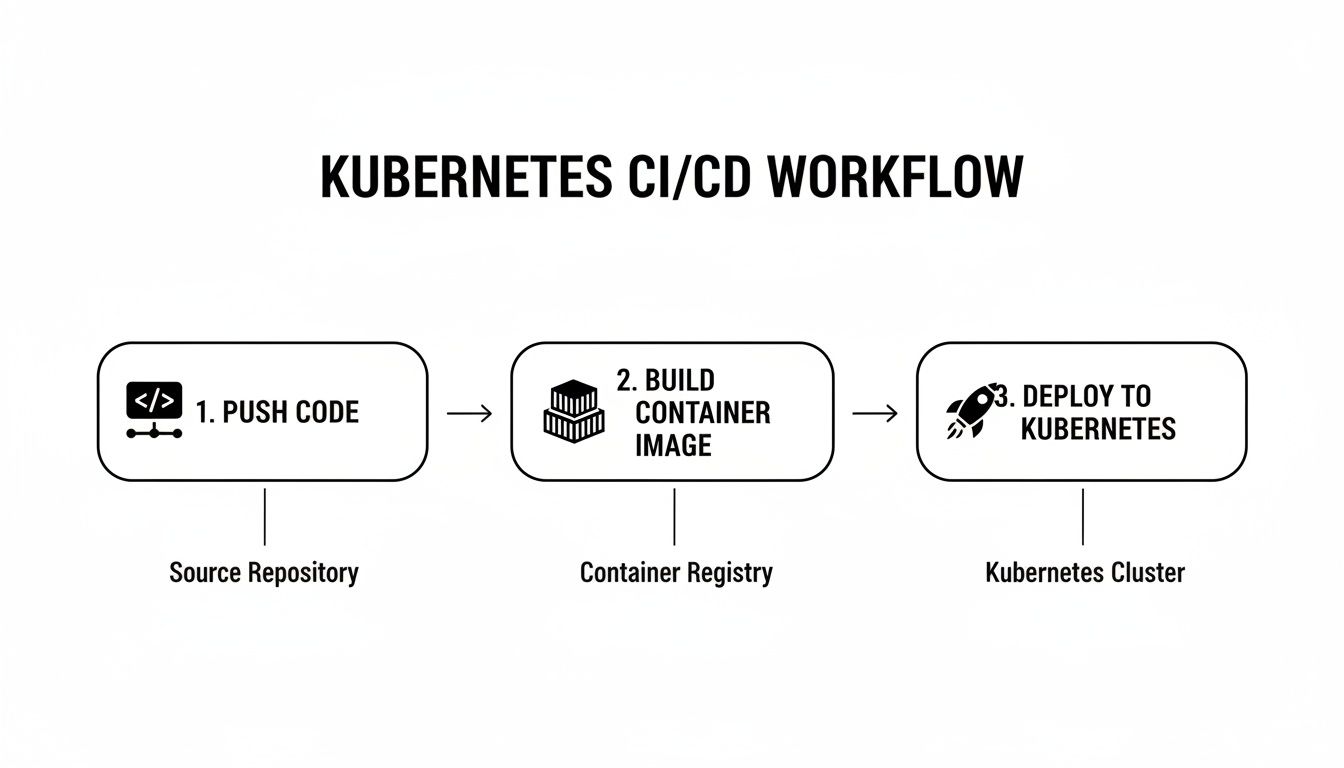
This workflow demonstrates how a single Git commit can trigger a chain of automated, container-native actions, all managed by the orchestrator.
To understand how these components interact, let's dissect the core stages of a typical pipeline.
Core Components of a Kubernetes CI/CD Pipeline
| Pipeline Stage | Core Purpose | Common Tools |
|---|---|---|
| Source Code Management | Triggering the pipeline on code changes (e.g., git push or merge). |
GitLab, GitHub, Bitbucket |
| Continuous Integration (CI) | Building, testing, and validating the application code automatically. | Jenkins, GitLab CI, CircleCI |
| Image Build & Scan | Packaging the application into a container image and scanning for vulnerabilities. | Docker, Kaniko, Trivy, Snyk |
| Image Registry | Storing and versioning the built container images. | Docker Hub, ECR, GCR, Harbor |
| Continuous Deployment (CD) | Automatically deploying the new container image to Kubernetes clusters. | Argo CD, Flux, Spinnaker |
Each stage represents a critical, automated step in moving source code from a developer's local environment to a running production service.
The Rise of GitOps and Declarative Workflows
The adoption of Kubernetes has been massive. A recent CNCF survey revealed that a staggering 96% of organizations are either using or evaluating Kubernetes, largely because of how well it integrates with CI/CD. If you want to dive deeper, you can discover more about these Kubernetes trends and their impact. This shift has also brought GitOps into the spotlight, an operational model where Git is the single source of truth for both your application and your infrastructure.
A typical GitOps workflow functions as follows:
- A developer pushes new application code to a source repository.
- The CI pipeline triggers, automatically building, testing, and pushing a new, uniquely tagged container image to a registry.
- The pipeline's final step is to update a Kubernetes manifest (e.g., a Deployment YAML) in a separate configuration repository with the new image tag.
- A GitOps agent running inside the Kubernetes cluster (like Argo CD or Flux) detects the commit in the configuration repository and automatically pulls and applies the change, reconciling the cluster state.
This "pull-based" deployment model enhances security and auditability, creating a fully declarative and auditable trail from a line of code to a running production service.
Architecting Your Kubernetes CI/CD Pipeline
Before writing any pipeline code, a critical architectural decision must be made: how will application artifacts be deployed to your Kubernetes cluster? This choice determines your entire workflow and security posture.
You are choosing between two fundamental models: the traditional push-based model and the modern, declarative pull-based GitOps approach. Selecting the right one will define how you manage deployments, handle credentials, and scale your operations.
The push-based model is common in legacy systems. A central CI server, such as Jenkins or GitLab CI, is granted direct credentials to the Kubernetes API server. After a successful build, the CI server executes commands like kubectl apply or helm upgrade to push the new version into the cluster.
This model is simple to conceptualize but presents significant security and operational risks. Granting a CI server administrative privileges on a Kubernetes cluster creates a large attack surface. A compromise of the CI system could lead to a full compromise of the production environment.
The GitOps Pull-Based Model
GitOps inverts this model entirely.
Instead of an external CI server pushing changes, an agent running inside the cluster—such as ArgoCD or Flux—continuously pulls the desired state from a designated Git repository. This Git repository becomes the single source of truth for all declarative configuration running in the cluster. The CI pipeline's sole deployment-related responsibility is to update a manifest in this repository.
This pull architecture offers several advantages:
- Enhanced Security: The in-cluster agent requires only read-access to the Git repository and the necessary RBAC permissions to manage resources within its target namespaces. The CI server never needs cluster credentials.
- Complete Auditability: Every change to the infrastructure is a Git commit, providing an immutable, auditable log of who changed what, when, and why.
- Simplified Rollbacks: A faulty deployment can be reverted by executing a
git revertcommand on the problematic commit. The GitOps agent will detect the change and automatically synchronize the cluster back to the previous known-good state. - Drift Detection and Reconciliation: The agent constantly compares the live state of the cluster with the state defined in Git. If it detects any manual, out-of-band changes (configuration drift), it can automatically correct them or alert an operator.
GitOps transitions your operational mindset from imperative commands to declarative state management. You stop telling the system what to do (
kubectl run...) and start describing what you want (kind: Deployment...). This is the key to building a scalable, self-healing, and fully auditable delivery platform.
Choosing Your Architectural Path
The choice between push and pull models depends on your team's maturity, security requirements, and operational goals.
- Push-Based (e.g., Jenkins): A viable starting point, especially for teams with existing investments in imperative CI tools. It is faster to implement initially but requires rigorous management of secrets and RBAC permissions to mitigate security risks.
- Pull-Based (e.g., ArgoCD): The recommended and more secure approach for teams prioritizing security, auditability, and a scalable, declarative workflow. It requires more upfront design of Git repository structures but yields significant long-term operational benefits.
A Practical Push-Based Example
This Jenkinsfile snippet demonstrates a typical container build-and-push stage using Kaniko. Note how the CI server is actively executing commands and pushing the final artifact, a hallmark of the push model.
pipeline {
    agent {
        kubernetes {
            yaml '''
apiVersion: v1
kind: Pod
spec:
  containers:
  - name: kaniko
    image: gcr.io/kaniko-project/executor:debug
    imagePullPolicy: Always
    command:
    - /busybox/cat
    tty: true
    volumeMounts:
    - name: jenkins-docker-cfg
      mountPath: /kaniko/.docker
  volumes:
  - name: jenkins-docker-cfg
    projected:
      sources:
      - secret:
          name: regcred
          items:
            - key: .dockerconfigjson
              path: config.json
'''
        }
    }
    stages {
        stage('Build and Push') {
            steps {
                container('kaniko') {
                    sh '''
                    /kaniko/executor --context `pwd` --destination=your-registry/your-app:$GIT_COMMIT --cache=true
                    '''
                }
            }
        }
    }
}
A Declarative GitOps Example
In contrast, this ArgoCD ApplicationSet manifest is purely declarative. It instructs ArgoCD to automatically discover and deploy any new service defined as a subdirectory within a specific Git repository path. The CI pipeline's only task is to add a new folder with Kubernetes manifests to the apps/ directory. ArgoCD manages the entire reconciliation loop.
apiVersion: argoproj.io/v1alpha1
kind: ApplicationSet
metadata:
  name: my-app-generator
spec:
  generators:
  - git:
      repoURL: https://github.com/your-org/config-repo.git
      revision: HEAD
      directories:
      - path: apps/*
  template:
    metadata:
      name: '{{path.basename}}'
    spec:
      project: default
      source:
        repoURL: https://github.com/your-org/config-repo.git
        targetRevision: HEAD
        path: '{{path}}'
      destination:
        server: https://kubernetes.default.svc
        namespace: '{{path.basename}}'
      syncPolicy:
        automated:
          prune: true
          selfHeal: true
This separation of concerns—CI for building artifacts, GitOps for deploying state—is the foundation of a modern, secure, and scalable Kubernetes CI/CD architecture.
Building a Container-Native CI Workflow
A robust cicd with kubernetes pipeline begins with a Continuous Integration (CI) workflow designed to execute within the cluster itself. This represents a significant departure from static build servers, leveraging container-native runners that provision clean, isolated environments for each commit.
The principle is simple yet powerful: upon a code push, the CI system dynamically schedules a Kubernetes Pod purpose-built for that job. This Pod acts as a self-contained build environment, containing specific versions of compilers, libraries, and testing frameworks. After the job completes, the Pod is terminated. This ensures every build runs in a fresh, predictable, and reproducible environment.
From Code to Container Image
The primary function of the CI stage is to transform source code into a secure, versioned, and deployable container image. This involves a series of automated steps designed to validate code quality and produce a reliable artifact.
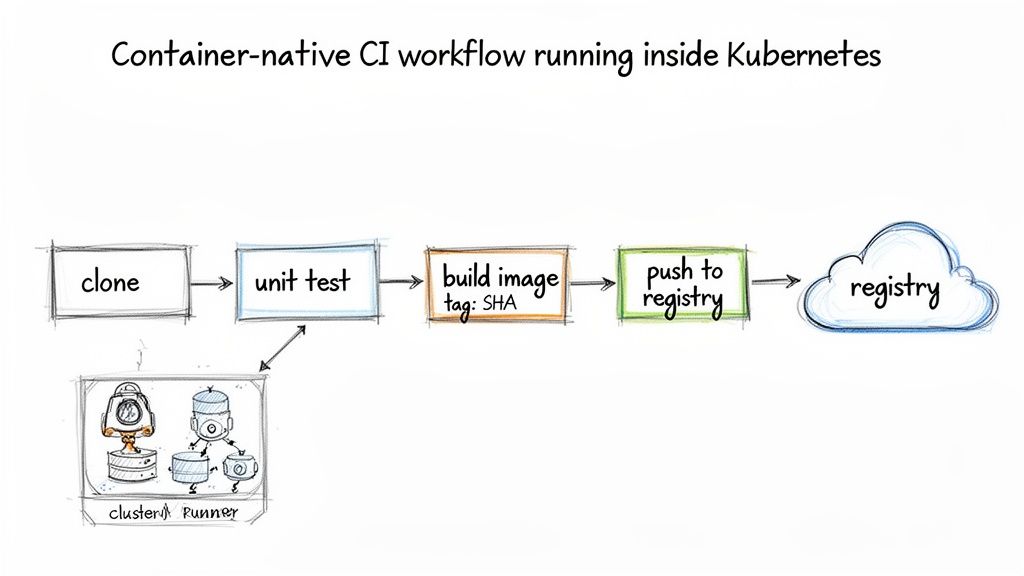
A typical container-native CI workflow includes these phases:
- Checkout Code: The pipeline fetches the specific Git commit that triggered the execution.
- Run Unit Tests: The application's core logic is validated via a comprehensive test suite running within a container. This is the first validation gate.
- Build & Tag Image: A container image is built from a Dockerfile. The best practice is to tag the image with the unique Git commit SHA, creating an immutable and traceable link between the source code and the resulting artifact.
- Push to Registry: The newly built image is pushed to a container registry such as Amazon ECR, Docker Hub, or Google Container Registry, making it available for subsequent deployment stages.
While automation is key, it should be complemented by rigorous human processes. To ensure high code quality, follow established best practices for code review. Peer review can identify logical errors, architectural issues, and design flaws that automated tests may miss.
An Example GitHub Actions Workflow
This is a complete GitHub Actions workflow that builds a Go application, runs unit tests, and pushes the final container image to Amazon ECR using OIDC for secure, short-lived credentials.
name: CI for Go Application

on:
  push:
    branches: [ "main" ]

jobs:
  build-and-push:
    runs-on: ubuntu-latest
    permissions:
      id-token: write
      contents: read
    steps:
      - name: Checkout repository
        uses: actions/checkout@v3

      - name: Configure AWS Credentials
        uses: aws-actions/configure-aws-credentials@v2
        with:
          role-to-assume: arn:aws:iam::123456789012:role/GitHubActionRole
          aws-region: us-east-1

      - name: Login to Amazon ECR
        id: login-ecr
        uses: aws-actions/amazon-ecr-login@v1

      - name: Set up Go
        uses: actions/setup-go@v4
        with:
          go-version: '1.21'

      - name: Run Unit Tests
        run: go test -v ./...

      - name: Build and push Docker image
        env:
          ECR_REGISTRY: ${{ steps.login-ecr.outputs.registry }}
          ECR_REPOSITORY: my-go-app
          IMAGE_TAG: ${{ github.sha }}
        run: |
          docker build -t $ECR_REGISTRY/$ECR_REPOSITORY:$IMAGE_TAG .
          docker push $ECR_REGISTRY/$ECR_REPOSITORY:$IMAGE_TAG
This workflow automates the entire process, from secure AWS authentication to tagging the image with the precise commit SHA that generated it.
Optimizing Your CI Pipeline
Pipeline execution speed is critical for developer productivity. Two of the most effective optimization techniques are build caching and multi-stage builds.
Build caching dramatically accelerates pipeline execution by reusing unchanged layers from previous builds. Instead of rebuilding the entire image from scratch, the build tool only processes layers affected by code changes, often reducing build times by over 50%.
Similarly, multi-stage builds are essential for creating lean, secure production images. This technique involves using a builder stage with a full build-time environment to compile the application, followed by a final, minimal stage that copies only the compiled binary and necessary runtime dependencies.
For a detailed walkthrough, see our guide on implementing an effective Docker multi-stage build. This approach removes compilers, SDKs, and build tools from the final image, significantly reducing its size and attack surface.
Getting Continuous Deployment Right With GitOps
With a reliable CI pipeline producing versioned container images, the next objective is to automate their deployment to your Kubernetes cluster. This is where GitOps provides a robust and declarative framework.
GitOps establishes your Git repository as the single source of truth for the desired state of your applications in the cluster. This eliminates manual kubectl apply commands and the security risk of granting CI servers direct cluster access.
At its core, GitOps employs a "pull-based" model. An agent, such as ArgoCD or Flux, runs inside your cluster and continuously monitors a designated Git repository containing your Kubernetes manifests. When it detects a change—such as a new image tag committed by your CI pipeline—it pulls the configuration and reconciles the cluster's state to match. This is the foundation of a secure and auditable cicd with kubernetes system.
Getting Started with ArgoCD for Continuous Sync
ArgoCD is a popular, feature-rich GitOps tool. After installation in your cluster, you configure it to track a Git repository containing your Kubernetes manifests. Best practice dictates using a separate repository for this configuration, distinct from your application source code.
To link a repository to a deployment, you define an Application custom resource. This manifest provides ArgoCD with three key pieces of information:
- Source: The Git repository URL, target branch/tag, and path to the manifests.
- Destination: The target Kubernetes cluster and namespace where the application should be deployed.
- Sync Policy: Defines how ArgoCD applies changes. An automated policy with
selfHeal: trueis highly recommended. This configures ArgoCD to automatically apply new commits and correct any manual configuration drift detected in the cluster.
With this configuration, your entire deployment workflow is driven by Git commits. To release a new version, your CI pipeline's final step is to commit a change to an image tag in a deployment manifest. ArgoCD handles the rest.
How to Structure Your Git Repo for Multiple Environments
A common and effective pattern for managing multiple environments (e.g., dev, staging, production) is to use Kustomize overlays. This approach promotes DRY (Don't Repeat Yourself) configurations by defining a common base set of manifests and applying environment-specific overlays to patch them.
A typical repository structure would be:
├── base/
│   ├── deployment.yaml
│   ├── service.yaml
│   └── kustomization.yaml
├── overlays/
    ├── dev/
    │   ├── patch-replicas.yaml
    │   └── kustomization.yaml
    └── production/
        ├── patch-replicas.yaml
        ├── patch-resources.yaml
        └── kustomization.yaml
The base directory contains standard, environment-agnostic manifests. The overlays directories contain patches that modify the base. For example, overlays/dev/patch-replicas.yaml might scale the deployment to 1 replica, while the production patch scales it to 5 and applies stricter CPU and memory resource limits.
For a deeper dive into repository structure, refer to our guide on GitOps best practices.
When choosing a tool to manage your manifests, several excellent options are available.
Deployment Manifest Management Tools Compared
| Tool | Best For | Key Strengths | Considerations |
|---|---|---|---|
| Helm | Teams that need a full-featured package manager for distributing and managing complex, third-party applications. | Templating, versioning, dependency management, and a vast ecosystem of public charts. | Can introduce a layer of abstraction that makes manifests harder to debug. Templating logic can get complex. |
| Kustomize | Teams looking for a declarative, template-free way to customize manifests for different environments. | Simple, patch-based approach. Native to kubectl. Great for keeping configs DRY without complex logic. |
Less suited for packaging and distributing software. Doesn't handle complex application dependencies. |
| Plain YAML | Simple applications or teams just starting out who want maximum clarity and control. | Easy to read and write. No extra tools or learning curve. What you see is exactly what gets applied. | Becomes very difficult to manage at scale. Prone to copy-paste errors and configuration drift between environments. |
Regardless of your choice, standardizing on a single manifest management strategy within your GitOps repository is crucial for maintaining consistency and clarity.
Keeping Secrets Out of Git—The Right Way
Committing plaintext secrets (API keys, database passwords) to a Git repository is a critical security vulnerability and must be avoided. Several tools integrate seamlessly with the GitOps model to manage secrets securely.
Two highly effective approaches are:
-
Sealed Secrets: This solution from Bitnami uses a controller in your cluster with a public/private key pair. You use a CLI tool (
kubeseal) to encrypt a standard KubernetesSecretmanifest using the controller's public key. This generates aSealedSecretcustom resource, which is safe to commit to Git. Only the controller, with its private key, can decrypt the data and create the actualSecretinside the cluster. -
HashiCorp Vault Integration: For more advanced secrets management, integrating with a system like HashiCorp Vault is the recommended path. Kubernetes operators like the Vault Secrets Operator or External Secrets Operator allow your pods to securely fetch secrets directly from Vault at runtime. Your Git repository stores only references to the secret paths in Vault, never the secrets themselves.
By integrating a dedicated secrets management solution, you address one of the most common security gaps in CI/CD. Your Git repository can declaratively define the entire application state—including its dependency on specific secrets—without ever exposing a single credential. This is an essential practice for a production-grade GitOps workflow.
Integrating Security and Observability
Deployment velocity is a liability without robust security and observability. A CI/CD pipeline that rapidly ships vulnerable or unmonitored code is an operational risk. Security and observability must be integrated into your cicd with kubernetes workflow from the outset, not added as an afterthought.
This practice is often termed DevSecOps, a cultural shift where security is a shared responsibility throughout the entire software development lifecycle. The objective is to "shift left," identifying and remediating vulnerabilities early in the development process rather than during a late-stage audit.
The market reflects this priority. The DevSecOps sector is projected to grow from $3.73 billion in 2021 to $41.66 billion by 2030. However, challenges remain. A recent survey highlighted that 72% of organizations view security as a significant hurdle in cloud-native CI/CD adoption, with 51% citing similar concerns for observability.
Shifting Security Left in Your CI Pipeline
The CI pipeline is the ideal place to begin integrating security. Before a container image is pushed to a registry, it must be scanned for known vulnerabilities. This step acts as a critical quality gate, preventing insecure code from reaching your artifact repository or production clusters.
An excellent open-source tool for this is Trivy. You can easily integrate a Trivy scan into any CI workflow. The key is to configure the pipeline to fail if vulnerabilities exceeding a defined severity threshold (e.g., CRITICAL or HIGH) are detected.
Here is an example of a Trivy scan step in a GitHub Actions workflow:
- name: Scan image for vulnerabilities
  uses: aquasecurity/trivy-action@master
  with:
    image-ref: 'your-registry/your-app:${{ github.sha }}'
    format: 'table'
    exit-code: '1'
    ignore-unfixed: true
    vuln-type: 'os,library'
    severity: 'CRITICAL,HIGH'
This configuration instructs the pipeline to scan the image and fail the build if any high or critical vulnerabilities are discovered, effectively blocking the insecure artifact.
Pro Tip: Do not stop at image scanning. Integrate static analysis security testing (SAST) tools like SonarQube to identify security flaws in your source code. Additionally, use infrastructure-as-code (IaC) scanners like
checkovto validate your Kubernetes manifests for security misconfigurations before they are committed.
Enforcing Security at the Kubernetes Level
Security must extend beyond the CI pipeline into your Kubernetes manifests. These resources define the runtime security posture of your application, limiting the potential blast radius in the event of a compromise.
Before implementing controls, it is wise to start by performing a thorough cybersecurity risk assessment to identify vulnerabilities in your existing architecture. With that data, you can enforce security using key Kubernetes resources.
- Security Context: This manifest section defines privilege and access controls for a Pod or Container. At minimum, you must configure
runAsUserto a non-zero value and setallowPrivilegeEscalationtofalse. - Network Policies: By default, all Pods in a Kubernetes cluster can communicate with each other. Network Policies act as a firewall for Pods, allowing you to define explicit ingress and egress traffic rules based on labels.
- Role-Based Access Control (RBAC): Ensure the ServiceAccount used by your application Pod is granted the absolute minimum permissions required for its function (the principle of least privilege). A deep dive into these practices is available in our article on DevOps security best practices.
Building Observability into Your Deployments
You cannot secure or operate what you cannot see. Observability—metrics, logs, and traces—provides insight into the real-time health and performance of your system. In the Kubernetes ecosystem, Prometheus is the de facto standard for metrics collection.
The first step is to instrument your application code. Most modern languages provide Prometheus client libraries to expose custom application metrics (e.g., active users, transaction latency) via a standard HTTP endpoint, typically /metrics.
Once your application exposes metrics, you must configure Prometheus to scrape them. The Kubernetes-native method for this is the Prometheus Operator, which introduces the ServiceMonitor custom resource. This allows you to define scrape configurations declaratively.
By applying a ServiceMonitor that targets your application's Service via a label selector, you instruct the Prometheus Operator to automatically generate and manage the necessary scrape configurations. This is a powerful pattern. Developers can enable monitoring for a new service simply by including a ServiceMonitor manifest in their GitOps repository, making observability a standard, automated component of every deployment.
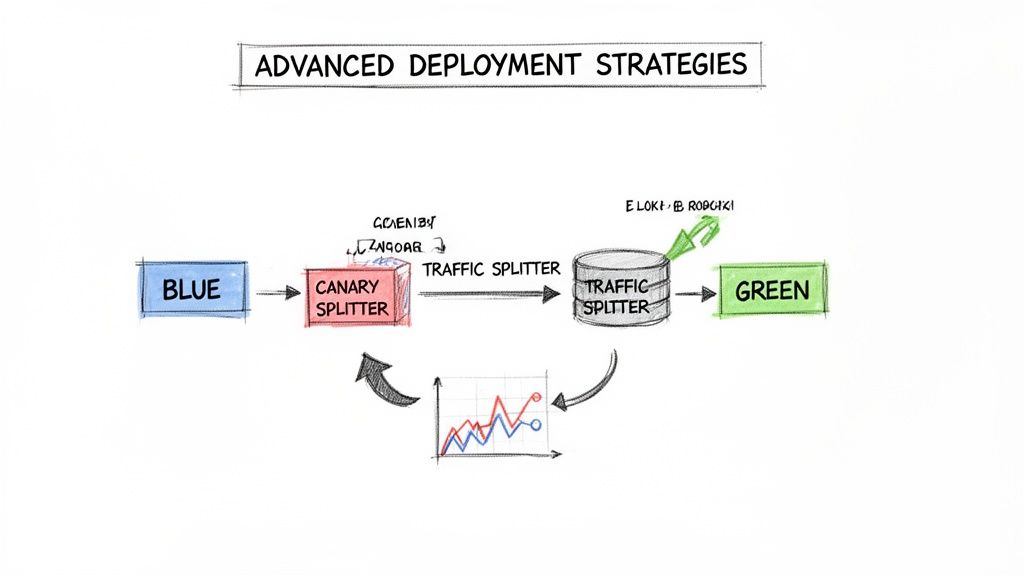
Putting Advanced Deployment Strategies into Play
Establishing a CI pipeline and a GitOps workflow is a major achievement. The next step is to evolve from basic, all-or-nothing deployments to more sophisticated release strategies that minimize risk and downtime.
This enables zero-downtime releases and prevents a faulty deployment from impacting the user experience. For this, we need specialized tools built for Kubernetes, like Argo Rollouts.
Argo Rollouts is a Kubernetes controller that replaces the standard Deployment object with a more powerful Rollout custom resource. This single change unlocks advanced deployment strategies like Canary and Blue/Green releases directly within Kubernetes, providing fine-grained control over the release process.
Rolling Out a Canary Deployment with Argo
A Canary release is a technique for incrementally rolling out a new version. Instead of directing all traffic to the new version simultaneously, you start by routing a small percentage of production traffic—for example, 5%—to the new application pods.
You then observe key performance indicators (KPIs) like error rates and latency. If the new version is stable, you gradually increase the traffic percentage until 100% of users are on the new version.
The combination of Argo Rollouts with a service mesh like Istio or Linkerd provides precise traffic shaping capabilities. The Rollout resource configures the service mesh to split traffic accurately, while its analysis features can automatically query a monitoring system like Prometheus to validate the health of the new release.
Here is an example of a Rollout manifest for a Canary strategy:
apiVersion: argoproj.io/v1alpha1
kind: Rollout
metadata:
  name: my-app-rollout
spec:
  replicas: 5
  strategy:
    canary:
      steps:
      - setWeight: 10
      - pause: { duration: 5m }
      - setWeight: 25
      - pause: { duration: 10m }
      - analysis:
          templates:
          - templateName: check-error-rate
          args:
          - name: service-name
            value: my-app-service
      - setWeight: 50
      - pause: { duration: 10m }
  selector:
    matchLabels:
      app: my-app
  template:
    metadata:
      labels:
        app: my-app
    spec:
      containers:
      - name: my-app
        image: your-registry/my-app:new-version
        ports:
        - containerPort: 8080
This Rollout object executes the release in controlled stages with built-in pauses. The critical step is the automated analysis that runs after reaching 25% traffic.
Let the Metrics Drive Your Promotions
The analysis step transforms a Canary release from a manual, high-stress process into an automated, data-driven workflow. It allows the Rollout controller to query a monitoring system and make an objective decision about whether to proceed or abort the release.
The analysis logic is defined in an AnalysisTemplate. For instance, you can configure it to monitor the HTTP 5xx error rate of the new canary version.
apiVersion: argoproj.io/v1alpha1
kind: AnalysisTemplate
metadata:
  name: check-error-rate
spec:
  args:
  - name: service-name
  metrics:
  - name: error-rate
    interval: 1m
    count: 3
    successCondition: result[0] <= 0.01
    failureLimit: 1
    provider:
      prometheus:
        address: http://prometheus.example.com:9090
        query: |
          sum(rate(http_requests_total{job="{{args.service-name}}",code=~"5.*"}[1m]))
          /
          sum(rate(http_requests_total{job="{{args.service-name}}"}[1m]))
This template queries Prometheus for the 5xx error rate. If the rate remains at or below 1% for three consecutive minutes, the analysis succeeds, and the rollout continues. If the threshold is breached, the analysis fails.
The primary benefit here is the automated safety net. If a Canary deployment fails its analysis, Argo Rollouts automatically triggers a rollback to the previous stable version. This occurs instantly, without human intervention, ensuring a faulty release has minimal impact on users.
This automated validation and rollback capability is what enables rapid, confident releases in a cicd with kubernetes environment. You are no longer reliant on manual observation. The system becomes self-healing, promoting releases only when data verifies their stability. This frees up engineers to focus on feature development, confident that the deployment process is safe and reliable.
Got Questions? We've Got Answers
As you implement a cicd with kubernetes system, several common technical challenges arise. Let's address some of the most frequent questions from engineering teams.
How Do You Handle Database Schema Migrations?
A mismatch between your application version and database schema can cause a critical outage. The most robust pattern is to execute schema migrations as a Kubernetes Job, triggered by a pre-install or pre-upgrade Helm hook.
This approach ensures the migration completes successfully before the new application version begins to receive traffic. If the database migration Job fails, the entire deployment is halted, preventing the application from starting with an incompatible schema. This synchronous check maintains consistency and service availability.
What's the Real Difference Between ArgoCD and Flux?
Both are leading GitOps tools, but they differ in their architecture and user experience.
- Argo CD is an integrated, opinionated platform. It provides a comprehensive UI, robust multi-cluster management from a single control plane, and an intuitive
ApplicationCRD that simplifies onboarding for teams. - Flux is a composable, modular toolkit. It consists of a set of specialized controllers (e.g., source-controller, helm-controller, kustomize-controller) that you assemble to create a custom workflow. This offers high flexibility but may require more initial configuration.
The choice depends on whether you prefer an all-in-one solution or a highly modular, build-your-own toolkit.
Ultimately, both tools adhere to the core GitOps principle: Git is the single source of truth. An in-cluster operator continuously reconciles the live state with the desired state defined in your repository.
Can I Pair Jenkins for CI with ArgoCD for CD?
Absolutely. This is a very common and highly effective architecture that leverages the strengths of each tool, creating a clear separation of concerns.
The workflow is as follows:
- Jenkins (CI): Acts as the build engine. It checks out source code, runs unit tests and security scans, and builds a new container image upon success.
- The Handoff: Jenkins pushes the new image to a container registry. Its final step is to commit a change to a manifest file in your GitOps configuration repository, updating the image tag to the new version.
- ArgoCD (CD): Continuously monitors the GitOps repository. Upon detecting the new commit from Jenkins, it automatically initiates the deployment process, syncing the new version into the Kubernetes cluster.
This workflow cleanly separates the "build" (CI) and "deploy" (CD) processes, resulting in a powerful and auditable automated pipeline.
Ready to build a robust CI/CD pipeline without getting lost in the complexity? The experts at OpsMoon specialize in designing and implementing Kubernetes-native automation that accelerates your releases. Start with a free work planning session to map out your DevOps roadmap.
Leave a Reply