Pairing microservices with Kubernetes is the standard for building modern, scalable applications. This combination enables development teams to build and deploy independent services with high velocity, while Kubernetes provides the robust orchestration layer to manage the inherent complexity of a distributed system.
In short, it’s how you achieve both development speed and operational stability.
Why Microservices and Kubernetes Are a Powerful Combination
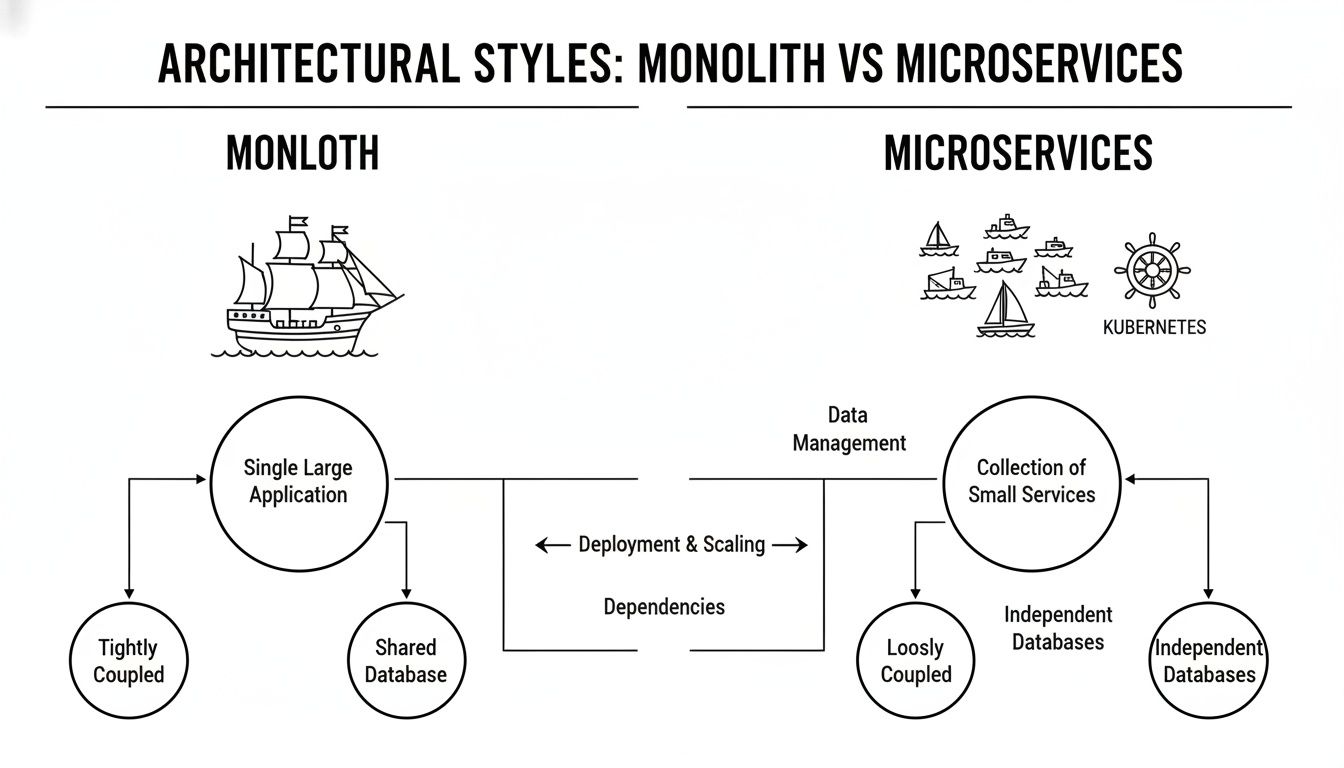
To understand the technical synergy, consider the architectural shift. A monolithic application is a single, tightly-coupled binary. All its components share the same process, memory, and release cycle. A failure in one module can cascade and bring down the entire application.
Moving to microservices decomposes this monolith into a suite of small, independently deployable services. Each service encapsulates a specific business capability (e.g., authentication, payments, user profiles), runs in its own process, and communicates over well-defined APIs, typically HTTP/gRPC. This grants immense architectural agility.
The Orchestration Challenge
However, managing a distributed system introduces significant operational challenges: service discovery, network routing, fault tolerance, and configuration management. Manually scripting solutions for these problems is brittle and doesn't scale. This is precisely the problem domain Kubernetes is designed to solve.
Kubernetes acts as the distributed system's operating system. It provides declarative APIs to manage the lifecycle of containerized microservices, abstracting away the underlying infrastructure.
Kubernetes doesn't just manage containers; it orchestrates the complex interplay between microservices. It transforms a potentially chaotic fleet of services into a coordinated, resilient, and scalable application through a declarative control plane.
Kubernetes as the Orchestration Solution
Kubernetes automates the undifferentiated heavy lifting of running a distributed system. Data shows 74% of organizations have adopted microservices, with some reporting up to 10x faster deployment cycles when leveraging Kubernetes, as detailed in this breakdown of microservice statistics.
Here’s how Kubernetes provides a technical solution:
- Automated Service Discovery: It assigns each Service object a stable internal DNS name (
service-name.namespace.svc.cluster.local). This allows services to discover and communicate with each other via a stable endpoint, abstracting away ephemeral pod IPs. - Intelligent Load Balancing: Kubernetes
Serviceobjects automatically load balance network traffic across all healthy Pods matching a label selector. This ensures traffic is distributed evenly without a single Pod becoming a bottleneck. - Self-Healing Capabilities: Through
ReplicaSetcontrollers and health checks (liveness and readiness probes), Kubernetes automatically detects and replaces unhealthy or failed Pods. This ensures high availability without manual intervention.
To grasp the technical leap forward, a direct comparison is essential.
Comparing Monolithic and Microservices Architectures
| Attribute | Monolithic Architecture | Microservices Architecture with Kubernetes |
|---|---|---|
| Structure | Single, large codebase compiled into one binary | Multiple, small, independent services, each in a container |
| Deployment | All-or-nothing deployments of the entire application | Independent service deployments via kubectl apply or CI/CD |
| Scaling | Scale the entire application monolith (vertical or horizontal) | Scale individual services with Horizontal Pod Autoscaler (HPA) |
| Fault Isolation | A single uncaught exception can crash the entire application | Failures are isolated to a single service; others remain operational |
| Management | Simple operational model (one process) | Complex distributed system managed via Kubernetes API |
The agility of microservices, powered by the declarative orchestration of Kubernetes, has become the de facto standard for building resilient, cloud-native applications.
For a deeper analysis, our guide on microservices vs monolithic architecture explores these concepts with more technical depth.
Essential Architectural Patterns for Production Systems
Deploying microservices on Kubernetes requires more than just containerizing your code. Production-readiness demands architecting a system that can handle the complexities of distributed communication, configuration, and state management.
Design patterns provide battle-tested, reusable solutions to these common problems.
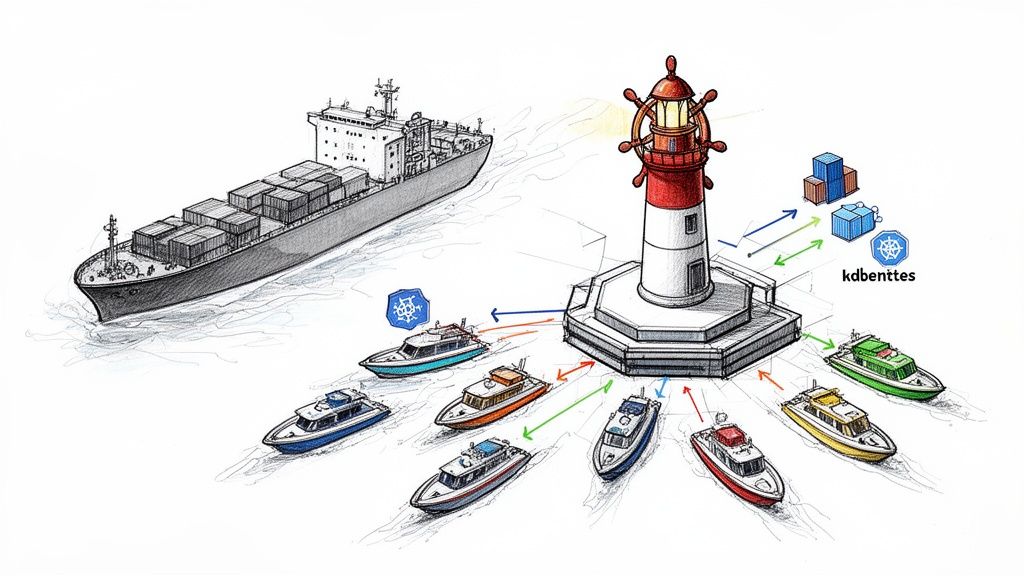
The diagram below illustrates the architectural shift from a single monolithic process to a fleet of services managed by the Kubernetes control plane.
This diagram shows Kubernetes as the orchestration layer providing control. Now, let's examine the technical patterns that implement this control.
The API Gateway Pattern
Exposing dozens of microservice endpoints directly to external clients is an anti-pattern. It creates tight coupling, forces clients to manage multiple endpoints and authentication mechanisms, and complicates cross-cutting concerns.
The API Gateway pattern addresses this by introducing a single, unified entry point for all client requests. Implemented with tools like Kong, Ambassador, or cloud-native gateways, it acts as a reverse proxy for the cluster.
An API Gateway is a Layer 7 proxy that serves as the single ingress point for all external traffic. It decouples clients from the internal microservice topology and centralizes cross-cutting concerns.
This single entry point offloads critical functionality from individual services:
- Request Routing: It maps external API routes (e.g.,
/api/v1/users) to internal Kubernetes services (e.g.,user-service:8080). - Authentication and Authorization: It can validate JWTs or API keys, ensuring that unauthenticated requests never reach the internal network.
- Rate Limiting and Throttling: It enforces usage policies to protect backend services from denial-of-service attacks or excessive load.
- Response Aggregation: It can compose responses from multiple downstream microservices into a single, aggregated payload for the client (the "Gateway Aggregation" pattern).
By centralizing these concerns, the API Gateway allows microservices to focus exclusively on their core business logic.
The Sidecar Pattern
Adding cross-cutting functionality like logging, monitoring, or configuration management directly into an application's codebase violates the single responsibility principle. The Sidecar pattern solves this by attaching a helper container to the main application container within the same Kubernetes Pod.
Since containers in a Pod share the same network namespace and can share storage volumes, the sidecar can augment the main container without being tightly coupled to it. For example, a logging sidecar can tail log files from a shared emptyDir volume or capture stdout from the primary container and forward them to a centralized logging system. The application remains oblivious to this process.
Common use cases for the Sidecar pattern include:
- Log Aggregation: A
fluentdcontainer shipping logs to Elasticsearch. - Service Mesh Proxies: An Envoy or Linkerd proxy intercepting all inbound/outbound network traffic for observability and security.
- Configuration Management: A helper container that fetches configuration from a service like Vault and writes it to a shared volume for the main app to consume.
The Service Mesh Pattern
While an API Gateway manages traffic entering the cluster (north-south traffic), a Service Mesh focuses on managing the complex web of inter-service communication within the cluster (east-west traffic). Tools like Istio or Linkerd implement this pattern by injecting a sidecar proxy (like Envoy) into every microservice pod.
This network of proxies forms a programmable control plane that provides deep visibility and fine-grained control over all service-to-service communication. A service mesh enables advanced capabilities without any application code changes, such as mutual TLS (mTLS) for zero-trust security, dynamic request routing for canary deployments, and automatic retries and circuit breaking for enhanced resiliency.
These foundational patterns are essential for any production-grade system. To understand the broader context, explore these key software architecture design patterns. For a more focused examination, our guide on microservices architecture design patterns details their practical application.
Mastering Advanced Deployment and Scaling Strategies
With microservices running in Kubernetes, the next challenge is managing their lifecycle: deploying updates and scaling to meet traffic demands without downtime. Kubernetes excels here, transforming high-risk manual deployments into automated, low-risk operational procedures.
The objective is to maintain service availability and performance under all conditions.
This operational maturity is a major factor in the cloud microservices market's growth, projected to expand from USD 1.84 billion in 2024 to USD 8.06 billion by 2032. Teams are successfully managing complex systems with Kubernetes, driving wider adoption. Explore this growing market and its key drivers for more context.
Let's examine the core deployment strategies and autoscaling mechanisms that enable resilient, cost-effective systems.
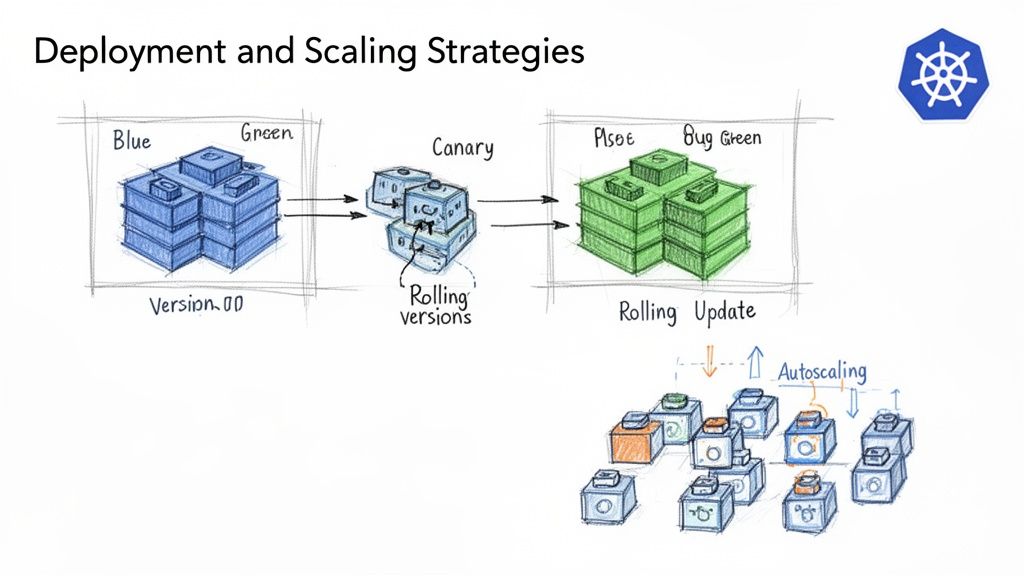
Zero-Downtime Deployment Patterns
In the microservices and Kubernetes ecosystem, several battle-tested deployment strategies are available. The choice depends on risk tolerance, application architecture, and business requirements.
-
Rolling Updates: This is the default strategy for Kubernetes
Deploymentobjects. It incrementally replaces old pods with new ones, ensuring a minimum number of pods (defined bymaxUnavailableandmaxSurge) remain available throughout the update. It is simple, safe, and effective for most stateless services. -
Blue-Green Deployments: This strategy involves maintaining two identical production environments: "Blue" (current version) and "Green" (new version). Traffic is directed to the Blue environment. Once the Green environment is deployed and fully tested, the Kubernetes
Serviceselector is updated to point to the Green deployment's pods, instantly switching all live traffic. This provides near-instantaneous rollback capability by simply reverting the selector change. -
Canary Releases: This is a more cautious approach where the new version is rolled out to a small subset of users. This can be implemented using a service mesh like Istio to route a specific percentage of traffic (e.g., 5%) to the new "canary" version. You can then monitor performance and error rates on this subset before gradually increasing traffic and completing the rollout.
Each deployment strategy offers a different trade-off. Rolling updates provide simplicity. Blue-Green offers rapid rollback. Canary releases provide the highest degree of safety by validating changes with a small blast radius.
Taming Demand with Kubernetes Autoscaling
Manually adjusting capacity in response to traffic fluctuations is inefficient and error-prone. Kubernetes provides a multi-layered, automated solution to this problem.
Horizontal Pod Autoscaler (HPA)
The Horizontal Pod Autoscaler (HPA) is the primary mechanism for scaling stateless workloads. It monitors resource utilization metrics (like CPU and memory) or custom metrics from Prometheus, automatically adjusting the number of pod replicas in a Deployment or ReplicaSet to meet a defined target.
For example, if you set a target CPU utilization of 60% and the average usage climbs to 90%, the HPA will create new pod replicas to distribute the load and bring the average back to the target.
Vertical Pod Autoscaler (VPA)
While HPA scales out, the Vertical Pod Autoscaler (VPA) scales up. It analyzes historical resource usage of pods and automatically adjusts the CPU and memory requests and limits defined in their pod specifications. This is crucial for "right-sizing" applications, preventing resource waste and ensuring pods have the resources they need to perform optimally.
Cluster Autoscaler (CA)
The Cluster Autoscaler (CA) operates at the infrastructure level. When the HPA needs to schedule more pods but there are no available nodes with sufficient resources, the CA detects these pending pods and automatically provisions new nodes from your cloud provider (e.g., EC2 instances in AWS, VMs in GCP). Conversely, if it identifies underutilized nodes, it will safely drain their pods and terminate the nodes to optimize costs.
These three autoscalers work in concert to create a fully elastic system. To implement them effectively, review our technical guide on autoscaling in Kubernetes.
Building Automated CI/CD Pipelines for Kubernetes
In a microservices architecture, manual deployments are untenable. Automation is essential to realize the agility promised by microservices and Kubernetes. A robust Continuous Integration/Continuous Deployment (CI/CD) pipeline automates the entire software delivery lifecycle, enabling frequent, reliable, and predictable releases.
The goal is to create a repeatable, auditable, and fully automated workflow that takes code from a developer's commit to a production deployment, providing teams the confidence to release changes frequently without compromising stability.
Anatomy of a Kubernetes CI/CD Pipeline
A modern Kubernetes CI/CD pipeline is a sequence of automated stages, where each stage acts as a quality gate. An artifact only proceeds to the next stage upon successful completion of the current one.
A typical workflow triggered by a git push includes:
- Code Commit (Trigger): A developer pushes code changes to a Git repository like GitHub or GitLab. A webhook triggers the CI pipeline.
- Automated Testing (CI): A CI server like Jenkins or GitLab CI executes a suite of tests: unit tests, integration tests, and static code analysis (SAST) to validate code quality and correctness.
- Build Docker Image (CI): Upon test success, the pipeline builds the microservice into a Docker image using a
Dockerfile. The image is tagged with the Git commit SHA for full traceability. - Push to Registry (CI): The immutable Docker image is pushed to a container registry, such as Azure Container Registry (ACR) or Google Container Registry (GCR).
- Deploy to Staging (CD): The Continuous Deployment phase begins. The pipeline updates the Kubernetes manifest (e.g., a Deployment YAML or Helm chart) with the new image tag and applies it to a staging Kubernetes cluster that mirrors the production environment.
- Deploy to Production (CD): After automated or manual validation in staging, the change is promoted to the production cluster. This step should always use a zero-downtime strategy like a rolling update or canary release.
This entire automated sequence can be completed in minutes, drastically reducing the lead time for changes.
Key Tools and Integration Points
Building a robust pipeline involves integrating several specialized tools. A common, powerful stack includes:
-
CI/CD Orchestrator (Jenkins/GitLab CI): These tools define and execute the pipeline stages. They integrate with source control to trigger builds and orchestrate the testing, building, and deployment steps via declarative pipeline-as-code files (e.g.,
Jenkinsfile,.gitlab-ci.yml). -
Application Packaging (Helm): Managing raw Kubernetes YAML files for numerous microservices is complex and error-prone. Helm acts as a package manager for Kubernetes, allowing you to bundle all application resources into versioned packages called Helm charts. This templatizes your Kubernetes manifests, making deployments repeatable and configurable.
Helm charts are to Kubernetes what
aptoryumare to Linux. They simplify the management of complex applications by enabling single-command installation, upgrades, and rollbacks.
- GitOps Controller (Argo CD): To ensure the live state of your cluster continuously matches the desired state defined in Git, you should adopt GitOps. A tool like Argo CD runs inside the cluster and constantly monitors a Git repository containing your application's Kubernetes manifests (e.g., Helm charts).
When Argo CD detects a divergence between the Git repository (the source of truth) and the live cluster state—for instance, a new image tag in a Deployment manifest—it automatically synchronizes the cluster to match the desired state. This creates a fully declarative, auditable, and self-healing system that eliminates configuration drift and reduces deployment errors.
Implementing a Modern Observability Stack
In a distributed microservices system on Kubernetes, traditional debugging methods fail. Failures can occur anywhere across a complex chain of service interactions. Without deep visibility, troubleshooting becomes a guessing game.
You cannot manage what you cannot measure. A comprehensive observability stack is a foundational requirement for production operations.
This blueprint outlines how to gain actionable insight into your Kubernetes environment based on the three pillars of observability: logs, metrics, and traces. Implementing this stack transitions teams from reactive firefighting to proactive, data-driven site reliability engineering (SRE).
Centralizing Logs for System-Wide Insight
Every container in your cluster generates log data. The primary goal is to aggregate these logs from all pods into a centralized, searchable datastore.
A common pattern is to deploy Fluentd as a DaemonSet on each Kubernetes node. This allows it to collect logs from all containers running on that node, enrich them with Kubernetes metadata (pod name, namespace, labels), and forward them to a backend like Elasticsearch. Using Kibana, you can then search, filter, and analyze logs across the entire system from a single interface.
Capturing Performance Data with Metrics
Logs describe discrete events (what happened), while metrics quantify system behavior over time (how it is performing). Metrics are time-series data points like CPU utilization, request latency, and queue depth that provide a quantitative view of system health.
For Kubernetes, Prometheus is the de facto standard. You instrument your application code to expose metrics on a /metrics HTTP endpoint. Prometheus is configured to periodically "scrape" these endpoints to collect the data.
Prometheus uses a pull-based model, where the server actively scrapes targets. This model is more resilient and scalable in dynamic environments like Kubernetes compared to traditional push-based monitoring.
Kubernetes enhances this with Custom Resource Definitions (CRDs) like ServiceMonitor. These declaratively define how Prometheus should discover and scrape new services as they are deployed, enabling automatic monitoring without manual configuration.
Pinpointing Bottlenecks with Distributed Tracing
A single user request can traverse numerous microservices. If the request is slow, identifying the bottleneck is difficult. Distributed tracing solves this problem.
Tools like Jaeger and standards like OpenTelemetry allow you to trace the entire lifecycle of a request as it moves through the system. By injecting a unique trace ID context that is propagated with each downstream call, you can visualize the entire request path as a flame graph. This graph shows the time spent in each service and in network transit, immediately revealing latency bottlenecks and hidden dependencies.
To achieve true observability, you must integrate all three pillars.
The Three Pillars of Observability in Kubernetes
| Pillar | Core Function | Common Kubernetes Tools |
|---|---|---|
| Logging | Captures discrete, timestamped events. Answers "What happened?" for a specific operation. | Fluentd, Logstash, Loki |
| Metrics | Collects numeric, time-series data. Answers "How is the system performing?" by tracking key performance indicators over time. | Prometheus, Grafana, Thanos |
| Tracing | Records the end-to-end journey of a request across services. Answers "Where is the bottleneck?" by visualizing distributed call graphs. | Jaeger, OpenTelemetry, Zipkin |
Each pillar offers a different lens for understanding system behavior. Combining them provides a complete, correlated view, enabling rapid and effective troubleshooting.
The value of this investment is clear. The microservices orchestration market is projected to reach USD 5.8 billion by 2025, with 85% of large organizations using Kubernetes. Effective observability can reduce mean time to recovery (MTTR) by up to 70%. This comprehensive market analysis details the numbers. A robust observability stack is a direct investment in system reliability and engineering velocity.
Frequently Asked Questions About Microservices and Kubernetes
When implementing microservices and Kubernetes, several common technical questions arise. Addressing these is crucial for building a secure, maintainable, and robust system. This section provides direct, technical answers to the most frequent challenges.
How Do You Manage Configuration and Secrets?
Application configuration should always be externalized from container images. For non-sensitive data, use Kubernetes ConfigMaps. For sensitive data like database credentials and API keys, use Secrets. Kubernetes Secrets are Base64 encoded, not encrypted at rest by default, so you must enable encryption at rest for your etcd datastore.
Secrets can be injected into pods as environment variables or mounted as files in a volume. For production environments, it is best practice to integrate a dedicated secrets management tool like HashiCorp Vault using a sidecar injector, or use a sealed secrets controller like Sealed Secrets for a GitOps-friendly approach.
What Is the Difference Between a Service Mesh and an API Gateway?
The distinction lies in the direction and purpose of the traffic they manage.
- An API Gateway manages north-south traffic: requests originating from outside the Kubernetes cluster and entering it. Its primary functions are client-facing: request routing, authentication, rate limiting, and acting as a single ingress point.
- A Service Mesh manages east-west traffic: communication between microservices inside the cluster. Its focus is on internal service reliability and security: mutual TLS (mTLS) encryption, service discovery, load balancing, retries, and circuit breaking.
In an analogy, the API Gateway is the security checkpoint at the entrance of a building. The Service Mesh is the secure communication system and protocol used by people inside the building.
How Do You Handle Database Management?
The "database per service" pattern is a core tenet of microservices architecture. Each microservice should have exclusive ownership of its own database to ensure loose coupling. Direct database access between services is an anti-pattern; communication should occur only through APIs.
While you can run stateful databases in Kubernetes using StatefulSets and Persistent Volumes, this introduces significant operational complexity around backups, replication, and disaster recovery. For production systems, it is often more practical and reliable to use a managed database service from a cloud provider, such as Amazon RDS or Google Cloud SQL.
When Should You Not Use Microservices?
Microservices are not a universal solution. The operational overhead of managing a distributed system is substantial. You should avoid a microservices architecture for:
- Small, simple applications: A well-structured monolith is far simpler to build, deploy, and manage.
- Early-stage startups: When the team is small and business domains are not yet well-defined, the flexibility of a monolith allows for faster iteration.
- Systems without clear domain boundaries: If you cannot decompose the application into logically independent business capabilities, you will likely create a "distributed monolith" with all the disadvantages of both architectures.
The complexity of microservices should only be adopted when the scaling and organizational benefits clearly outweigh the significant operational cost.
Navigating the real-world complexities of microservices and Kubernetes demands serious expertise. OpsMoon connects you with the top 0.7% of DevOps engineers who can accelerate your projects, from hashing out the initial architecture to building fully automated pipelines and observability stacks. Get the specialized talent you need to build scalable, resilient systems that just work. Find your expert at OpsMoon.
Leave a Reply