
Site Reliability Engineering (SRE) bridges the gap between development and operations by applying a software engineering mindset to infrastructure and operations problems. The objective is to create scalable and highly reliable software systems through data-driven, automated solutions. This guide moves beyond theory to provide a prioritized, actionable roundup of essential SRE best practices, detailing specific technical strategies to enhance system stability and performance.
This is not a list of abstract concepts. Instead, we will detail specific, technical strategies that form the foundation of a robust SRE culture. We will cover how to quantitatively define reliability using Service Level Indicators (SLIs) and Objectives (SLOs), and how to use the resulting error budgets to balance innovation with stability. You will learn practical steps for implementing everything from blameless postmortems that foster a culture of learning to advanced techniques like chaos engineering for proactive failure testing.
Each practice in this listicle is presented as a self-contained module, complete with:
- Implementation Guidance: Step-by-step instructions to get started.
- Actionable Checklists: Quick-reference lists to ensure you cover key tasks.
- Concrete Examples: Real-world scenarios illustrating the principles in action.
- Expertise Indicators: Clear signals for when it's time to bring in external SRE consultants.
Whether you're a CTO at a startup aiming for scalable infrastructure, an engineering leader refining your incident response process, or a platform engineer seeking to automate operational toil, this article provides the technical blueprints you need. The following sections offer a deep dive into the core SRE best practices that drive elite operational performance.
1. Error Budgets
An error budget is the maximum allowable level of unreliability a service can experience without violating its Service Level Objective (SLO). It is a direct mathematical consequence of an SLO. For an SLO of 99.9% availability over a 30-day window, the error budget is the remaining 0.1%, which translates to (1 - 0.999) * 30 * 24 * 60 = 43.2 minutes of downtime. This budget is the currency SREs use to balance risk and innovation.
If a service has consumed its error budget, all deployments of new features are frozen. The development team's priority must shift exclusively to reliability-focused work, such as fixing bugs, hardening infrastructure, or improving test coverage. Conversely, if the budget is largely intact, the team has the green light to take calculated risks, such as rolling out a major feature or performing a complex migration. This data-driven policy removes emotional debate from deployment decisions.
How to Implement Error Budgets
Implementing error budgets provides a common, objective language for developers and operations teams to balance innovation velocity with system stability.
- Establish SLOs First: An error budget is
100% - SLO%. Without a defined SLO, the budget cannot be calculated. Start with a user-critical journey (e.g., checkout process) and define an availability SLO based on historical performance data. - Automate Budget Tracking: Use a monitoring tool like Prometheus to track your SLI (e.g.,
sum(rate(http_requests_total{status_code=~"^5.."})) / sum(rate(http_requests_total{}))) against your SLO. Configure a Grafana dashboard to visualize the remaining error budget percentage and its burn-down rate. Set up alerts that trigger when the budget is projected to be exhausted before the end of the window (e.g., "Error budget will be consumed in 72 hours at current burn rate"). - Define and Enforce Policies: Codify the error budget policy in a document. For example: "If the 28-day error budget drops below 25%, all new feature deployments to this service are halted. A JIRA epic for reliability work is automatically created and prioritized." Integrate this policy check directly into your CI/CD pipeline, making it a required gate for production deployments.
Key Insight: Error budgets transform reliability from an abstract goal into a quantifiable resource. This reframes the conversation from "Is the system stable enough?" to "How much risk can our current reliability level afford?"
Companies like Google and Netflix famously use error budgets to manage deployment velocity. At Google, if a service exhausts its error budget, the SRE team can unilaterally block new rollouts from the development team until reliability is restored. This practice empowers teams to innovate quickly but provides a non-negotiable safety mechanism to protect the user experience.
2. Service Level Objectives (SLOs) and Indicators (SLIs)
Service Level Objectives (SLOs) are explicit reliability targets for a service, derived from the user's perspective. They are built upon Service Level Indicators (SLIs), which are the direct, quantitative measurements of service performance. An SLI is the metric (e.g., http_response_latency_ms), while the SLO is the target for that metric over a compliance period (e.g., "99% of login requests will be served in under 300ms over a rolling 28-day window").
This framework replaces vague statements like "the system should be fast" with precise, verifiable commitments. SLOs and SLIs are foundational SRE best practices because they provide the data needed for error budgets, prioritize engineering work that directly impacts user satisfaction, and create a shared, objective understanding of "good enough" performance between all stakeholders.
How to Implement SLOs and SLIs
Implementing SLOs and SLIs shifts the focus from purely technical metrics to user-centric measures of happiness and system performance. This ensures engineering efforts are aligned with business outcomes.
- Identify User-Critical Journeys: Do not measure what is easy; measure what matters. Start by mapping critical user workflows, such as 'User Login', 'Search Query', or 'Add to Cart'. Your first SLIs must measure the availability and performance of these specific journeys.
- Choose Meaningful SLIs: Select SLIs that directly reflect user experience. Good SLIs include availability (proportion of successful requests) and latency (proportion of requests served faster than a threshold). A poor SLI is server CPU utilization, as high CPU is not intrinsically a problem if user requests are still being served reliably and quickly. A good availability SLI implementation could be:
(total requests - requests with 5xx status codes) / total requests. - Set Realistic SLOs: Use historical performance data to set initial SLOs. If your system has historically maintained 99.9% availability, setting a 99.99% SLO immediately will lead to constant alerts and burnout. Set an achievable baseline, meet it consistently, and then incrementally raise the target as reliability improves.
- Document and Review Regularly: SLOs must be version-controlled and documented in a location accessible to all engineers. Review them quarterly. An SLO for a new product might be relaxed to encourage rapid iteration, while the SLO for a mature, critical service should be tightened over time.
Key Insight: SLOs and SLIs are not just monitoring metrics; they are a formal agreement on the reliability expectations of a service. They force a data-driven definition of "good enough," providing an objective framework for engineering trade-offs.
Companies like GitHub use SLOs to manage the performance of their API, setting specific targets for response times and availability that their customers rely on. Similarly, Google Cloud publicly documents SLOs for its services, such as a 99.95% availability target for many critical infrastructure components, providing transparent reliability commitments to its users.
3. On-Call Rotations and Alerting
A structured on-call program is an SRE best practice that assigns engineers direct responsibility for responding to service incidents during specific, rotating shifts. It is a system designed for rapid, effective incident response and continuous system improvement, not just a reactive measure. The primary goal is to minimize Mean Time to Resolution (MTTR) while protecting engineers from alert fatigue and burnout.
Effective on-call is defined by actionable, SLO-based alerting. An alert should only page a human if it signifies a real or imminent violation of an SLO and requires urgent, intelligent intervention. This practice creates a direct feedback loop: the engineers who write the code are directly exposed to its operational failures, incentivizing them to build more resilient, observable, and maintainable systems.
How to Implement On-Call Rotations and Alerting
Implementing a fair and effective on-call system minimizes incident resolution time (MTTR) and prevents alert fatigue, which is critical for team health and service reliability.
- Alert on SLO Violations (Symptoms), Not Causes: Configure alerts based on the rate of error budget burn. For example, "Page the on-call engineer if the service is projected to exhaust its 30-day error budget in the next 48 hours." This is far more effective than alerting on high CPU, which is a cause, not a user-facing symptom. An alert must be actionable; if the response is "wait and see," it should be a ticket, not a page.
- Establish Automated Escalation Paths: In your on-call tool (e.g., PagerDuty, Opsgenie), configure clear escalation policies. If the primary on-call engineer does not acknowledge a page within 5 minutes, it should automatically escalate to a secondary engineer. If they do not respond, it escalates to the team lead or a designated incident commander. This ensures critical alerts are never missed.
- Invest in Runbooks and Automation: Every alert must link directly to a runbook. A runbook should provide diagnostic queries (e.g.,
kubectl logs <pod-name> | grep "error") and remediation commands (e.g.,kubectl rollout restart deployment/<deployment-name>). The ultimate goal is to automate the runbook itself, turning a manual procedure into a one-click action or a fully automated response.
Key Insight: A healthy on-call rotation treats human attention as the most valuable and finite resource in incident response. It uses automation to handle predictable failures and saves human intervention for novel problems requiring critical thinking.
Companies like Stripe and Etsy have refined this practice by integrating sophisticated scheduling, automated escalations, and a strong culture of blameless postmortems. At Etsy, on-call feedback directly influences tooling and service architecture. This approach ensures that the operational load is not just managed but actively reduced over time, making it a sustainable and invaluable component of their SRE best practices.
4. Blameless Postmortems
A blameless postmortem is a structured, written analysis following an incident that focuses on identifying contributing systemic factors rather than assigning individual fault. This foundational SRE best practice is predicated on creating psychological safety, which encourages engineers to provide an honest, detailed timeline of events without fear of punishment. This treats every incident as a valuable, unplanned investment in system reliability.

The process shifts the investigation from "Who caused the outage?" to "What pressures, assumptions, and environmental factors led to the actions that triggered the outage?". It recognizes that "human error" is a symptom of deeper systemic flaws—such as inadequate tooling, poor UI design, or insufficient safeguards in a deployment pipeline. The goal is to produce a list of concrete, tracked action items that harden the system against that entire class of failure.
How to Implement Blameless Postmortems
Conducting effective blameless postmortems cultivates a culture of continuous improvement and engineering excellence. The process transforms failures into valuable, actionable intelligence that strengthens the entire system.
- Use a Standardized Template: Create a postmortem template that includes sections for: a timeline of events with precise timestamps, root cause analysis (using a method like "The 5 Whys"), user impact (quantified by SLOs), a list of action items with owners and due dates, and lessons learned. Store these documents in a centralized, searchable repository (e.g., a Confluence space or Git repo).
- Focus on Systemic Causes: During the postmortem meeting, the facilitator must steer the conversation away from individual blame. Instead of asking "Why did you push that change?", ask "What part of our process allowed a change with this impact to be deployed?". This uncovers weaknesses in code review, testing, or automated validation.
- Track Action Items as Engineering Work: The primary output of a postmortem is a set of action items (e.g., "Add integration test for checkout API," "Implement circuit breaker for payment service"). These items must be created as tickets in your project management system (e.g., JIRA), prioritized alongside feature work, and tracked to completion. Efficiently managing these follow-ups can be streamlined using specialized tools like a retrospective manager.
Key Insight: Blamelessness does not mean lack of accountability. It shifts accountability from the individual who made a mistake to the entire team responsible for building and maintaining a resilient system.
Companies like Etsy and Stripe have been vocal advocates for this SRE best practice, often sharing their postmortem methodologies to promote industry-wide transparency and learning. For teams looking to refine their incident response lifecycle, Mastering Mean Time to Resolution (MTTR) provides critical insights into the metrics that blameless postmortems help to improve. By analyzing the entire timeline of an incident, from detection to resolution, teams can identify key areas for systemic improvement.
5. Infrastructure as Code (IaC) and Configuration Management
Infrastructure as Code (IaC) is a core SRE practice of managing and provisioning infrastructure through machine-readable definition files, rather than through manual configuration or interactive tools. Server configurations, networking rules, load balancers, and databases are treated as software artifacts: versioned in Git, reviewed via pull requests, and deployed through automated pipelines. This approach eliminates configuration drift and makes infrastructure provisioning deterministic and repeatable.
IaC enables teams to spin up identical environments (dev, staging, prod) on demand, which is critical for reliable testing, disaster recovery, and rapid scaling. By codifying infrastructure, you establish a single source of truth that is visible and auditable by engineering, security, and operations teams. This practice is a non-negotiable prerequisite for achieving high-velocity, reliable software delivery at scale.
How to Implement IaC and Configuration Management
Properly implementing IaC transforms infrastructure from a fragile, manually-managed asset into a resilient, automated system that can be deployed and modified with confidence.
- Adopt Declarative Tools: Use declarative IaC tools like Terraform or Kubernetes manifests. These tools allow you to define the desired state of your infrastructure (e.g., "I need three
t3.mediumEC2 instances in a VPC"). The tool is responsible for figuring out the imperative steps to achieve that state, abstracting away the complexity of the underlying API calls. - Version Control Everything in Git: All infrastructure code—Terraform modules, Kubernetes YAML, Ansible playbooks—must be stored in a Git repository. This provides a complete, auditable history of every change. Enforce a pull request workflow for all infrastructure modifications, requiring peer review and automated linting/validation checks before merging to the main branch.
- Integrate into CI/CD Pipelines: The
mainbranch of your IaC repository should represent the state of production. Automate the deployment of infrastructure changes via a CI/CD pipeline (e.g., Jenkins, GitLab CI, or Atlantis for Terraform). Aterraform planshould be automatically generated on every pull request, andterraform applyshould be executed automatically upon merge, ensuring infrastructure evolves in lockstep with application code. For more details, explore these Infrastructure as Code best practices.
Key Insight: IaC fundamentally changes infrastructure management from a series of manual, error-prone commands to a disciplined software engineering practice. This makes infrastructure changes safe, predictable, and scalable.
Companies like Uber leverage Terraform to manage a complex, multi-cloud infrastructure, ensuring consistency across different providers. Similarly, Netflix relies heavily on IaC principles to rapidly provision and manage the massive fleet of instances required for its global streaming service, enabling resilient and scalable deployments. This approach is central to their ability to innovate while maintaining high availability.
6. Observability (Monitoring, Logging, Tracing)
Observability is the ability to infer a system's internal state from its external outputs, enabling engineers to ask arbitrary questions to debug novel failure modes. While traditional monitoring tracks predefined metrics for known failure states (the "known unknowns"), observability provides the rich, high-cardinality data needed to investigate complex, unpredictable issues (the "unknown unknowns").
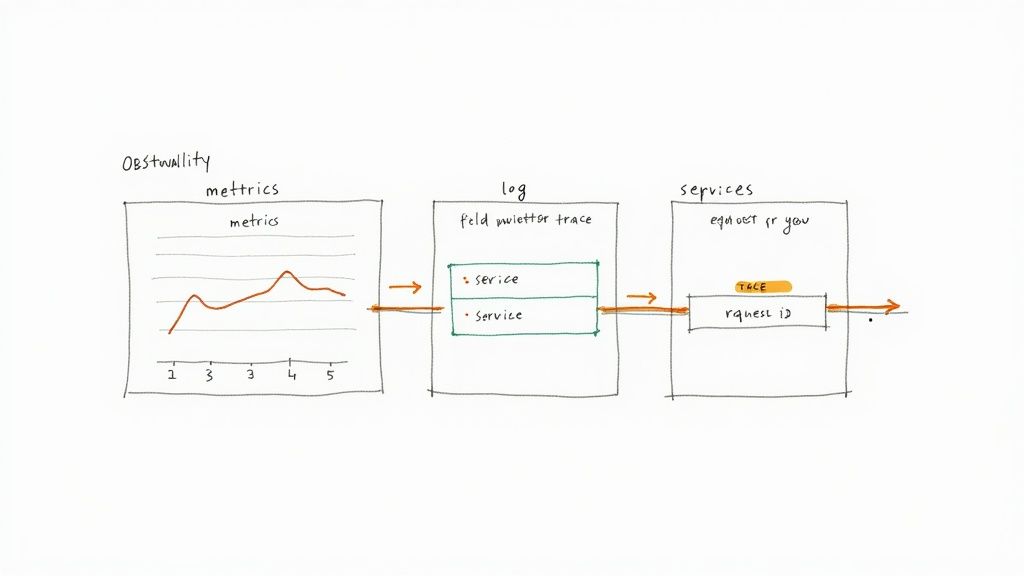
This capability is built on three pillars: metrics (numeric time-series data, e.g., request count), logs (structured, timestamped event records, e.g., a JSON log of a single request), and traces (an end-to-end view of a request's journey across multiple services). Correlating these three data types provides a complete picture, allowing an engineer to seamlessly pivot from a high-level alert on a metric to the specific trace and log lines that reveal the root cause.
How to Implement Observability
Implementing true observability requires instrumenting applications to emit high-quality telemetry and using platforms that can effectively correlate this data. The goal is to create a seamless debugging workflow, from a high-level alert on a metric to the specific log lines and distributed traces that explain the root cause.
- Instrument with OpenTelemetry: Standardize your telemetry generation using OpenTelemetry (OTel). This vendor-neutral framework allows you to instrument your code once and send the data to any backend observability platform (e.g., Honeycomb, Datadog, Grafana). This avoids vendor lock-in and ensures consistent data across all services.
- Enforce Structured Logging: Mandate that all log output be in a machine-readable format like JSON. Each log entry must include contextual metadata, such as
trace_id,user_id, andrequest_id. This allows you to filter, aggregate, and correlate logs with metrics and traces, turning them from a simple text stream into a powerful queryable database. - Implement Distributed Tracing: In a microservices architecture, distributed tracing is non-negotiable. Ensure that trace context (like the
trace_id) is propagated automatically across all service boundaries (e.g., HTTP requests, message queue events). This allows you to visualize the entire lifecycle of a request, pinpointing bottlenecks and errors in complex call chains. - Focus on High-Cardinality Data: The key differentiator of observability is the ability to analyze high-cardinality dimensions (fields with many unique values, like
user_id,customer_tenant_id, orbuild_version). Ensure your observability platform can handle and query this data efficiently without pre-aggregation, as this is what allows you to debug issues affecting a single user.
Key Insight: Monitoring tells you that something is wrong; observability lets you ask why. It is the essential capability for debugging complex, distributed systems in production.
Companies like Honeycomb and Datadog have built their platforms around this principle. They empower engineers to investigate production incidents by exploring high-cardinality data in real-time. For example, an engineer can go from a dashboard showing elevated API error rates, to filtering those errors by a specific customer ID, and finally drilling down into the exact traces for that customer to see the failing database query, all within a single, unified interface.
7. Automation and Runbooks
Automation in SRE is the practice of systematically eliminating toil—manual, repetitive, tactical work that lacks enduring engineering value and scales linearly with service growth. This is achieved by creating software and systems to replace human operational tasks. Automation is guided by runbooks: detailed, version-controlled documents that specify the exact steps for handling a particular procedure or incident.
A runbook serves as the blueprint for automation. First, the manual process is documented. Then, that documented procedure is converted into a script or automated tool. This ensures the automation is based on proven operational knowledge. This SRE best practice reduces human error, drastically cuts down MTTR, and frees up engineers to focus on proactive, high-value projects like performance tuning and reliability enhancements.
How to Implement Automation and Runbooks
Implementing automation and runbooks is a foundational step in scaling operational excellence and is a core component of mature SRE best practices.
- Codify Runbooks in Markdown and Git: Identify the top 5 most frequent on-call tasks (e.g., restarting a service, failing over a database, clearing a cache). Document the step-by-step procedures, including exact commands to run and verification steps, in Markdown files stored in a Git repository. This treats your operational knowledge as code.
- Automate Incrementally with Scripts: Use the runbook as a spec to write a script (e.g., in Python or Bash) that automates the procedure. Ensure the script is idempotent (can be run multiple times without adverse effects) and includes safety checks and a "dry-run" mode. Prioritize automating tasks that are frequent, risky, or time-consuming.
- Build a Centralized Tooling Platform: As your library of automation scripts grows, consolidate them into a centralized platform or command-line tool. This makes them discoverable and easy to execute for the entire team. Integrate this tooling with your chat platform (e.g., a Slack bot) to enable "ChatOps," allowing engineers to trigger automated actions directly from their incident response channel.
Key Insight: A runbook codifies "how we fix this." An automation script executes that codified knowledge flawlessly and at machine speed. The goal of SRE is to have a runbook for every alert, and to automate every runbook.
Companies like LinkedIn and Netflix are pioneers in this domain. LinkedIn's "Dr. Elephant" automates the tuning of Hadoop and Spark jobs, reducing toil for data engineers. Netflix's automation for canary analysis and rollbacks is critical to its high-velocity deployment model, automatically detecting and stopping bad deployments based on real-time telemetry, without human intervention. These systems are the result of a relentless focus on engineering away operational burdens.
8. Testing in Production and Chaos Engineering
The SRE principle of "testing in production" acknowledges that no staging environment can perfectly replicate the complexity, scale, and emergent behaviors of a live production system. Chaos engineering is the most advanced form of this practice: it is the discipline of experimenting on a distributed system in order to build confidence in the system's capability to withstand turbulent conditions in production.
Instead of trying to prevent all failures, chaos engineering aims to identify and remediate weaknesses before they manifest as systemic outages. It involves deliberately injecting controlled failures—such as terminating VMs, injecting latency, or partitioning the network—to verify that monitoring, alerting, and automated failover mechanisms work as expected. This practice builds antifragile systems that are hardened against real-world failures.
How to Implement Testing in Production and Chaos Engineering
Implementing these advanced testing strategies requires a mature observability stack and a culture that values learning from failure. It is the ultimate test of a system's resilience and a powerful way to harden it.
- Start with "Game Days": Before automating chaos, run manual "game day" exercises. The team gathers (virtually or physically) and a designated person manually executes a failure scenario (e.g.,
kubectl delete pod <service-pod> --namespace=production). The rest of the team observes the system's response via dashboards to validate that alerts fire, traffic fails over, and SLOs are not breached. - Define Experiments with a Limited Blast Radius: A chaos experiment must be well-defined: state a clear hypothesis ("If we terminate a worker node, user requests should not see errors"), limit the potential impact ("blast radius") to a small subset of users or internal systems, and have a clear "stop" button.
- Automate with Chaos Engineering Tools: Use tools like Gremlin or the open-source Chaos Mesh to automate fault injection. Start with low-impact experiments, such as injecting 100ms of latency into a non-critical internal API. Gradually increase the scope and severity of experiments as you build confidence. Integrate these chaos tests into your CI/CD pipeline to continuously validate the resilience of new code. To understand the principles in more depth, you can learn more about what chaos engineering is and how it works.
Key Insight: Chaos engineering is not about breaking production. It is about using controlled, scientific experiments to proactively discover and fix hidden weaknesses in production before they cause a user-facing outage.
Netflix pioneered this field with its "Chaos Monkey," a tool that randomly terminates instances in their production environment to enforce the development of fault-tolerant services. Similarly, Google conducts regular DiRT (Disaster Recovery Testing) exercises to test its readiness for large-scale failures. By embracing controlled failure, these companies build systems that are antifragile, growing stronger and more reliable with every experiment.
9. Capacity Planning and Performance Optimization
Capacity planning is the data-driven process of forecasting future resource requirements to ensure a service can handle its load while meeting performance SLOs. It is a proactive SRE practice that prevents performance degradation and capacity-related outages. By analyzing historical utilization trends, business growth forecasts, and application performance profiles, SREs can provision resources to meet demand without costly over-provisioning.
This is a continuous cycle. Capacity plans must be regularly updated to reflect new features, changing user behavior, and software performance improvements. Effective planning requires a deep understanding of which resources are the primary constraints for a service (e.g., CPU, memory, I/O, or network bandwidth) and how the service behaves as it approaches those limits.
How to Implement Capacity Planning
Implementing a robust capacity planning process is crucial for maintaining performance and managing costs as your services scale. It requires a deep understanding of your system's behavior under various load conditions.
- Establish Performance Baselines and Load Test: Use monitoring data to establish a baseline for resource consumption per unit of work (e.g., CPU cycles per 1000 requests). Conduct regular load tests to determine the maximum capacity of your current configuration and identify performance bottlenecks. This tells you how much headroom you have.
- Forecast Demand Using Historical Data and Business Events: Extract historical usage metrics from your monitoring system (e.g., requests per second over the last 12 months). Use time-series forecasting models to project future growth. Crucially, enrich this data with business intelligence: collaborate with product and marketing teams to factor in upcoming launches, promotions, or seasonal peaks.
- Automate Scaling and Continuously Profile: Use cloud auto-scaling groups or Kubernetes Horizontal Pod Autoscalers to handle short-term traffic fluctuations. For long-term growth, regularly use profiling tools (like
pprofin Go or YourKit for Java) to identify and optimize inefficient code. A 10% performance improvement in a critical API can defer the need for a costly hardware upgrade for months.
Key Insight: Capacity planning is a cycle of
measure -> model -> provision -> optimize. Performance optimization is a key input, as making the software more efficient is often cheaper and more effective than adding more hardware.
Cloud providers are experts in this domain. AWS, for instance, provides extensive documentation and tools like AWS Compute Optimizer and Trusted Advisor to help teams right-size their infrastructure. Similarly, companies like Uber use sophisticated demand forecasting models, analyzing historical trip data and city-specific events to dynamically scale their infrastructure globally, ensuring reliability during massive demand surges like New Year's Eve.
10. Organizational Culture and Knowledge Sharing
SRE is a cultural operating model, not just a technical role. A successful SRE culture prioritizes reliability as a core feature, learns from failure without blame, and systematically shares operational knowledge. It breaks down the silo between software developers and operations engineers, creating shared ownership of the entire service lifecycle, from architecture and coding to deployment and production support.
This cultural foundation is a prerequisite for the other SRE best practices. Blameless postmortems cannot succeed without psychological safety. Shared ownership is impossible if developers "throw code over the wall" to a separate operations team. A strong SRE culture embeds reliability principles throughout the entire engineering organization, making it a collective responsibility.
How to Implement a Strong SRE Culture
Cultivating this mindset requires intentional effort from leadership and a commitment to new processes that encourage collaboration, transparency, and continuous improvement.
- Champion Blameless Postmortems: Leadership must consistently reinforce that postmortems are for system improvement, not for punishing individuals. A manager's role in a postmortem review is to ask, "How can I provide the team with better tools, processes, and training to prevent this?"
- Establish Formal Knowledge Sharing Rituals: Create structured forums for sharing operational knowledge. This includes holding a weekly "operations review" meeting to discuss recent incidents, publishing postmortems to a company-wide mailing list, and maintaining a centralized, version-controlled repository of runbooks and architectural decision records (ADRs).
- Embed SREs within Product Teams: Instead of a centralized SRE team that acts as a gatekeeper, embed SREs directly into product development teams. This "embedded SRE" model allows reliability expertise to influence design and architecture decisions early in the development process and helps spread SRE principles organically.
- Track and Reward Reliability Work: Make reliability work visible and valuable. Create dashboards that track metrics like toil reduction, SLO adherence, and the number of postmortem action items completed. Acknowledge and reward engineers who make significant contributions to system stability in performance reviews, on par with those who ship major features.
Key Insight: You cannot buy SRE. You can hire SREs, but true Site Reliability Engineering is a cultural shift that must be adopted and championed by the entire engineering organization.
Etsy is renowned for its influential work on building a just and blameless incident culture, which became fundamental to its operational stability and rapid innovation. Similarly, Amazon implements shared ownership through its rigorous Well-Architected Framework reviews, where teams across the organization collaboratively assess systems against reliability and operational excellence pillars. This approach ensures that knowledge and best practices are distributed widely, not hoarded within a single team.
SRE Best Practices: 10-Point Comparison
| Item | Implementation complexity | Resource requirements | Expected outcomes | Ideal use cases | Key advantages |
|---|---|---|---|---|---|
| Error Budgets | Moderate — requires SLO definition and tooling | Monitoring, SLO tracking, cross-team alignment | Balanced feature delivery and reliability decisions | Services with defined user-impact SLOs | Data-driven risk limits; prevents over‑engineering |
| SLOs and SLIs | Moderate–High — metric selection and ongoing tuning | Instrumentation, measurement systems, stakeholder buy‑in | Clear, measurable service targets; basis for policy | Customer-facing APIs and critical services | Objective success criteria; reduced alert noise |
| On‑Call Rotations and Alerting | Low–Medium to set up; ongoing tuning required | Scheduling tools, alerting platform, runbooks, staffing | Continuous coverage and faster incident response | Services requiring 24/7 support | Reduces MTTR; distributes responsibility |
| Blameless Postmortems | Low procedural; high cultural change | Time, facilitation, documentation, leadership support | Systemic fixes and organizational learning | After incidents; improving incident culture | Encourages reporting; uncovers systemic causes |
| Infrastructure as Code (IaC) | High — tooling, workflows, testing needed | Dev effort, VCS, CI/CD, IaC tools (Terraform, etc.) | Reproducible, auditable infrastructure and faster rollbacks | Multi‑env deployments, scaling and DR | Consistency, traceability, repeatable deployments |
| Observability (Monitoring/Logging/Tracing) | High — broad instrumentation and integration | Storage, APM/observability tools, expert tuning | Rapid diagnosis and insight into unknowns | Distributed systems, microservices | Deep visibility; faster root‑cause analysis |
| Automation and Runbooks | Medium–High — automation design and QA | Engineering time, automation platforms, versioned runbooks | Reduced toil and faster, consistent recoveries | High-frequency operational tasks and incidents | Scales operations; reduces human error |
| Testing in Production & Chaos Engineering | High — careful safety controls required | Observability, feature flags, experiment tooling | Validated resilience and discovered real-world weaknesses | Mature systems with rollback/safety mechanisms | Real-world confidence; exposes hidden dependencies |
| Capacity Planning & Performance Optimization | Medium — requires modeling and profiling | Historical metrics, forecasting tools, load testing | Fewer capacity-related outages and cost savings | High-traffic or cost-sensitive services | Prevents outages; optimizes resource costs |
| Organizational Culture & Knowledge Sharing | High — sustained leadership and change management | Time, training, forums, incentives, documentation | Sustainable reliability and faster team learning | Organizations scaling SRE or reliability practices | Long-term improvement, better collaboration and retention |
Final Thoughts
We've journeyed through a comprehensive landscape of Site Reliability Engineering, deconstructing the core tenets that transform reactive IT operations into proactive, data-driven reliability powerhouses. This exploration wasn't just a theoretical exercise; it was a blueprint for building resilient, scalable, and efficient systems. By now, it should be clear that adopting these SRE best practices is not about implementing a rigid set of rules but about embracing a fundamental shift in mindset. It’s about viewing reliability as the most critical feature of any product.
The practices we've covered, from defining precise Service Level Objectives (SLOs) and using Error Budgets as a currency for innovation, to codifying your entire infrastructure with IaC, are deeply interconnected. Strong SLOs are meaningless without the deep insights provided by a mature observability stack. Likewise, the most sophisticated chaos engineering experiments yield little value without the blameless postmortem culture needed to learn from induced failures. Each practice reinforces the others, creating a powerful feedback loop that continuously elevates your system's stability and your team's operational maturity.
Your Path from Theory to Implementation
The journey to SRE excellence is incremental. It begins not with a massive, all-or-nothing overhaul, but with small, strategic steps. The key is to start where you can make the most immediate impact and build momentum.
Here are your actionable next steps:
- Start the SLO Conversation: You cannot protect what you do not measure. Convene a meeting with product managers and key stakeholders to define a single, critical user journey. From there, collaboratively define your first SLI and SLO. This initial exercise will be more valuable for the cross-functional alignment it creates than for the technical perfection of the metrics themselves.
- Automate One Painful Task: Identify the most frequent, manual, and toil-heavy task your on-call engineers perform. Is it a server restart? A cache flush? A database failover? Dedicate a sprint to automating it and documenting it in a runbook. This single act will provide immediate relief and serve as a powerful proof-of-concept for the value of automation.
- Conduct Your First Blameless Postmortem: The next time a minor incident occurs, resist the urge to simply "fix it and forget it." Instead, gather the involved parties and conduct a formal blameless postmortem. Focus intensely on the "how" and "why" of systemic failures, not the "who." Document the contributing factors and assign action items to address the underlying causes. This single cultural shift is foundational to all other SRE best practices.
Reliability as a Competitive Advantage
Mastering these concepts is more than just an engineering goal; it's a strategic business imperative. In a world where user expectations for uptime and performance are non-negotiable, reliability is your brand. An outage is not just a technical problem; it's a breach of customer trust. Systems built on SRE principles are not just more stable; they enable faster, safer feature deployment, reduce operational overhead, and free up your most talented engineers to build value instead of fighting fires.
Ultimately, SRE is about building a sustainable operational model that scales with your ambition. It’s the engineering discipline that ensures the promises your product makes to its users are promises you can keep, day in and day out. By embarking on this journey, you are not just preventing failures; you are engineering success.
Navigating the complexities of implementing these SRE best practices can be challenging, especially when you need to focus on core product development. If you're looking to accelerate your SRE adoption with expert guidance and hands-on support, OpsMoon provides dedicated, on-demand DevOps and SRE expertise. We help you build and manage resilient, scalable infrastructure so you can innovate with confidence. Learn more at OpsMoon.
Leave a Reply