In any distributed system, from sprawling microservice architectures to containerized platforms like Kubernetes, services must dynamically locate and communicate with each other. The automated mechanism that enables this is service discovery. It's the process by which services register their network locations and discover the locations of other services without manual intervention or hardcoded configuration files.
At its core, service discovery relies on a specialized, highly available key-value store known as a service registry. This registry maintains a real-time database of every available service instance, its network endpoint (IP address and port), and its operational health status, making it the single source of truth for service connectivity.
Why Static Configurations Fail in Modern Architectures
Consider a traditional monolithic application deployed on a set of virtual machines with static IP addresses. In this environment, configuring service communication was straightforward: you'd simply hardcode the IP address of a database or an upstream API into a properties file. This static approach worked because the infrastructure was largely immutable.
Modern cloud-native architectures, however, are fundamentally dynamic and ephemeral. Static configuration is not just inefficient; it's a direct path to system failure.
- Autoscaling: Container orchestrators and cloud platforms automatically scale services horizontally based on load. New instances are provisioned with dynamically assigned IP addresses and must be immediately discoverable.
- Failures and Redeployment: When an instance fails a health check, it is terminated and replaced by a new one, which will have a different network location. Automated healing requires automated discovery.
- Containerization: Technologies like Docker and container orchestration platforms like Kubernetes abstract away the underlying host, making service locations even more fluid and unpredictable. An IP address is tied to a container, which is a transient entity.
Attempting to manage this dynamism with static IP addresses and manual configuration changes would require constant updates and redeployments, introducing significant operational overhead and unacceptable downtime. Service discovery solves this by providing a programmatic and automated way to handle these constant changes.
The Role of a Central Directory
To manage this complexity, service discovery introduces a central, reliable component: the service registry. This registry functions as a live, real-time directory for all network endpoints within a system. When a new service instance is instantiated, it programmatically registers itself, publishing its network location (IP address and port), health check endpoint, and other metadata.
A service registry acts as the single source of truth for all service locations. It ensures that any service needing to communicate with another can always query a reliable, up-to-date directory to find a healthy target.
When that service instance terminates or becomes unhealthy, it is automatically deregistered. This dynamic registration and deregistration cycle is critical for building resilient, fault-tolerant applications, as it prevents traffic from being routed to non-existent or failing instances. For a deeper dive into the architectural principles at play, our guide on understanding distributed systems provides essential context.
While our focus is on microservices, this concept is broadly applicable. For example, similar principles are used for discovery within IT Operations Management (ITOM), where the goal is to map infrastructure assets dynamically. Ultimately, without automated discovery, modern distributed systems would be too brittle and operationally complex to function at scale.
Understanding the Core Service Discovery Patterns
With a service registry established as the dynamic directory, the next question is how client services interact with it to find the services they need. The implementation of this interaction is defined by two primary architectural patterns: client-side discovery and server-side discovery.
The fundamental difference lies in where the discovery logic resides. Is the client application responsible for querying the registry and selecting a target instance, or is this logic abstracted away into a dedicated network component like a load balancer or proxy? The choice has significant implications for application code, network topology, and operational complexity.
This flow chart illustrates the basic concept: a new service instance registers with the registry, making it discoverable by other services that need to consume it.
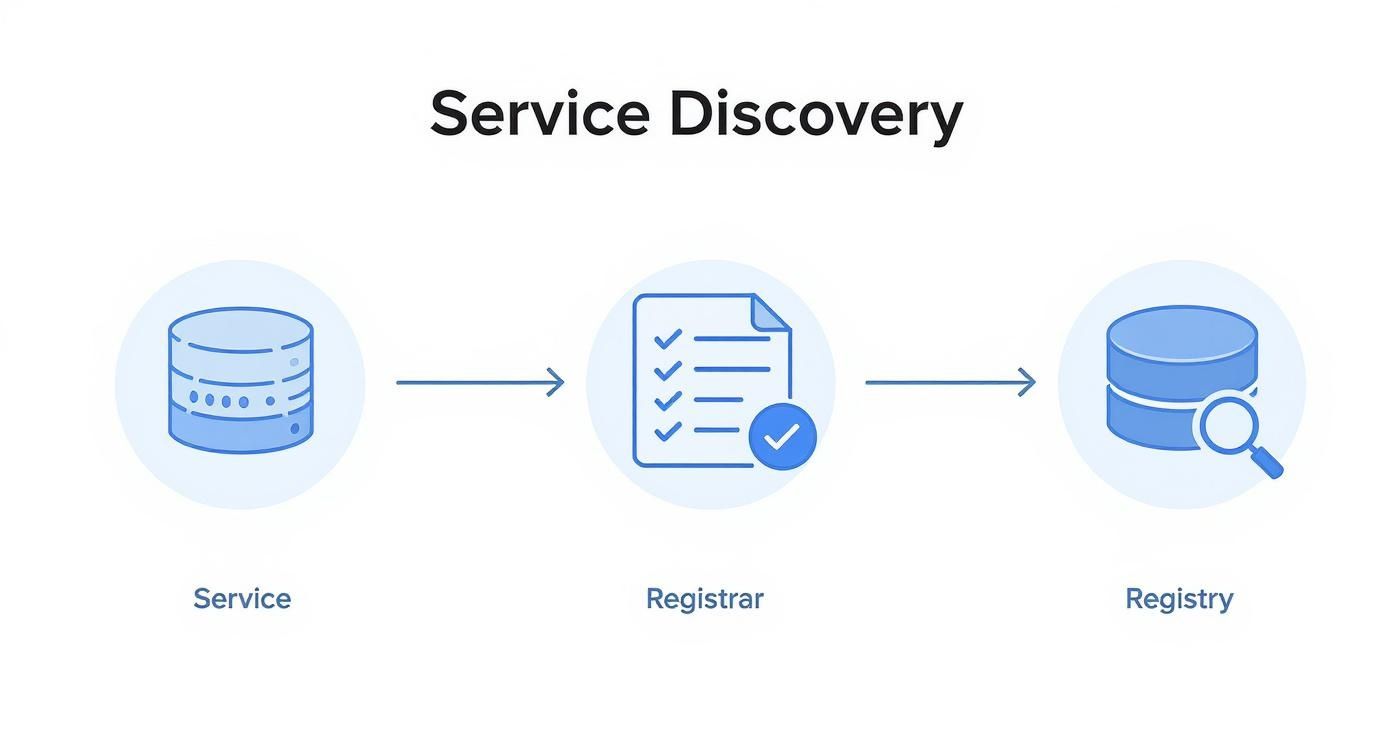
The registry acts as the broker, decoupling service producers from service consumers.
Client-Side Service Discovery
In the client-side discovery pattern, the client application contains all the logic required to interact with the service registry. The responsibility for discovering and connecting to a downstream service rests entirely within the client's codebase.
The process typically involves these steps:
- Query the Registry: The client service (e.g., an
order-service) directly queries the service registry (like HashiCorp Consul or Eureka) for the network locations of a target service (e.g.,payment-service). - Select an Instance: The registry returns a list of healthy instances (IPs and ports). The client then applies a load-balancing algorithm (e.g., round-robin, least connections, latency-weighted) to select a single instance from the list.
- Direct Connection: The client makes a direct network request to the selected instance's IP address and port.
With client-side discovery, the application is "discovery-aware." It embeds a library or client that handles registry interaction, instance selection, and connection management, including retries and failover.
The Netflix OSS stack is a classic example of this pattern. A service uses a dedicated Eureka client library to communicate with the Eureka registry, and the Ribbon library provides sophisticated client-side load-balancing capabilities.
The advantage of this pattern is direct control and the elimination of an extra network hop. However, it tightly couples the application to the discovery infrastructure. You must maintain discovery client libraries for every language and framework in your stack, which can increase maintenance overhead.
Server-Side Service Discovery
In contrast, server-side discovery abstracts the discovery logic out of the client application and into a dedicated infrastructure component, such as a load balancer, reverse proxy, or API gateway.
The workflow is as follows:
- Request to a Virtual Address: The client sends its request to a stable, well-known endpoint (e.g., a virtual IP or a DNS name like
payment-service.internal-proxy). This endpoint is managed by the proxy/load balancer. - Proxy-led Discovery: The proxy intercepts the request. It is the component responsible for querying the service registry to fetch the list of healthy backend instances.
- Routing and Forwarding: The proxy applies its own load-balancing logic to select an instance and forwards the client's request to it.
The client application is completely oblivious to the service registry's existence; its only dependency is the static address of the proxy. This is the predominant model in modern cloud platforms. An AWS Elastic Load Balancer (ELB) routing traffic to an Auto Scaling Group is a prime example of server-side discovery.
Similarly, in Kubernetes, a Service object provides a stable virtual IP (ClusterIP) and DNS name that acts as a proxy. When a client Pod sends a request to this service name, the request is intercepted by kube-proxy, which transparently routes it to a healthy backend Pod. The discovery and load balancing are handled by the platform, not the application. For more details on this, see our guide on microservices architecture design patterns.
Comparing the Two Patterns
The choice between these patterns involves a clear trade-off between application complexity and infrastructure complexity.
| Aspect | Client-Side Discovery | Server-Side Discovery |
|---|---|---|
| Discovery Logic | Embedded within the client application's code. | Centralized in a network proxy, load balancer, or gateway. |
| Client Complexity | High. Requires a specific client library for registry interaction and load balancing. | Low. The client only needs to know a static endpoint; it is "discovery-unaware." |
| Network Hops | Fewer. The client connects directly to the target service instance. | More. An additional network hop is introduced through the proxy. |
| Technology Coupling | High. Tightly couples the application to a specific service discovery implementation. | Low. Decouples the application from the underlying discovery mechanism. |
| Control | High. Developers have granular control over load-balancing strategies within the application. | Low. Control is centralized in the proxy, abstracting it from developers. |
| Common Tools | Netflix Eureka + Ribbon, HashiCorp Consul (with client library) | Kubernetes Services, AWS ELB, NGINX, API Gateways (e.g., Kong, Traefik) |
Server-side discovery is now the more common pattern, as it aligns better with the DevOps philosophy of abstracting infrastructure concerns away from application code. However, client-side discovery can still be advantageous in performance-critical scenarios where minimizing network latency is paramount.
The Service Registry: Your System's Dynamic Directory
The service registry is the cornerstone of any service discovery mechanism. It is a highly available, distributed database specifically designed to store and serve information about service instances, including their network locations and health status. This registry becomes the definitive source of truth that enables the dynamic wiring of distributed systems.
Without a registry, services would have no reliable way to find each other in an ephemeral environment. A consumer service queries the registry to obtain a list of healthy producers, forming the foundation for both client-side and server-side discovery patterns.
A registry is not a static list; it's a living database that must accurately reflect the system's state in real-time. This is achieved through two core processes: service registration and health checking.
How Services Register Themselves
When a new service instance starts, its first task is to perform service registration. The instance sends a request to the registry API, providing essential metadata about itself.
This payload typically includes:
- Service Name: The logical identifier of the service (e.g.,
user-api). - Network Location: The specific IP address and port where the service is listening for traffic.
- Health Check Endpoint: A URL (e.g.,
/healthz) that the registry can poll to verify the instance's health. - Metadata: Optional key-value pairs for additional information, such as version, region, or environment tags.
The registry receives this information and adds the new instance to its catalog of available endpoints for that service. This is typically implemented via a self-registration pattern, where the instance itself is responsible for this action, often during its bootstrap sequence.
The Critical Role of Health Checks
Knowing that a service instance exists is insufficient; the registry must know if it is capable of serving traffic. An instance could be running but stuck, overloaded, or unable to connect to its own dependencies. Sending traffic to such an instance leads to errors and potential cascading failures. Health checks are the mechanism to prevent this.
The service registry's most important job isn't just knowing where services are; it's knowing which services are actually working. An outdated or inaccurate registry is more dangerous than no registry at all.
The registry continuously validates the health of every registered instance. If an instance fails a health check, the registry marks it as unhealthy and immediately removes it from the pool of discoverable endpoints. This deregistration is what ensures system resilience.
Common health checking strategies include:
- Heartbeating (TTL): The service instance is responsible for periodically sending a "heartbeat" signal to the registry. If the registry doesn't receive a heartbeat within a configured Time-To-Live (TTL) period, it marks the instance as unhealthy.
- Active Polling: The registry actively polls a specific health check endpoint (e.g., an HTTP
/healthURL) on the service instance. A successful response (e.g., HTTP 200 OK) indicates health. - Agent-Based Checks: A local agent running alongside the service performs more sophisticated checks (e.g., checking CPU load, memory usage, or script execution) and reports the status back to the central registry.
Consistency vs. Availability: The CAP Theorem Dilemma
Choosing a service registry technology forces a confrontation with the CAP theorem, a fundamental principle of distributed systems. The theorem states that a distributed data store can only provide two of the following three guarantees:
- Consistency (C): Every read receives the most recent write or an error.
- Availability (A): Every request receives a (non-error) response, without the guarantee that it contains the most recent write.
- Partition Tolerance (P): The system continues to operate despite network partitions (dropped messages between nodes).
Since network partitions are a given in any distributed environment, the real choice is between consistency and availability.
- CP Systems (Consistency & Partition Tolerance): Tools like Consul and etcd prioritize strong consistency. During a network partition, they may become unavailable for writes to prevent data divergence. They guarantee that if you get a response, it is the correct, most up-to-date data.
- AP Systems (Availability & Partition Tolerance): Tools like Eureka prioritize availability. During a partition, nodes will continue to serve discovery requests from their local cache, even if that data might be stale. This maximizes uptime but introduces a small risk of clients being directed to a failed instance.
This is a critical architectural decision. A system requiring strict transactional integrity or acting as a control plane (like Kubernetes) must choose a CP system. A system where uptime is paramount and clients can tolerate occasional stale reads might prefer an AP system.
A Practical Comparison of Service Discovery Tools
Selecting a service discovery tool is a foundational architectural decision with long-term consequences for system resilience, operational complexity, and scalability. While many tools perform the same basic function, their underlying consensus models and feature sets vary significantly.
Let's analyze four prominent tools: Consul, etcd, Apache ZooKeeper, and Eureka. The primary differentiator among them is their position on the CAP theorem spectrum—whether they favor strong consistency (CP) or high availability (AP). This choice dictates system behavior during network partitions, which are an inevitable part of distributed computing.
Consul: The All-in-One Powerhouse
HashiCorp's Consul is a comprehensive service networking platform that provides service discovery, a key-value store, health checking, and service mesh capabilities in a single tool.
Consul uses the Raft consensus algorithm to ensure strong consistency, making it a CP system. In the event of a network partition that prevents a leader from being elected, Consul will become unavailable for writes to guarantee data integrity. This makes it ideal for systems where an authoritative and correct state is non-negotiable.
Key features include:
- Advanced Health Checking: Supports multiple check types, including script-based, HTTP, TCP, and Time-to-Live (TTL).
- Built-in KV Store: A hierarchical key-value store for dynamic configuration, feature flagging, and leader election.
- Multi-Datacenter Federation: Natively supports connecting multiple data centers over a WAN, allowing for cross-region service discovery.
etcd: The Heartbeat of Kubernetes
Developed by CoreOS (now Red Hat), etcd is a distributed, reliable key-value store designed for strong consistency and high availability. Like Consul, it uses the Raft consensus algorithm, classifying it as a CP system.
While etcd can be used as a general-purpose service registry, it is most famous for being the primary data store for Kubernetes. It stores the entire state of a Kubernetes cluster, including all objects like Pods, Services, Deployments, and ConfigMaps. The Kubernetes API server is its primary client.
Every
kubectl applycommand results in a write to etcd, and everykubectl getcommand is a read. Its central role in Kubernetes is a testament to its reliability for building consistent control planes.
Its simple HTTP/gRPC API and focus on being a minimal, reliable building block make it a strong choice for custom distributed systems that require strong consistency.
Apache ZooKeeper: The grizzled veteran
Apache ZooKeeper is a mature, battle-tested centralized service for maintaining configuration information, naming, providing distributed synchronization, and providing group services. It was a foundational component for large-scale systems like Hadoop and Kafka.
ZooKeeper uses the ZooKeeper Atomic Broadcast (ZAB) protocol, which is functionally similar to Paxos and Raft, making it a CP system that prioritizes consistency. During a partition, a ZooKeeper "ensemble" will not serve requests if it cannot achieve a quorum, thus preventing stale reads.
Its data model is a hierarchical namespace of "znodes," similar to a file system, which clients can manipulate and watch for changes. While powerful, its operational complexity and older API have led many newer projects to adopt more modern alternatives like etcd or Consul.
Eureka: All About Availability
Developed and open-sourced by Netflix, Eureka takes a different approach. It is an AP system, prioritizing availability and partition tolerance over strong consistency.
Eureka eschews consensus algorithms like Raft. Instead, it uses a peer-to-peer replication model where every node replicates information to every other node. If a network partition occurs, isolated nodes continue to serve discovery requests based on their last known state (local cache).
This design reflects Netflix's philosophy that it is better for a service to receive a slightly stale list of instances (and handle potential connection failures gracefully) than to receive no list at all. This makes Eureka an excellent choice for applications where maximizing uptime is the primary goal, and the application layer is built to be resilient to occasional inconsistencies.
Feature Comparison of Leading Service Discovery Tools
The ideal tool depends on your system's specific requirements for consistency and resilience. The table below summarizes the key differences.
| Tool | Consistency Model | Primary Use Case | Key Features |
|---|---|---|---|
| Consul | Strong (CP) via Raft | All-in-one service networking | KV store, multi-datacenter, service mesh |
| etcd | Strong (CP) via Raft | Kubernetes data store, reliable KV store | Simple API, proven reliability, lightweight |
| ZooKeeper | Strong (CP) via ZAB | Distributed system coordination | Hierarchical namespace, mature, battle-tested |
| Eureka | Eventual (AP) via P2P Replication | High-availability discovery | Prefers availability over consistency |
For systems requiring an authoritative source of truth, a CP tool like Consul or etcd is the correct choice. For user-facing systems where high availability is paramount, Eureka's AP model offers a compelling alternative.
How Service Discovery Works in Kubernetes
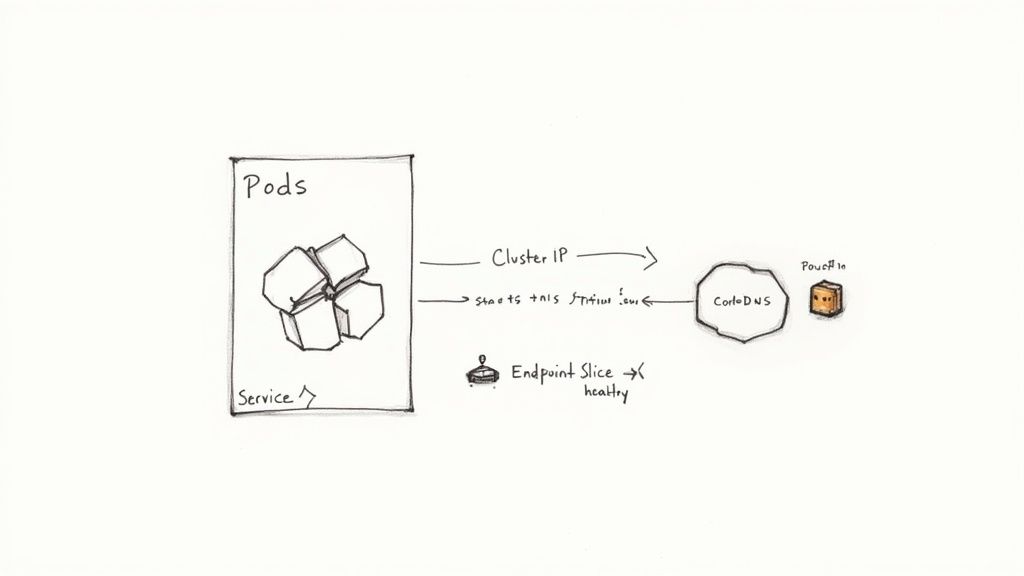
Kubernetes provides a powerful, out-of-the-box implementation of server-side service discovery that is deeply integrated into its networking model. In a Kubernetes cluster, applications run in Pods, which are ephemeral and assigned dynamic IP addresses. Manually tracking these IPs would be impossible at scale.
To solve this, Kubernetes introduces a higher-level abstraction called a Service. A Service provides a stable, virtual IP address and a DNS name that acts as a durable endpoint for a logical set of Pods. Client applications connect to the Service, which then intelligently load-balances traffic to the healthy backend Pods associated with it.
This abstraction decouples service consumers from the transient nature of individual Pods, enabling robust cloud-native application development.
The Core Components: ClusterIP and CoreDNS
By default, creating a Service generates one of type ClusterIP. Kubernetes assigns it a stable virtual IP address that is routable only from within the cluster.
To complement this, Kubernetes runs an internal DNS server, typically CoreDNS. When a Service is created, CoreDNS automatically generates a DNS A record mapping the service name to its ClusterIP. This allows any Pod in the cluster to resolve the Service using a predictable DNS name.
For example, a Service named my-api in the default namespace is assigned a fully qualified domain name (FQDN) of:my-api.default.svc.cluster.local
Pods within the same default namespace can simply connect to my-api, and the internal DNS resolver will handle the resolution to the correct ClusterIP. This DNS-based discovery is the standard and recommended pattern in Kubernetes.
A Practical YAML Manifest Example
Services are defined declaratively using YAML manifests. Consider a Deployment managing three replicas of a backend API. Note the app: my-api label, which is the key to linking the Pods to the Service.
apiVersion: apps/v1
kind: Deployment
metadata:
  name: my-api-deployment
spec:
  replicas: 3
  selector:
    matchLabels:
      app: my-api
  template:
    metadata:
      labels:
        app: my-api
    spec:
      containers:
      - name: api-container
        image: my-api-image:v1
        ports:
        - containerPort: 8080
Next, the Service is created to expose the Deployment. The selector field in the Service manifest (app: my-api) must match the labels of the Pods it is intended to target.
apiVersion: v1
kind: Service
metadata:
  name: my-api-service
spec:
  selector:
    app: my-api
  ports:
    - protocol: TCP
      port: 80       # Port the service is exposed on
      targetPort: 8080 # Port the container is listening on
  type: ClusterIP
When this YAML is applied, Kubernetes creates a Service named my-api-service with a ClusterIP. It listens on port 80 and forwards traffic to port 8080 on any healthy Pod with the app: my-api label.
The Role of Kube-Proxy and EndpointSlices
The translation from the virtual ClusterIP to a real Pod IP is handled by a daemon called kube-proxy, which runs on every node in the cluster.
kube-proxyis the network agent that implements the Service abstraction. It watches the Kubernetes API server for changes to Service and EndpointSlice objects and programs the node's networking rules (typically using iptables, IPVS, or eBPF) to correctly route and load-balance traffic.
Initially, for each Service, Kubernetes maintained a single Endpoints object containing the IP addresses of all matching Pods. This became a scalability bottleneck in large clusters, as updating a single Pod required rewriting the entire massive Endpoints object.
To address this, Kubernetes introduced EndpointSlice objects. EndpointSlices split the endpoints for a single Service into smaller, more manageable chunks. Now, when a Pod is added or removed, only a small EndpointSlice object needs to be updated, drastically improving performance and scalability.
This combination of a stable Service (with its ClusterIP and DNS name), kube-proxy for network programming, and scalable EndpointSlices provides a robust, fully automated service discovery system that is fundamental to Kubernetes.
Beyond the Basics: Building a Resilient Service Discovery Layer
Implementing a service discovery tool is only the first step. To build a production-grade, resilient system, you must address security, observability, and failure modes. A misconfigured or unmonitored service discovery layer can transform from a single source of truth into a single point of failure.
Securing the Service Discovery Plane
Communication between services and the registry is a prime attack vector. Unsecured traffic can lead to sensitive data exposure or malicious service registration, compromising the entire system.
Two security practices are non-negotiable:
- Mutual TLS (mTLS): Enforces cryptographic verification of both the client (service) and server (registry) identities before any communication occurs. It also encrypts all data in transit, preventing eavesdropping and man-in-the-middle attacks.
- Access Control Lists (ACLs): Provide granular authorization, defining which services can register themselves (write permissions) and which can discover other services (read permissions). ACLs are essential for isolating environments and enforcing the principle of least privilege.
Security in service discovery is not an add-on; it is a foundational requirement. mTLS and ACLs should be considered the minimum baseline for protecting your architecture's central nervous system.
Observability and Dodging Common Pitfalls
Effective observability is crucial for maintaining trust in your service discovery system. Monitoring key metrics provides the insight needed to detect and mitigate issues before they cause outages.
Key metrics to monitor include:
- Registry Health: For consensus-based systems like Consul or etcd, monitor leader election churn and commit latency. For all registries, track API query latency and error rates. A slow or unhealthy registry will degrade the performance of the entire system.
- Registration Churn: A high rate of service registrations and deregistrations ("flapping") often indicates underlying application instability, misconfigured health checks, or resource contention.
Common pitfalls to avoid include poorly configured health check Time-To-Live (TTL) values, which can lead to stale data in the registry, and failing to plan for split-brain scenarios during network partitions, particularly with AP systems. Designing robust, multi-faceted health checks and understanding the consistency guarantees of your chosen tool are critical for building a system that is resilient in practice, not just in theory.
Frequently Asked Questions About Service Discovery
We've covered the technical underpinnings of service discovery. Here are answers to common questions that arise during practical implementation.
What's the Difference Between Service Discovery and a Load Balancer?
They are distinct but complementary components. A load balancer distributes incoming network traffic across a set of backend servers. Service discovery is the process that provides the load balancer with the dynamic list of healthy backend servers.
In a modern architecture, the load balancer queries the service registry to get the real-time list of available service instances. The service discovery mechanism finds the available targets, and the load balancer distributes work among them.
How Does Service Discovery Handle Service Failures?
This is a core function of service discovery and is essential for building self-healing systems. The service registry continuously performs health checks on every registered service instance.
When an instance fails a health check (e.g., stops responding to a health endpoint or its heartbeat TTL expires), the registry immediately removes it from the pool of available instances. This automatic deregistration ensures that no new traffic is routed to the failed instance, preventing cascading failures and maintaining overall application availability.
Can't I Just Use DNS for Service Discovery?
While DNS is a form of discovery (resolving a name to an IP), traditional DNS is ill-suited for the dynamic nature of microservices. The primary issue is caching. DNS records have a Time-To-Live (TTL) that instructs clients on how long to cache a resolved IP address. In a dynamic environment, a long TTL can cause clients to hold onto the IP of a service instance that has already been terminated and replaced.
Modern systems like Kubernetes use an integrated DNS server with very low TTLs and an API-driven control plane to mitigate this. More importantly, a true service discovery system provides critical features that DNS lacks, such as integrated health checking, service metadata, and a programmatic API for registration, which are essential for cloud-native applications.
Ready to build a resilient, scalable infrastructure without the operational overhead? The experts at OpsMoon can help you design and implement the right service discovery strategy for your needs. Schedule your free work planning session to create a clear roadmap for your DevOps success.
Leave a Reply