Successfully deploying to production is the final, critical step in the software development lifecycle, where tested code is migrated from a development environment to a live server accessible by end-users. A successful deployment hinges on a robust foundation of well-defined environments, strict version control protocols, and comprehensive automation. Without these, a release becomes a high-stakes gamble rather than a predictable, routine operation.
Setting the Stage for a Seamless Deployment
Pushing code live is the culmination of a highly structured process. Before any new code reaches a user, foundational work must be executed to guarantee stability, security, and predictability. Bypassing these preliminary steps is analogous to constructing a building without architectural blueprints—it invites catastrophic failure. The objective is to transform every deployment into a routine, non-eventful process, eliminating the need for high-stress, all-hands-on-deck interventions.
This level of preparation is non-negotiable for modern software engineering teams. The global software development market is projected to expand from approximately $524.16 billion in 2025 to over $1.03 trillion by 2032. This growth is driven by an insatiable demand for rapid and reliable software delivery. A significant portion of this market, particularly in cloud-native software, depends on executing deployments flawlessly and consistently.
Differentiating Your Environments
A common and catastrophic failure mode is the use of a single, undifferentiated environment for development, testing, and production. Professional teams enforce strict logical and physical separation between at least three core environments to isolate risk and enforce quality control gates.
Here is a technical breakdown of a standard environment topology:
Comparing Key Deployment Environments
| Environment | Primary Purpose | Data Source | Typical Access Level |
|---|---|---|---|
| Development | Sandbox for writing and unit testing new code on local machines or ephemeral cloud instances. | Mock data, seeded databases, or lightweight fixtures. | Unrestricted shell and database access for developers. |
| Staging | A 1:1 mirror of production for final QA, integration tests, performance load testing, and User Acceptance Testing (UAT). | Anonymized production data or a recent sanitized snapshot. | Limited to QA engineers, Product Managers, and DevOps via CI/CD pipelines. |
| Production | The live environment serving real users and handling real transaction traffic. | Live customer data. | Highly restricted, often with Just-In-Time (JIT) access for senior engineers and on-call SREs. |
This table delineates the distinct roles each environment serves. The cardinal rule is that code promotion must be unidirectional: from Development, to Staging, and finally to Production.
Maintaining configuration parity between Staging and Production is mission-critical. Discrepancies in OS versions, database engine patches, or library dependencies invalidate staging tests. You must validate code in an environment that is identical to the production environment, down to the network policies and environment variables.
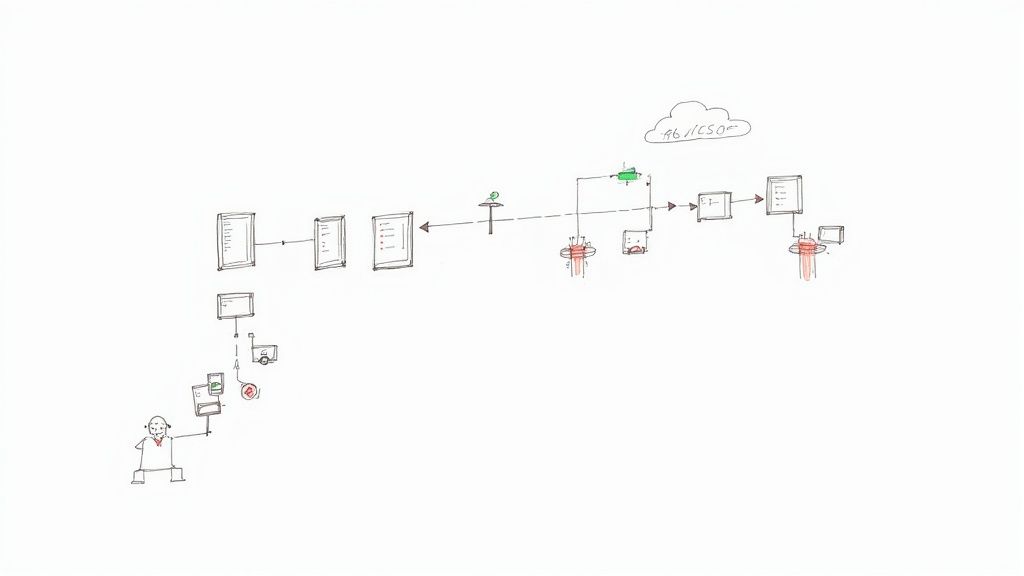
This diagram from GitHub Actions illustrates a typical automated workflow. It visualizes how code progresses from a git commit, through automated builds and tests, before being staged for a production release. This level of automation is a key differentiator between amateur and professional operations.
Mastering Version Control with Git
Version control is the central nervous system of a deployment strategy. Adopting a battle-tested Git branching model, such as GitFlow or the simpler Trunk-Based Development, provides the necessary structure and traceability for rapid, yet safe, releases.
Any robust branching strategy must include:
- A
main(ormaster) branch that is always a direct, deployable representation of stable production code. All commits tomainmust pass all CI checks. - Short-lived feature branches (e.g.,
feature/user-auth-jwt) for isolated development. These are merged into adevelopormainbranch after review. - A mandatory code review process enforced via pull requests (PRs). No code should be merged into the
mainbranch without peer review and passing automated status checks.
A comprehensive approach to SaaS operations management forms the bedrock for achieving seamless and successful production deployments. It integrates environment management, version control, and automation into a cohesive strategy that minimizes risk and maximizes release velocity.
Building Your Automated CI/CD Pipeline
Transitioning from manual to automated deployments is the single most impactful optimization for improving release velocity and reducing human error. Manual processes are notoriously slow, inconsistent, and prone to configuration drift. An automated Continuous Integration and Continuous Deployment (CI/CD) pipeline codifies the release process, making every deploy to production predictable, repeatable, and auditable.
The core principle is simple: after a developer commits code, a series of automated actions are triggered. This includes compiling the application, executing a battery of automated tests, and packaging the build artifact for deployment. This hands-off methodology ensures every change is subjected to the same rigorous quality standards before it can be promoted to a live environment.
The Anatomy of a Modern Pipeline
A robust CI/CD pipeline functions like a software assembly line, composed of discrete stages that execute sequentially, with each stage acting as a quality gate for the next.
This diagram illustrates the critical pre-deployment workflow, from version control and peer review to final production configuration management.

Adherence to such a structured process is paramount for vetting every change, thereby drastically reducing the risk of deploying bugs or regressions.
The canonical stages of a pipeline include:
- Build Stage: Triggered by a
git push, the CI server checks out the latest code. It compiles source code, resolves dependencies using managers like Maven or npm, and generates a build artifact (e.g., a JAR file, a static web bundle, or a binary). - Test Stage: This is the primary quality gate. The pipeline executes a multi-layered test suite: fast unit tests for code-level logic, integration tests to verify component interactions, and end-to-end (E2E) tests that simulate user workflows via frameworks like Cypress or Selenium. A single test failure halts the pipeline and fails the build.
- Package Stage: Upon successful test completion, the artifact is packaged for deployment. The current industry standard is to containerize the application using Docker. This process creates a lightweight, immutable Docker image containing the application and all its runtime dependencies, ready for distribution to a container registry.
This level of automation is becoming ubiquitous. Global spending on enterprise software is projected to hit $1.25 trillion by 2025, with a significant portion allocated to tools that accelerate software delivery. With 92% of US developers already using AI-powered coding tools, the drive for more efficient, automated pipelines has never been stronger.
A Practical Example with GitHub Actions
Here is a concrete implementation of these stages using GitHub Actions. The pipeline is defined in a YAML file (e.g., .github/workflows/deploy.yml) within the repository.
This example outlines a CI workflow for a Node.js application:
name: CI/CD Pipeline

on:
  push:
    branches: [ main ]

jobs:
  build-and-test:
    runs-on: ubuntu-latest
    steps:
      - name: Checkout code
        uses: actions/checkout@v3

      - name: Setup Node.js
        uses: actions/setup-node@v3
        with:
          node-version: '18'
          cache: 'npm'

      - name: Install dependencies
        run: npm ci

      - name: Run unit and integration tests
        run: npm test

  package-and-deploy:
    needs: build-and-test
    runs-on: ubuntu-latest
    steps:
      - name: Checkout code
        uses: actions/checkout@v3

      - name: Log in to Docker Hub
        uses: docker/login-action@v2
        with:
          username: ${{ secrets.DOCKER_USERNAME }}
          password: ${{ secrets.DOCKER_PASSWORD }}

      - name: Build and push Docker image
        uses: docker/build-push-action@v4
        with:
          context: .
          push: true
          tags: your-username/your-app:latest
This workflow triggers on any push to the main branch. The build-and-test job checks out the code, installs dependencies using npm ci for faster, deterministic builds, and runs the test suite. If it succeeds, the package-and-deploy job builds a Docker image and pushes it to a container registry like Docker Hub.
Managing Secrets and Configuration
Production-grade pipelines require a secure mechanism for managing sensitive data like API keys, database credentials, and TLS certificates. Hardcoding secrets in source code or CI scripts is a severe security vulnerability and must be avoided.
Utilize the secret management features native to your CI/CD platform or a dedicated secrets manager like HashiCorp Vault. GitHub Actions provides encrypted secrets that can be injected into the pipeline as environment variables (e.g., ${{ secrets.DOCKER_PASSWORD }}). This approach prevents secrets from being exposed in logs or version control history.
Key Takeaway: The primary objective of a CI/CD pipeline is to make deployments deterministic and "boring." By automating the build, test, and packaging stages, you establish a reliable and efficient path to production that eliminates manual error and minimizes risk.
To further harden your pipeline, incorporate Infrastructure as Code best practices. This allows you to manage infrastructure with the same version control and automation principles used for application code. For a more detailed guide, see our article on CI/CD pipeline best practices.
Choosing the Right Deployment Strategy
The methodology used to deploy to production is a critical engineering and business decision that directly impacts system availability and user experience. The optimal strategy minimizes risk, prevents downtime, and maintains customer trust. A poorly chosen strategy leads to service outages, emergency rollbacks, and reputational damage.
The ideal method is contingent upon your application's architecture, risk tolerance, and infrastructure capabilities. There is no one-size-fits-all solution.
Let's dissect the most prevalent deployment strategies, examining their technical implementation, infrastructure requirements, and ideal use cases. This analysis will equip you to make an informed decision for your release process.
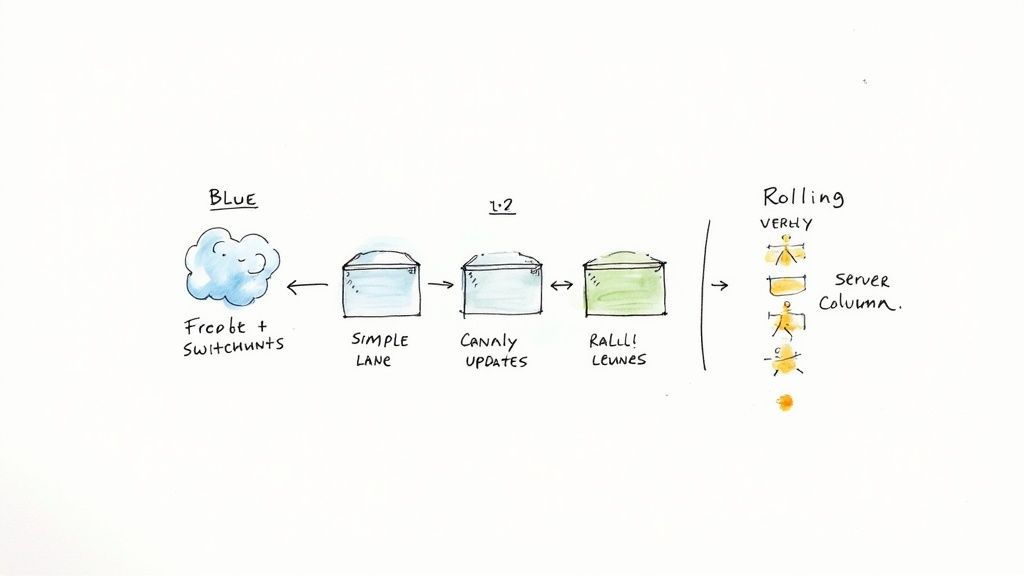
Blue-Green Deployments for Zero Downtime
For applications requiring true zero-downtime releases, the Blue-Green strategy is the gold standard. It involves maintaining two identical, isolated production environments: "Blue" (the current live version) and "Green" (the new candidate version).
The execution flow is as follows:
- Deploy to Green: The new application version is deployed to the Green environment. This environment is fully operational but does not receive live user traffic.
- Full Validation: The Green environment undergoes rigorous validation. This includes running a full suite of integration tests, smoke tests, and performance benchmarks against a production-like configuration, all without impacting live users.
- Flip the Switch: Once the Green environment is fully validated, the load balancer or router configuration is updated to redirect all incoming traffic from Blue to Green. This traffic shift is instantaneous.
The old Blue environment is kept on standby, providing an immediate rollback path. If post-deployment monitoring reveals critical issues, traffic can be instantly routed back to Blue. The primary disadvantage is the high operational cost, as it requires maintaining double the production infrastructure capacity.
Canary Releases for Gradual Exposure
A Canary release is a more risk-averse strategy designed to validate new features with a small subset of real users before a full rollout. The name is an analogy for the "canary in a coal mine," where the small user group serves as an early warning system for potential problems.
This strategy involves routing a small percentage of traffic (e.g., 5%) to the new version ("canary") while the majority remains on the stable version. Key performance indicators (KPIs) for the canary instances—such as error rates, API latency, and CPU/memory utilization—are closely monitored. If metrics remain healthy, traffic is incrementally increased (e.g., to 25%, then 50%) until it reaches 100%.
This incremental exposure is a powerful technique to de-risk a major deploy to production. It allows you to detect performance bottlenecks or subtle bugs that only manifest under real-world load, effectively limiting the blast radius of any failure.
Service mesh tools like Istio or Linkerd are often used to manage the sophisticated traffic splitting required for canary releases. However, this approach introduces complexity, as it requires maintaining multiple application versions in production simultaneously, which can complicate database schema management and require backward compatibility.
Rolling Deployments for Simplicity
A Rolling deployment is one of the most common and straightforward strategies. Instead of a simultaneous update, it gradually replaces old application instances with new ones in a phased manner.
For example, in a cluster of ten application servers, a rolling update might replace them two at a time. It de-registers two old instances from the load balancer, deploys the new version, waits for them to pass health checks, and then proceeds to the next pair until all instances are updated.
The main advantage is its simplicity and lower infrastructure cost compared to Blue-Green. Application availability is maintained as only a fraction of capacity is offline at any given time. The downside is that for a transient period, both old and new code versions are running concurrently, which can introduce compatibility issues. Rollbacks are also more complex, typically requiring another rolling deployment of the previous version.
Deployment Strategy Trade-Offs
Selecting the right strategy is a matter of balancing risk, cost, and operational complexity. This table summarizes the key trade-offs:
| Strategy | Downtime Risk | Rollback Complexity | Infrastructure Cost | Ideal Use Case |
|---|---|---|---|---|
| Blue-Green | Very Low | Very Low (Instant) | High (2x Prod) | Critical applications where any downtime is unacceptable. |
| Canary | Low | Low (Redirect traffic) | Medium-High | Validating high-risk features with a subset of real users. |
| Rolling | Medium | Medium (Requires redeploy) | Low | Stateless applications where temporary version mismatches are safe. |
Ultimately, your choice should align with your team's operational maturity and your application's requirements. For teams just getting their sea legs, a Rolling deployment is a fantastic starting point. As your systems grow more critical, exploring Blue-Green or Canary strategies becomes less of a luxury and more of a necessity.
To go deeper, you can learn more about these zero-downtime deployment strategies and see which one really fits your architecture best.
Mastering Post-Deployment Monitoring and Observability
Deploying code to production is not the finish line; it's the starting point for ongoing operational responsibility. Post-deployment, the focus shifts to performance, stability, and reliability. This requires moving beyond basic monitoring (is the server up?) to deep system observability (why is the p99 latency for this specific API endpoint increasing for users in this region?).
Deploying code without a clear view of its real-world impact is negligent. It is imperative to have tooling and strategies in place to understand not just if something is wrong, but why it is wrong—ideally before users are impacted.
From Monitoring to True Observability
Traditional monitoring excels at tracking "known unknowns"—predefined failure conditions like CPU saturation or disk exhaustion. Observability, however, is about equipping you to investigate "unknown unknowns"—novel failure modes you couldn't anticipate. It is the ability to ask arbitrary questions about your system's state without needing to ship new code to answer them.
Observability is built upon three pillars of telemetry data:
- Logs: Granular, timestamped records of discrete events. These are invaluable for debugging specific errors or tracing the execution path of a single transaction.
- Metrics: Aggregated numerical data over time, such as requests per second or API error rates. Metrics are ideal for dashboards, trend analysis, and alerting on high-level system health.
- Traces: A complete, end-to-end view of a single request as it propagates through a distributed system or microservices architecture. Traces are essential for identifying performance bottlenecks and understanding inter-service dependencies.
By instrumenting your application to emit this telemetry, you build a rich, queryable model of your system's internal state.
Observability isn't just a buzzword; it's a cultural shift. It means building systems that are understandable and debuggable by design, enabling your team to move from reactive firefighting to proactive problem-solving.
Implementing Structured and Queryable Logging
Unstructured, free-text logs are nearly useless during a high-pressure incident. To be effective, logs must be structured, typically in a format like JSON. This simple change makes logs machine-readable, enabling powerful filtering, aggregation, and querying in log management tools like Splunk or the ELK Stack (Elasticsearch, Logstash, Kibana).
A well-structured log entry should contain key-value pairs like this:
{
  "timestamp": "2024-10-27T10:00:05.123Z",
  "level": "error",
  "message": "Failed to process payment",
  "service": "payment-service",
  "trace_id": "a1b2c3d4-e5f6-7890-g1h2-i3j4k5l6m7n8",
  "user_id": "usr_9876",
  "error_code": "5003"
}
With this structure, you can execute precise queries, such as finding all errors from the payment-service or correlating all log entries for a single transaction using the trace_id.
Real-Time Performance Monitoring and Alerting
Once telemetry data is flowing, you need to visualize and act on it. Tools like Prometheus combined with Grafana, or commercial platforms like Datadog, excel at this. They scrape metrics from your applications, store them in a time-series database, and allow you to build real-time dashboards tracking key performance indicators (KPIs).
As a baseline, you must track these core application metrics:
- Latency: Request processing time, specifically tracking p95 and p99 percentiles, which are more sensitive to user-facing slowdowns than simple averages.
- Traffic: Request rate (e.g., requests per second).
- Errors: The rate of failed requests, often broken down by HTTP status code (e.g., 5xx vs. 4xx errors).
- Saturation: A measure of system resource utilization (CPU, memory, disk I/O) relative to its capacity.
The final component is intelligent alerting. Avoid primitive alerts like "CPU > 90%." Instead, define alerts based on symptoms that directly impact users, such as a statistically significant increase in the API error rate or a sustained breach of the p99 latency SLO. These are the service-level indicators (SLIs) that signal genuine user-facing degradation and form the core of what is continuous monitoring.
Implementing Failsafe Rollback and Recovery Plans
Despite rigorous testing and automation, failures will occur when you deploy to production. It is inevitable. An esoteric bug, a performance regression, or a downstream dependency failure can transform a routine deployment into a critical incident.
A well-rehearsed rollback and recovery plan is your most critical safety net. It's about more than just reverting code; it's about safeguarding user trust and ensuring business continuity. A robust plan reduces a potential catastrophe to a controlled, manageable event.
Automated vs. Manual Rollbacks
When a deployment introduces a severe regression, the primary objective is to restore service. The method depends heavily on the deployment strategy employed.
- Automated Rollbacks: Blue-Green deployments excel here. If monitoring detects critical errors in the "Green" environment post-traffic switch, an automated rollback can be triggered by simply reconfiguring the load balancer to point back to the last known-good "Blue" environment. This recovery is nearly instantaneous and minimizes the mean time to recovery (MTTR).
- Manual Rollbacks: In a Rolling deployment, a rollback is effectively a "roll-forward" to the previous stable version. This involves initiating a new deployment pipeline with the previous version's build artifact. This process is inherently slower and requires careful execution to avoid exacerbating the issue. It's typically reserved for severe but non-catastrophic issues.
Key Takeaway: Your rollback procedure must be as rigorously tested and automated as your deployment process. Conduct regular "game day" exercises where you simulate a production failure in a staging environment and execute a full rollback. This builds muscle memory and reveals weaknesses in your recovery plan before a real crisis.
Handling Database Migrations and Schema Changes
Database schema changes are the most perilous aspect of any rollback. Reverting application code without considering the database state is a recipe for disaster. If a new code version relied on a forward migration that altered the schema (e.g., adding a NOT NULL column), the old code will be incompatible and will likely crash, leading to data corruption.
To mitigate this, migrations must be backward-compatible and decoupled from application logic deployment. This is often achieved with an expand-and-contract pattern:
- Expand Phase (Deploy Schema Changes): First, deploy a schema change that is compatible with both the old and new code. For example, to rename a column, you would first add the new column (allowing
NULLvalues) and deploy application code that writes to both the old and new columns but reads from the old one. The system can now operate with either code version. - Contract Phase (Deploy Application Logic): After the expand phase is stable, deploy the new application logic that reads and writes exclusively to the new column. A final, separate migration to remove the old column is deferred to a future release, long after the rollback window for the current deployment has passed.
This multi-phase approach decouples schema evolution from application deployment, making rollbacks significantly safer.
Fostering a Blameless Post-Mortem Culture
Following an incident, the natural impulse is to assign blame. This is counterproductive. The focus must be on systemic failures—what in the system or process allowed the failure to occur, not who caused it. A blameless post-mortem is a structured process for converting failures into institutional knowledge.
Once service is restored, the involved teams convene to reconstruct the incident timeline. The objective is to identify the root causes and generate concrete, actionable follow-up items to prevent recurrence. This could lead to improved monitoring, enhanced automated testing, or a more robust rollback procedure.
This practice fosters psychological safety, encouraging engineers to report and analyze failures openly without fear of reprisal. This culture of continuous improvement is the foundation of a resilient engineering organization. The need for this operational agility is critical across industries; for instance, the manufacturing operations management software market is projected to reach $76.71 billion by 2033, driven by the intolerance for software unreliability on production lines. You can read the full research about this market's growth and see its dependency on dependable software.
Got Questions About Production Deployments? We've Got Answers
Even with a mature deployment process, specific technical questions frequently arise. Addressing these effectively is key to maintaining a smooth release cadence and operational stability when you deploy to production. Let's address some of the most common challenges.
How Often Should We Be Deploying?
Deployment frequency should be dictated by your team's operational maturity and the robustness of your CI/CD pipeline, not by an arbitrary schedule. Elite DevOps performers deploy multiple times per day. The guiding principle is not speed for its own sake, but rather the reduction of batch size. Small, incremental changes are inherently less risky.
Instead of targeting a specific deployment cadence, focus on minimizing the scope of each release. Small, frequent deployments are easier to test, faster to deploy, and simpler to roll back. A high change-fail rate is not an indicator to slow down deployments; it is a clear signal to invest more heavily in automated testing, monitoring, and fault-tolerant deployment strategies.
What's the Safest Way to Push a Hotfix?
A hotfix is an emergency patch for a critical production bug. Speed is essential, but it must not compromise process safety. Never SSH into a production server to apply a manual patch; this introduces untracked changes and invites further instability.
A disciplined, battle-tested hotfix process follows these steps:
- Create a dedicated
hotfixbranch directly from themainormasterbranch. - Commit only the minimal change required to resolve the specific bug. Resist the temptation to bundle other changes.
- The hotfix commit must pass through an accelerated CI pipeline, executing a critical subset of tests that validate the fix and check for major regressions.
- Once tests pass, merge the
hotfixbranch intomain, tag it, and deploy immediately. Crucially, this branch must also be merged back into thedevelopbranch to prevent the bug from being reintroduced in the next regular release.
This structured process ensures even emergency patches are version-controlled, tested, and correctly integrated back into the main development line, preventing regressions.
Can We Really Deploy to Production During Business Hours?
Yes; in fact, deploying during peak business hours should be the goal. This practice ensures that the entire engineering team is online, available, and mentally prepared to address any issues that may arise. Deployments conducted late at night or on weekends, while seemingly safer due to lower traffic, suffer from reduced staff availability and slower incident response times.
The ability to deploy during the day is a direct measure of your confidence in your automation, monitoring, and deployment strategy. If you can only deploy when user traffic is minimal, it is a strong indicator that your deployment process is fragile. Implementing strategies like Blue-Green or Canary and having a tested rollback plan are prerequisites for making daytime deployments a routine, low-stress event. The ultimate goal is to make a deploy to production so reliable that it becomes a non-event.
Navigating the complexities of production deployments requires real-world expertise. OpsMoon connects you with the top 0.7% of remote DevOps engineers who live and breathe this stuff. We build and manage robust CI/CD pipelines, implement zero-downtime strategies, and make sure your releases are always smooth and reliable.
Start with a free work planning session to map out your path to deployment excellence at https://opsmoon.com.
Leave a Reply