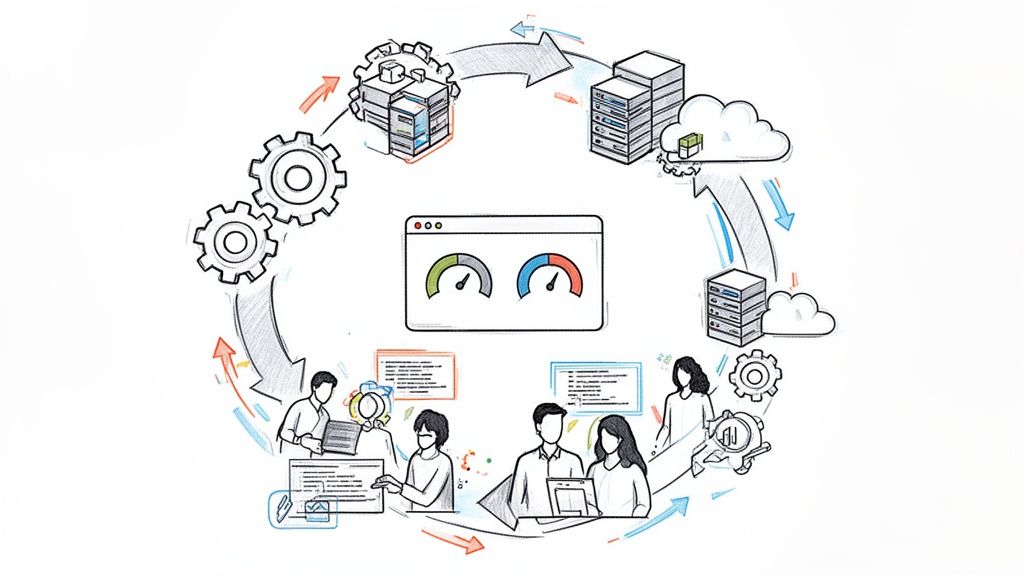
Improving operational efficiency is a technical discipline built on a continuous cycle: Assess, Automate, and Observe. This feedback loop is designed to systematically reduce toil, eliminate manual error, and transition engineering teams from a reactive to a proactive state. This guide provides an actionable, technical framework for implementing this cycle.
Your Roadmap to Peak Operational Efficiency
Achieving genuine operational efficiency is not about purchasing a specific tool; it's about methodically re-engineering your software delivery lifecycle (SDLC). The objective is to establish a technical roadmap that enables the consistent, predictable, and rapid delivery of high-quality software.
The process begins with a quantitative assessment of your current state. You cannot optimize what you do not measure. This involves moving beyond qualitative analysis and implementing rigorous tracking of key performance indicators (KPIs), specifically the DORA metrics. With a data-driven baseline established, you can proceed to implement foundational automation.
Charting Your Course
The path to high-performance software delivery is constructed upon core technical pillars. Each pillar builds upon the last, creating a resilient, high-velocity system. The primary technical activities are outlined below.
First, to set up this journey, we can map out the essential stages.
| Pillar | Technical Objective | Key Activities |
|---|---|---|
| Assess | Establish a quantitative performance baseline. | Define and instrument DORA metrics; conduct value stream mapping to identify bottlenecks in the CI/CD workflow. |
| Automate | Eliminate manual toil and increase deployment velocity. | Implement idempotent CI/CD pipelines; adopt Infrastructure as Code (IaC); automate unit, integration, and E2E testing. |
| Observe | Create high-fidelity, low-latency feedback loops. | Implement the three pillars of observability (logs, metrics, traces) to gain deep insight into system behavior in production. |
This table outlines the technical journey you'll embark on. Each pillar represents a critical focus area for building a high-performing software delivery engine.
Let’s look at what these activities mean in practice:
- Implementing Infrastructure as Code (IaC): This is a mandatory practice. Utilizing tools like Terraform, you define your entire infrastructure stack (VPCs, subnets, EC2 instances, security groups) in HCL (HashiCorp Configuration Language). This code is version-controlled in Git, enabling auditable, repeatable deployments across all environments.
- Establishing Robust CI/CD Pipelines: The goal is to automate the path from code commit to production deployment. This involves scripting the entire build, test, and release process to ensure every change is deployed with minimal human intervention and maximum safety.
- Creating Comprehensive Observability: This involves building feedback systems that connect production runtime behavior directly back to engineering teams. When engineers can correlate code changes with performance metrics and system health, they achieve true end-to-end ownership.
Security cannot be an afterthought. As you implement this roadmap, you must embed software development security best practices directly into your automated pipelines, a practice known as DevSecOps.
This simple flow captures the heart of the process—assessing where you are, automating what you can, and observing the results to get better.

The critical insight is that these are not discrete stages but a continuous improvement cycle. If you're looking to build out a more detailed strategic plan, a partner providing DevOps advisory services can bring in the outside expertise to accelerate this journey.
Quantify Your DevOps Maturity with Core Metrics
Before you can improve operational efficiency, you must establish a quantitative baseline. Forget subjective maturity models and gut feelings. A data-driven approach is essential for benchmarking performance against elite standards and identifying precise bottlenecks within your SDLC.
You can't improve what you don't measure. It's a cliché, but it's a foundational principle of engineering.
The foundation for this data-driven approach is a set of four key metrics. These metrics provide a standardized, objective language for discussing software delivery performance, shifting conversations from subjective opinions to empirical data.
Adopting the Four Key DORA Metrics
Your assessment must be centered on the four primary indicators that measure both deployment velocity and production stability. To drive meaningful improvements, you must instrument and track the core DevOps DORA metrics; they are the industry gold standard for measuring engineering effectiveness.
Here are the four metrics you need to live and breathe:
- Deployment Frequency: How often do you successfully release code to production? This measures throughput and the ability to deliver value continuously. Elite performers deploy on-demand, often multiple times per day.
- Lead Time for Changes: What is the median time for a commit to be deployed into production? This measures the end-to-end velocity of your delivery pipeline, from code commit to release.
- Mean Time to Recovery (MTTR): What is the median time to restore service after a production incident or failure? MTTR is a direct measure of your system's resilience and your team's incident response capability.
- Change Failure Rate: What percentage of production deployments result in a degraded service and require remediation (e.g., a hotfix or rollback)? This metric is a key indicator of quality and stability. Low-performing teams often see failure rates between 46-60%, while elite teams keep it below 15%.
I've seen teams become fixated on Deployment Frequency while ignoring other metrics. They "move fast and break things," leading to an erosion of user trust. Increasing deployment velocity without a corresponding low Change Failure Rate is a recipe for disaster. This is an anti-pattern to avoid.
How to Technically Measure DORA Metrics
To measure these metrics, you must instrument your toolchain. The necessary data points exist within your version control system (e.g., Git), CI/CD platform (e.g., Jenkins, GitHub Actions), and incident management system (e.g., PagerDuty).
Consider Lead Time for Changes. You can implement a script to calculate this metric:
- Commit Time: Use
git log --pretty=format:'%H %ct'to extract the commit hash and its Unix timestamp. - Deployment Time: Query your CI/CD tool's API. For example, in GitHub Actions, you can query the API for workflow runs associated with a specific commit to find the timestamp of the successful
deploymentevent to production. - Calculation: The difference
(deployment_timestamp - commit_timestamp)gives you the lead time for that commit.
Aggregate these values over time and calculate the median to get your final metric. Visualize this data in a tool like Grafana to track trends and validate the impact of process improvements.
If you're not sure how to even start tracking this, it's worth taking a look at different DevOps maturity levels to get a sense of where you fit in.
Going Beyond DORA with Supplementary Metrics
While DORA provides an excellent baseline for delivery performance, a holistic view of operational efficiency must also account for cost and human factors. Two supplementary metrics are crucial for a complete picture.
- Infrastructure Cost Per Deployment: This KPI connects engineering velocity directly to financial cost. The formula is
Total Monthly Cloud Spend / Number of Production Deployments. A downward trend in this metric indicates that your automation and optimization efforts are improving cost-efficiency. - Developer Toil Percentage: Toil is manual, repetitive, tactical work that lacks enduring value and scales linearly with service growth. To measure this, conduct regular surveys asking engineers to estimate the percentage of their time spent on toil versus engineering work. A toil percentage exceeding 30% is a strong signal that you are under-invested in automation and risk developer burnout.
By combining DORA metrics with these financial and human-centric KPIs, you create a comprehensive performance dashboard. This data-driven approach ensures that every improvement initiative is targeted, measurable, and impactful.
Once you have a quantitative grasp of your performance, you can build the automation engine that drives improvement. This is a fundamental investment in creating repeatable, reliable systems that form the backbone of your operational efficiency, eliminating manual handoffs and reducing human error.
The data backs this up, big time. We’ve seen firsthand how companies adopting DevOps practices just blow past their old benchmarks. In 2026, that trend is only getting stronger, with reports showing 99% of organizations see a positive impact from DevOps, and 61% are shipping higher quality products. In the world of Kubernetes, over 60% of enterprises are using platform teams to cut cognitive load by 40-50%, letting their engineers get back to innovating. You can dig into more of the latest DevOps statistics and trends on programs.com.
Create an Idempotent CI/CD Pipeline
Your Continuous Integration/Continuous Deployment (CI/CD) pipeline is the automated pathway for code moving from a developer's workstation to production. The key technical property of a robust pipeline is idempotency—it must produce the exact same outcome given the same input (e.g., a specific code commit). This predictability is what builds trust in your automation.
A well-architected pipeline consists of distinct, automated stages:
- Source Code Management (SCM): Everything originates in Git. A disciplined branching strategy, such as GitFlow or a simpler trunk-based development model, is essential. A
git pushto the main branch should automatically trigger the pipeline via webhooks. - Build & Unit Test: The pipeline pulls the source code, compiles it if necessary, and executes the unit test suite. A single test failure must fail the build, providing immediate feedback to the developer.
- Artifact Management: Upon a successful build, the application is packaged into an immutable artifact, typically a Docker image. This artifact is tagged with the Git commit SHA and pushed to a container registry (e.g., Docker Hub, AWS ECR).
- Automated Testing: The artifact is deployed to a staging environment for more comprehensive testing, including integration tests (validating interactions between microservices) and end-to-end (E2E) tests that simulate user workflows.
By automating this entire flow, you transform a series of high-risk, manual procedures into a reliable, push-button process. If you're looking to get this up and running without all the heavy lifting, exploring a CI/CD as a Service model can be a massive shortcut.
Define Everything with Infrastructure as Code
Manual server configuration is a direct path to configuration drift and operational instability. Infrastructure as Code (IaC) is the practice of defining your entire infrastructure—servers, load balancers, databases, networking—in declarative configuration files. Tools like Terraform have become the de facto standard for this.

When your infrastructure is defined as code, it becomes version-controlled, auditable, and easily replicable. This eradicates configuration drift between development, staging, and production environments.
The real power of IaC hit me when we had to replicate a complex production environment for a new region. What would have taken weeks of manual clicking and configuring in a cloud console took about 15 minutes to deploy with a single
terraform applycommand. It's a game-changer for disaster recovery and scalability.
IaC applies software engineering discipline to infrastructure management. Changes are reviewed via pull requests, subject to automated policy checks (e.g., with Open Policy Agent), and leave a clear audit trail. It is fundamental to building predictable and scalable infrastructure.
Containerize and Orchestrate at Scale
To achieve true application portability and operational scalability, you must containerize applications with Docker and manage them with an orchestrator like Kubernetes.
- Docker: Containerization packages an application and all its dependencies (libraries, binaries, configuration files) into a single, lightweight, and immutable image. This solves the "it works on my machine" problem by guaranteeing consistent runtime behavior across all environments.
- Kubernetes (K8s): At scale, managing hundreds or thousands of containers manually is untenable. Kubernetes automates the deployment, scaling, and lifecycle management of containerized applications. It provides critical features like self-healing (restarting failed containers), service discovery, load balancing, and automated rollouts and rollbacks.
Adopting this stack allows you to abstract away the underlying host infrastructure. Developers no longer need to be concerned with the specific servers their code runs on. They package their application as a container and define its desired state in a Kubernetes manifest (YAML), and the platform handles the rest. This drastically reduces cognitive load and enables developers to focus on delivering business value.
Build High-Signal Observability and Feedback Loops
If automation is your engine, observability is your control system. High-velocity deployments without deep visibility into system behavior is a recipe for disaster. You simply cannot fix what you can't see.
This requires a technical evolution from reactive monitoring (alerting when something is broken) to proactive observability (understanding why it broke).
This is a technical strategy built on collecting and correlating three distinct types of telemetry data: the three pillars of observability. When unified, these data sources provide a high-fidelity, queryable representation of your system's state. The ultimate goal is to create a continuous stream of performance data that feeds directly back to the engineers who wrote the code.
Instrumenting the Three Pillars
To get started, you must instrument your applications to emit this telemetry data. The open-source ecosystem, particularly the combination of Prometheus (for metrics), Grafana (for visualization), and Jaeger (for tracing), provides a powerful and cost-effective stack.
- Structured Logs: Move away from plaintext logs. Implement structured logging (e.g., JSON format) across all services. This makes logs machine-readable and enables powerful, high-speed querying in a log aggregation platform like Loki or Elasticsearch to diagnose issues in seconds, not hours.
- Application Metrics: These are the time-series vital signs of your application. Use client libraries like the Prometheus Java client to expose key application-level indicators (e.g., request rates, error counts, latency percentiles) via a
/metricsendpoint. This provides a real-time pulse on system health. - Distributed Traces: In a microservices architecture, a single user request can traverse dozens of services. Distributed tracing, implemented using standards like OpenTelemetry and visualized with tools like Jaeger, tracks the entire lifecycle of a request as it moves through your system. This is the only way to identify latent bottlenecks and complex inter-service dependencies.
I once worked with a team tearing their hair out over intermittent API timeouts. Their metrics screamed "problem!" but gave zero clues as to where. By implementing distributed tracing, they found a downstream service that was occasionally taking 500ms longer to respond, causing a cascade failure. They fixed it in an hour—after burning weeks just guessing.
From Alert Noise to Actionable Signals
One of the biggest productivity killers for engineering teams is alert fatigue. A constant stream of low-value, non-actionable alerts leads to a "boy who cried wolf" syndrome, where critical signals are ignored.
The technical solution is to base your alerting strategy on Service-Level Objectives (SLOs) and error budgets.
An SLO is a precise, quantitative promise of service reliability (e.g., 99.9% of login requests over a 30-day window must complete successfully in under 200ms).
This SLO automatically defines your error budget: the 0.1% of requests that are allowed to fail before you violate your promise to users. Your alerting strategy then becomes simple and powerful: you only fire a high-priority, pageable alert when the rate of error consumption threatens to exhaust your budget within a specific timeframe. This ensures every alert is meaningful and requires immediate action.
Creating Visual Feedback Loops
The final step is to make this telemetry data visible and accessible to the engineers who need it most. This means building real-time dashboards that correlate low-level system metrics with high-level business KPIs.
Here's an example of what this looks like with a Grafana dashboard, which lets teams pull in and visualize data from all over the place.

A well-designed dashboard can display system uptime, request latency percentiles, and error rates alongside key business metrics. By placing DORA metrics, SLO status (with error budget burn-down charts), and business indicators on a single screen, you create an undeniable feedback loop.
Engineers can immediately see the correlation between a deployment and a change in the error rate, or how a performance optimization impacts user engagement. This visibility fosters a deep sense of ownership. When developers are directly exposed to the real-world impact of their code, they are intrinsically motivated to build more resilient and performant software.
Rethink Your Teams and Build a Learning Culture
The most sophisticated automation stack will fail if your organizational structure creates friction and discourages learning. Ultimately, achieving sustainable operational efficiency is a socio-technical problem. Your organizational design can either be a force multiplier for your automation efforts or your primary bottleneck.
The goal is to structure your engineering organization to minimize cognitive load and eliminate cross-team dependencies that stall the flow of work.

Modern Team Topologies for Maximum Flow
The traditional model of siloed Development, QA, and Operations teams is an anti-pattern that guarantees slow handoffs and conflicting priorities. The Team Topologies framework provides a modern, proven alternative that organizes teams around the flow of value.
- Stream-Aligned Teams: These are end-to-end product delivery teams. They are aligned with a specific stream of business value (e.g., a product, a feature set, or a user journey) and have full ownership of their service, from code to production. This structure minimizes handoffs and shortens feedback loops.
- Platform Teams: This team's "product" is an internal developer platform that provides self-service capabilities. They build and maintain the paved roads—the CI/CD pipelines, IaC modules, and observability tooling—that stream-aligned teams consume. Their mission is to reduce the cognitive load on other engineers.
- Enabling Teams: These are teams of specialists (e.g., SRE, security experts) who act as internal consultants. They temporarily embed with stream-aligned teams to help them gain a missing capability, solve a particularly complex problem, or adopt a new technology. They teach, they don't do.
This model is designed to maximize developer autonomy and flow. By providing stream-aligned teams with a robust self-service platform and expert support on demand, you empower them to focus on delivering customer value.
Turn Incidents into Improvements with Blameless Post-Mortems
Every production incident is an unplanned investment in system reliability. A blameless post-mortem is the process by which you ensure you realize a return on that investment. The core principle is to focus not on who made an error, but on what systemic factors allowed that error to have a negative impact.
The rule is simple: assume everyone involved had good intentions with the information they had. A post-mortem that concludes with "human error" is a failure. The real question is, why was our system so fragile that one person's action could take it down?
A rigorous post-mortem process includes a detailed timeline of events, identification of all contributing factors (both technical and procedural), and the creation of concrete, actionable follow-up items. These action items are entered into the engineering backlog and prioritized like any other work, ensuring that every incident leads to a tangible improvement in system resilience.
Systematically Eliminating Waste with Kaizen
To achieve continuous improvement, you need a formal process for identifying and eliminating waste. Kaizen events are short, highly-focused workshops where a cross-functional team maps out a specific process (e.g., the commit-to-deploy workflow) and systematically identifies every non-value-adding step.
In software delivery, common forms of waste (or "muda") include:
- Partially done work: Code waiting in a pull request queue for review or deployment.
- Extra processes: Manual approval gates that add delay but no real value.
- Task switching: Developers being pulled between unrelated projects or firefighting.
- Waiting: The idle time created by handoffs between siloed teams.
By visualizing your value stream and systematically targeting these sources of waste, you can achieve significant reductions in lead time through a series of small, incremental improvements.
Integrating Security to Prevent Costly Delays
A major source of inefficiency is treating security as a final gate before release. The practice of shifting security left, or DevSecOps, integrates automated security controls directly into the development lifecycle. Security can’t be a final boss you have to defeat before a release. It has to be an automated, everyday part of your CI pipeline, running static analysis (SAST), dynamic analysis (DAST), and software composition analysis (SCA) on every commit.
Adopting DevSecOps is a major driver of efficiency. While only 25% of organizations had DevOps platforms in 2023, Gartner predicts this will soar to 80% by 2027. That’s a 220% increase, fueled by the need for efficiency as 95% of new digital workloads are expected to run in the cloud by 2025. You can get more insights on these DevOps trends and statistics on strongdm.com.
Frequently Asked Questions
As teams begin their operational efficiency journey, several common technical questions arise. Here are direct, actionable answers to the most frequent inquiries.
Where Should a Small Team Focus First to Improve Operational Efficiency?
For a small team with limited resources, the highest-leverage starting point is a basic CI/CD pipeline for your primary application. Do not attempt to automate everything at once. Focus on a single service—your monolith or most critical microservice.
Use a tool like GitHub Actions or GitLab CI to automate the core workflow from a git push on the main branch to a deployment in a staging environment.
The initial technical goals should be:
- Automated Builds: Trigger a build on every commit.
- Unit Testing: The build must fail if any unit test fails, providing immediate feedback.
- Deploy to Staging: On success, automatically deploy the resulting artifact.
The objective is to eliminate error-prone manual deployments. Once this foundational pipeline is stable, you can begin tracking Deployment Frequency and Change Failure Rate. The resulting data will provide a compelling, quantitative case for further investment.
How Do I Justify the Cost of DevOps Tools and Experts to Leadership?
To secure budget, you must translate technical needs into business impact. Leadership responds to arguments about revenue, risk, and cost, not technical jargon. The DORA metrics are your primary tool for this translation.
Frame your proposal using these business arguments:
- Faster Time-to-Market: "By improving our Lead Time for Changes from 2 weeks to 2 days, we can deliver revenue-generating features 5x faster and outpace competitors."
- Reduced Downtime Costs: "By lowering our Mean Time to Recovery (MTTR) from 4 hours to 15 minutes, we can reduce the financial impact of outages by 93%, saving an estimated $X per quarter."
- Increased Engineering Productivity: "Our engineers spend an average of 10 hours per week on manual deployments and environment configuration. By investing $Y in automation, we can reclaim those hours, which translates to a productivity gain of $Z annually, allowing them to focus on product innovation."
A huge mistake I see is teams asking for a budget for Kubernetes or Terraform. Don't do that. Instead, present a problem and your solution. For example: "Our manual deployments cost us 80 engineer-hours a month and led to two outages last quarter. By investing in a CI/CD platform, we'll get those hours back and cut our change failure rate by 50%."
Build a formal business case that connects your proposed technical investment to concrete financial outcomes.
What Is the Biggest Technical Mistake to Avoid?
The single biggest technical mistake is tool acquisition without a platform mindset. Many organizations purchase a suite of DevOps tools—Kubernetes, a CI/CD platform, an observability stack—but fail to integrate them into a cohesive, self-service internal developer platform.
The result is the creation of a new "DevOps team" silo, which becomes a bottleneck. Developers are forced to file tickets and wait for this team to configure pipelines, provision infrastructure, or debug deployments. This is the antithesis of efficiency.
True operational efficiency is achieved by creating standardized, automated "paved roads" that enable development teams to build, ship, and operate their own services with maximum autonomy. The tools are merely the building blocks; the ultimate goal is developer self-service, not the creation of a new dependency.
When Should We Consider Bringing in an External DevOps Partner?
Engaging an external partner is a strategic decision to accelerate outcomes. It is most effective when you have a clear objective but lack the in-house specialized expertise or bandwidth to execute quickly.
Consider a partner in these specific scenarios:
- Acceleration: You have a critical business deadline and need to implement a complex system like Kubernetes faster than your team can learn and build it from scratch.
- Expertise Gap: You need to implement a sophisticated technology like Infrastructure as Code with Terraform or a comprehensive observability stack with Prometheus and Jaeger, but your current team lacks deep, at-scale experience with these tools.
- On-Demand Talent: You have a well-defined, project-based need for a specialist (e.g., an SRE or Kubernetes expert) but do not want to incur the overhead of a full-time hire.
A high-quality partner provides immediate access to deep domain expertise, allowing your team to maintain focus on product development while simultaneously upgrading your technical capabilities and infrastructure.
Ready to stop firefighting and start building a world-class engineering practice? At OpsMoon, we connect you with the top 0.7% of DevOps experts to build the exact automation and infrastructure you need. Start with a free work planning session to map your path to peak operational efficiency.
Leave a Reply