Prometheus implements a fundamentally different approach to network monitoring compared to legacy systems. Instead of a push-based model, it utilizes a powerful, pull-based model to scrape time-series data from network devices, servers, and services. This architecture makes it exceptionally well-suited for dynamic, cloud-native environments where endpoints are ephemeral.
At its core, Prometheus relies on specialized proxies called exporters. These are small, efficient applications co-located with target systems—routers, switches, firewalls, and hosts—that translate proprietary internal metrics into a simple, text-based exposition format that Prometheus can parse. The Prometheus server then "scrapes" these HTTP endpoints at regular intervals, ingesting a continuous, high-granularity stream of telemetry data about your network's health and performance.
This pull-based, exporter-centric methodology provides engineering teams with deep visibility, enabling them to detect, diagnose, and resolve network anomalies before they escalate into user-facing incidents.
Why Prometheus Is the Modern Choice for Network Monitoring
Legacy network monitoring tools were not architected for modern, elastic infrastructure. Most traditional systems are built on SNMP and push-based models designed for static, on-premise data centers with predictable IP ranges.
Today's infrastructure is anything but static. In environments orchestrated by Kubernetes, services and instances are created and destroyed dynamically within seconds. Prometheus was developed at SoundCloud in 2012 specifically to solve the monitoring challenges of these ephemeral, constantly shifting systems.
Its architectural superiority lies in its active data collection. Instead of passively waiting for devices to send traps or data, Prometheus actively pulls metrics from its configured targets. This pull model, coupled with robust service discovery mechanisms, provides centralized control and enhanced reliability. If a target endpoint goes down, Prometheus knows immediately because the scrape fails—a failed scrape (up == 0) is, itself, a powerful metric.
For a clearer picture, let's break down how Prometheus stacks up against the old guard.
Prometheus vs Traditional SNMP Monitoring
| Feature | Prometheus | Traditional SNMP |
|---|---|---|
| Data Model | Pull-based (Prometheus scrapes targets) | Push-based (Devices send traps/data) |
| Data Structure | Multi-dimensional labels (key-value pairs) | Hierarchical (Object Identifiers – OIDs) |
| Discovery | Dynamic service discovery for ephemeral targets | Manual or script-based for static IPs |
| Control | Centralized scrape configuration (prometheus.yml) |
Decentralized; configured on each device |
| Failure Detection | Immediate detection via scrape failures (up metric) |
Relies on "heartbeats" or lack of data |
| Query Language | Powerful and flexible (PromQL) | Limited; basic GET requests for OIDs |
| Typical Use Case | Cloud-native, microservices, dynamic infra | Traditional enterprise networks, hardware |
The Prometheus model is engineered for the flexibility, control, and automation required to manage modern network complexity.
The Power of a Label-Based Data Model
Prometheus eschews the rigid, hierarchical data structures of legacy monitoring tools. Instead, it employs a multi-dimensional data model built on simple key-value pairs called labels. Every time-series is uniquely identified by its metric name plus a set of these labels.
This seemingly simple design provides extraordinary power and flexibility when querying and aggregating data.
With labels, you can slice and dice network metrics with surgical precision. For example, you can execute complex, ad-hoc queries to:
- Aggregate bandwidth for all
role="webserver"indatacenter="us-east-1". - Isolate error rates for a specific
app="api"andversion="v2.1.3"during a canary release. - Compare latency across different cloud providers by filtering on a
provider="aws"orprovider="gcp"label.
This ability to ask complex questions of your data on the fly is a critical advantage for troubleshooting complex network incidents.
Built for a Cloud-Native World
Prometheus has experienced explosive adoption since its inception. As the second project to graduate from the Cloud Native Computing Foundation (CNCF)—right after Kubernetes—it has cemented itself as the de facto standard for cloud-native observability.
Today, over 51,253 companies worldwide rely on it, from hyperscalers to innovative startups in finance and manufacturing. You can dig into some of the industry trends and market growth here.
This widespread trust is a direct result of a design philosophy that prioritizes reliability, scalability, and operational simplicity—the non-negotiable requirements for any serious network monitoring strategy today.
Building Your Core Monitoring Infrastructure
With the theory established, it's time to build the core of your Prometheus network monitoring setup. This section provides actionable steps to lay a solid foundation for collecting rich network telemetry. The objective is to establish a base configuration that can be scaled and extended as your requirements evolve.
First, deploy the Prometheus server. This is the central component that performs scraping, storage, and query processing. For an initial setup, running the server as a binary or within a Docker container is a common and effective starting point.
Configuration is managed through a single YAML file, prometheus.yml. This file defines global settings, such as the scrape interval, and, most importantly, the scrape configurations that specify the targets from which Prometheus will pull metrics.
Configuring Your First Scrape Targets
A basic prometheus.yml is surprisingly simple. You define "scrape jobs," which are groups of targets with shared characteristics. For network monitoring, we will start with two essential exporters.
The following configuration file is a practical template. It establishes two jobs: one for scraping host-level metrics and another for network hardware.
global:
  scrape_interval: 15s # Set the scrape interval to every 15 seconds.

scrape_configs:
  # Job for node_exporter on our hosts
  - job_name: 'node'
    static_configs:
      - targets: ['host1.example.com:9100', 'host2.example.com:9100']

  # Job for snmp_exporter to scrape network devices
  - job_name: 'snmp'
    static_configs:
      - targets:
        - 'switch1.example.com' # Your actual switch/router DNS or IP
        - 'router1.example.com'
    relabel_configs:
      - source_labels: [__address__]
        target_label: __param_target
      - source_labels: [__param_target]
        target_label: instance
      - target_label: __address__
        replacement: snmp-exporter.example.com:9116 # The address of your snmp_exporter
This configuration instructs Prometheus to scrape two distinct types of exporters, each providing a unique perspective on network health.
Deploying the Essential Node Exporter
Before monitoring complex network hardware, it is critical to monitor the hosts themselves. The node_exporter is the standard for this, exposing a comprehensive set of metrics from servers—CPU, memory, disk I/O, and crucially, detailed network interface statistics.
Once deployed on a host, node_exporter exposes key metrics like:
node_network_receive_bytes_total: A monotonic counter tracking total bytes received on an interface.node_network_transmit_packets_total: A counter for the total number of packets transmitted.node_network_receive_errs_total: A critical counter that tracks receive errors, often the first indicator of a faulty cable, a failing NIC, or a duplex mismatch.
These metrics form the foundation of host-level observability, providing precise data on traffic flow and packet integrity.
Key Takeaway: The
node_exporteris non-negotiable. Without it, you have a massive blind spot and cannot correlate network-wide issues with the performance of individual servers.
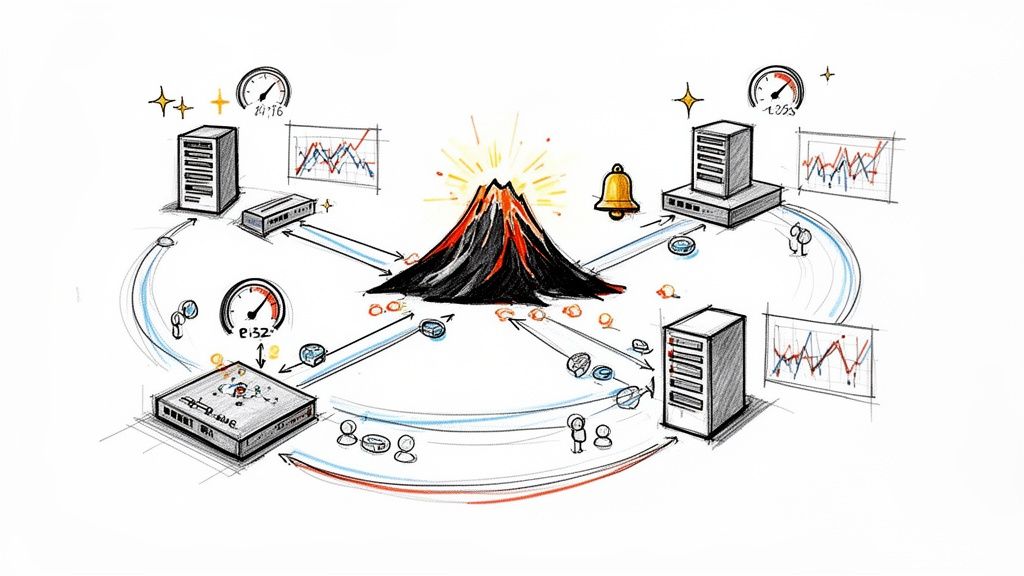
This diagram illustrates the fundamental data flow: an exporter pulls proprietary metrics from a device, translates them into the Prometheus exposition format, and presents them on an HTTP endpoint for the Prometheus server to scrape.

This simple but powerful process converts vendor-specific data into an open, queryable format.
Tapping into Network Hardware with SNMP Exporter
Next, we extract metrics from the switches, routers, and firewalls that form your network backbone. For this, we use the powerful snmp_exporter. It functions as a universal translator, converting cryptic SNMP OIDs into well-structured, labeled Prometheus metrics.
Implementation is a two-step process. First, deploy the snmp_exporter service. Second, provide it with a configuration file, snmp.yml, that maps vendor-specific MIBs to human-readable Prometheus metrics.
Generating the snmp.yml can be complex, but the snmp_exporter project includes a generator to simplify this. You feed it the MIB files from your network vendor, and it outputs a configuration ready to scrape standard interface metrics like ifInOctets, ifOutOctets, and error counters like ifInErrors, ifOutErrors.
With this infrastructure in place, you have a continuous stream of telemetry from both your servers and your core network hardware, creating a comprehensive foundation for effective Prometheus network monitoring. For related strategies, our guide on Prometheus service monitoring explores other useful patterns.
Unlocking Network Insights with PromQL

With exporters deployed and metrics flowing into Prometheus, the next step is to transform this raw data into actionable intelligence. This is the domain of the Prometheus Query Language, or PromQL.
PromQL is a powerful functional language designed specifically for time-series data. It enables you to select, filter, aggregate, and perform calculations on your metrics with high precision. This is how you transition from simple data collection to a deep, real-time understanding of network behavior.
Calculating Bandwidth with Rate and Irate
A primary network monitoring task is to determine bandwidth utilization. Metrics like node_network_receive_bytes_total and ifOutOctets are counters—their values only ever increase. To derive a useful rate like megabits per second, you must calculate the per-second increase of the counter over a specific time window.
The rate() function is designed for this. It calculates the per-second average rate of increase of a time-series over a specified range. Because network traffic is often bursty, rate() provides a smoothed, more predictable view suitable for capacity planning and alerting.
To calculate the average receive bandwidth on the eth0 interface over the last five minutes, the query is:
# Calculates the average receive rate in bytes per second over 5 minutes
rate(node_network_receive_bytes_total{device="eth0"}[5m])
To convert this to megabits per second (Mbps), you multiply by 8 (bytes to bits) and divide by 1,000,000.
# Converts the rate to Mbps
rate(node_network_receive_bytes_total{device="eth0"}[5m]) * 8 / 1000000
For identifying sudden, intense traffic spikes that rate() might smooth over, use irate(). Instead of averaging over the entire time range, irate() calculates the rate based on only the last two data points in the range. It is ideal for real-time dashboards where immediate burst detection is critical.
Pro Tip: Use
rate()for alerting and capacity planning where a stable, averaged value is critical. Useirate()for real-time dashboards designed to spot instantaneous spikes.
Aggregating Data for a High-Level View
While per-interface analysis is crucial for troubleshooting, a high-level view is often necessary. Aggregation operators like sum() and avg() are indispensable for calculating total bandwidth across a datacenter or the average packet drop rate across a fleet of servers.
By adding a by() clause, you specify which labels to preserve after aggregation, enabling powerful data slicing.
Consider these real-world examples:
- Total bandwidth per host: Sum the traffic rates for all network interfaces (
device) on each machine (instance).sum by (instance) (rate(node_network_receive_bytes_total[5m])) - Average packet drop rate per switch: Calculate the average packet drop rate across all interfaces on your network switches, grouped by the device's address.
avg by (instance) (rate(ifInErrors[5m]))
This on-the-fly aggregation is a cornerstone of Prometheus network monitoring, allowing you to seamlessly shift from a micro to a macro perspective.
This kind of label-based querying is why over 51,253 companies—from scrappy startups to massive financial institutions—rely on Prometheus. The flexibility PromQL offers is simply unmatched. To see how it stacks up, you can explore the data on leading infrastructure tools.
Pinpointing Network Saturation and Errors
Beyond basic bandwidth, PromQL allows for sophisticated queries to diagnose specific network problems.
1. Calculating Interface Saturation
Knowing how close an interface is to its capacity is critical for preventing outages. To calculate saturation, you need two metrics: the current traffic rate and the interface's maximum speed. You can obtain the speed from ifSpeed (snmp_exporter) or node_network_speed_bytes (node_exporter).
The query to calculate saturation percentage is:
# (Current traffic rate in bits/sec) / (Interface speed in bits/sec) * 100
(rate(ifOutOctets{ifName="GigabitEthernet0/1"}[5m]) * 8) / on(instance, ifName) ifSpeed{ifName="GigabitEthernet0/1"} * 100
This query is ideal for an alert rule that fires when an interface exceeds 80% saturation, providing an early warning before performance is impacted.
2. Measuring Packet Error Ratios
Packet errors are a strong indicator of physical layer issues. Rather than raw error counts, the error ratio—the number of error packets relative to the total number of packets—is more insightful.
This query calculates the ratio of inbound errors to total inbound unicast packets:
# (Rate of inbound errors) / (Rate of total inbound unicast packets)
rate(ifInErrors{job="snmp"}[5m]) / rate(ifInUcastPkts{job="snmp"}[5m])
A consistently non-zero result from this query suggests a physical layer problem, such as a faulty cable, a failing network card, or a duplex mismatch.
Mastering these query patterns transforms raw network counters into actionable operational intelligence. For a deeper dive, check out our guide on the Prometheus Query Language.
Visualizing Network Health in Grafana

While PromQL is ideal for ad-hoc querying, at-a-glance operational awareness requires effective visualization. Grafana is the de facto visualization tool for the Prometheus ecosystem. It excels at transforming complex PromQL queries into clean, intuitive dashboards that provide real-time network status.
First, connect Grafana to your Prometheus server by adding it as a data source. In the Grafana UI, navigate to Configuration > Data Sources, select Prometheus, and input your server's URL.
The art of dashboarding lies in building visualizations that are not just aesthetically pleasing but are genuinely useful for troubleshooting. A well-designed network dashboard should guide an engineer from a high-level system overview down to the specific details required for diagnosis.
Building Your First Network Panels
Let's construct a few essential panels from scratch. These are foundational components of any network monitoring dashboard, utilizing metrics from both node_exporter and snmp_exporter.
Panel 1: Real-Time Bandwidth Usage
A time-series graph showing inbound and outbound bandwidth is a fundamental requirement.
- Visualization: Time series graph.
- Query A (Outbound):
sum by (instance) (rate(node_network_transmit_bytes_total[5m])) * 8 / 1000000 - Query B (Inbound):
sum by (instance) (rate(node_network_receive_bytes_total[5m])) * -8 / 1000000
The negative multiplier in Query B is a common Grafana technique. It renders the inbound and outbound traffic as a mirrored graph, improving readability.
Panel 2: Packet Drop Rates
Packet drops indicate network congestion or faulty hardware. This metric is best visualized with a "Stat" or "Gauge" panel to immediately draw attention.
- Visualization: Stat or Gauge.
- Query:
sum(rate(node_network_receive_drop_total[1m])) + sum(rate(node_network_transmit_drop_total[1m]))
This query sums the rate of both received and transmitted dropped packets. A sustained value greater than zero warrants immediate investigation.
Essential Grafana Panels for Network Monitoring
This reference table outlines several indispensable panels for a comprehensive network dashboard.
| Dashboard Panel | PromQL Query Example | Insight Provided |
|---|---|---|
| Bandwidth (Mbps) | rate(ifHCInOctets{ifName="$interface"}[5m]) * 8 / 1000000 |
Shows real-time traffic throughput on a specific device interface. Essential for capacity planning. |
| Packet Error Ratio | rate(ifInErrors[1m]) / rate(ifInUcastPkts[1m]) |
A rising error ratio points to physical layer issues like bad cables or failing hardware. |
| Interface Discards | sum(rate(ifOutDiscards[5m])) by (instance, ifName) |
Indicates that a device's output buffers are full. A clear sign of network congestion. |
| Latency (Ping) | probe_duration_seconds{job="blackbox_icmp"} |
Measures round-trip time to critical endpoints. Spikes in latency are often the first sign of trouble. |
| Interface Status | ifOperStatus{ifName!~"lo"} |
Tracks if an interface is up (1) or down (0). The most basic but crucial availability metric. |
This set of panels provides a robust starting point for comprehensive network visibility.
Creating Dynamic and Interactive Dashboards
Static dashboards have limited utility. The real power of Grafana is unlocked with variables, which create dropdown menus that dynamically filter the data displayed in your panels. This transforms a simple dashboard into an interactive troubleshooting tool.
For instance, create a host variable that populates a dropdown with all scraped server instances.
- Variable Name:
host - Type: Query
- Data Source: Prometheus
- Query:
label_values(node_exporter_build_info, instance)
With this variable, you can rewrite your queries to be dynamic. The bandwidth query becomes far more versatile:
sum(rate(node_network_transmit_bytes_total{instance="$host"}[5m])) * 8
Now, team members can select a specific host from the dropdown menu, and all dashboard panels will instantly update to show data for just that machine. This same technique can be applied to network devices, interfaces (ifName), or any other label.
Key Takeaway: Variables elevate a basic dashboard to a professional diagnostic tool. They empower your entire team to explore data and troubleshoot problems without requiring PromQL expertise.
Building an effective Prometheus network monitoring dashboard is an iterative process. Start with these fundamental panels, gather feedback, and add more visualizations based on your team's operational needs. For higher-level strategy, our article on building an open source observability platform provides valuable insights.
Your goal is to build a visualization layer that dramatically reduces the Mean Time To Resolution (MTTR) for network incidents.
Implementing Proactive Network Alerting
Dashboards are essential for visual analysis, but a robust Prometheus network monitoring system must also be proactive. It should notify you of anomalies before they impact users. This is the purpose of alerting.
The Alertmanager is the component that handles this. It receives alerts generated by Prometheus and manages deduplication, grouping, and routing. You define alerting conditions as PromQL expressions in Prometheus. When these expressions evaluate to true, they fire, and the Alertmanager ensures the right teams are notified via Slack, PagerDuty, or email.
The objective is not just to generate alerts, but to generate actionable alerts. A noisy alerting system that produces false positives will quickly lead to alert fatigue, a dangerous condition where real alerts are ignored.
Crafting Intelligent Alerting Rules
An effective alerting strategy is built on well-defined rules. An alert rule is a PromQL expression that Prometheus evaluates at regular intervals. If the expression returns a vector, the alert is considered firing.
Here are two battle-tested examples for critical network events that can be adapted for your environment.
1. High Network Interface Saturation
This is one of the most critical network alerts, acting as an early warning for capacity exhaustion.
- alert: HighNetworkInterfaceSaturation
  expr: (rate(ifHCInOctets[5m]) + rate(ifHCOutOctets[5m])) * 8 / ifSpeed > 0.8
  for: 10m
  labels:
    severity: warning
  annotations:
    summary: "High network saturation on {{ $labels.instance }} interface {{ $labels.ifName }}"
    description: "Interface {{ $labels.ifName }} on device {{ $labels.instance }} has been over 80% saturated for 10 minutes. Current value is {{ $value | humanizePercentage }}."
The for: 10m clause is crucial for preventing "flappy" alerts. It requires the condition to be true for a sustained period (10 minutes) before firing, filtering out transient, self-correcting traffic spikes.
2. An Exporter Is Down
Monitoring is only as good as the data it collects. If an exporter becomes unreachable, you have a critical visibility gap. Prometheus provides the up metric automatically, which is ideal for detecting this.
- alert: PrometheusExporterDown
  expr: up{job=~"node|snmp"} == 0
  for: 5m
  labels:
    severity: critical
  annotations:
    summary: "Exporter {{ $labels.job }} down on {{ $labels.instance }}"
    description: "The {{ $labels.job }} exporter on {{ $labels.instance }} has been unreachable for 5 minutes."
This rule monitors all targets in the node and snmp jobs. If any target is down for five minutes, a critical alert is triggered.
Key Takeaway: The
forclause is non-negotiable for building a stable, high-signal alerting system. It is the primary mechanism for reducing noise and ensuring on-call engineers are only paged for sustained, actionable problems.
Directing Alerts to the Right Team
A mature alerting setup routes notifications to the teams responsible for remediation. Alertmanager's configuration enables this through sophisticated routing trees based on alert labels.
For example, a team label can be used for precise routing:
team: networkalerts are routed to the networking team's PagerDuty schedule.team: databasealerts are sent to the DBAs' Slack channel.- Any alert with
severity: criticalcan be configured for immediate, high-priority paging.
This level of control ensures that alerts are not only actionable but also highly relevant to the recipient, dramatically reducing the time required to resolve an issue.
Scaling Prometheus for Enterprise Networks
As your network grows, a single Prometheus server will inevitably become a performance bottleneck and a single point of failure. This is the reality of Prometheus network monitoring at scale. To build a resilient, enterprise-grade monitoring system, you must architect for scale and high availability from the outset.
The first step is to implement a high-availability (HA) pattern. This involves running two identical Prometheus servers in parallel, both scraping the same set of targets. If one server fails, the other continues to collect metrics, preventing any loss of visibility. Alertmanager can then be configured to deduplicate alerts originating from both instances.
Solving Long-Term Storage and Global Views
An HA pair provides redundancy but does not solve the challenges of long-term data storage or achieving a unified query view across multiple clusters or datacenters. For this, more advanced architectures are required.
Powerful open-source projects like Thanos and Mimir address these scaling challenges.
Thanos: This solution deploys a lightweight "sidecar" container alongside each Prometheus instance. The sidecar's primary function is to upload metric blocks to inexpensive object storage (e.g., Amazon S3 or Google Cloud Storage) for long-term retention. A central Thanos Query component provides a global query view, seamlessly federating queries across local Prometheus servers and long-term object storage.
Mimir (formerly Cortex): This project takes a different approach. You configure your Prometheus servers to "remote-write" their metrics to a central, horizontally scalable Mimir cluster. This central system manages ingestion, storage, and querying, effectively turning the individual Prometheus instances into stateless scraping agents. This model is exceptionally powerful for building a multi-tenant, centrally managed observability platform.
Key Architectural Decision: The choice between Thanos and Mimir depends on your operational model. Thanos offers a more decentralized approach that is often simpler to layer onto an existing Prometheus setup. Mimir provides a fully centralized solution that delivers immense scalability but requires managing more stateful services.
Making the Right Architectural Choice
So, which way do you go?
The Thanos sidecar model is often the path of least resistance for scaling an existing deployment. It is an incremental approach that allows you to retain your current Prometheus servers while adding long-term storage and a global query layer.
Conversely, a solution like Mimir is purpose-built for large organizations that require a unified, highly available, multi-tenant metrics backend-as-a-service. While it represents a larger architectural investment, the payoff in scalability and operational efficiency at massive scale is significant.
Both are excellent, production-proven solutions that enable Prometheus to scale far beyond the capabilities of a single server.
Common Questions Answered
Here are answers to some of the most frequently asked questions about Prometheus in real-world network environments.
How Does Prometheus Handle Constantly Changing Networks?
This is a core strength of Prometheus, particularly in environments like Kubernetes. Instead of relying on static configuration files that require manual updates, Prometheus leverages service discovery.
It integrates directly with orchestrator APIs (e.g., the Kubernetes API server) to automatically discover and begin monitoring new targets (like pods or services) as they are created. This makes Prometheus network monitoring highly effective in dynamic, containerized environments where network endpoints are ephemeral.
Can I Monitor Devices Stuck Behind a Firewall?
Yes. Prometheus is primarily a pull-based system, but it can accommodate targets it cannot reach directly.
The solution is the Prometheus Pushgateway. You can run a script on a host within the firewalled network to gather metrics and periodically push them to the Pushgateway. Prometheus then scrapes the Pushgateway as it would any other target. This is an effective workaround for monitoring isolated or hard-to-reach network segments.
What's the Difference Between the Blackbox and SNMP Exporters?
These exporters solve two distinct problems, representing an "outside-in" versus "inside-out" monitoring philosophy.
The SNMP Exporter provides an inside-out view. It queries a network device's internal state, pulling metrics like interface traffic counters, CPU utilization, and memory usage—data the device tracks about itself.
The Blackbox Exporter provides an outside-in view. It probes an endpoint from an external perspective to verify its health and performance. It answers questions like, "Is my web server responding to HTTP requests?" or "What is the ICMP round-trip time to this host?"
In short: SNMP tells you what the router thinks is happening internally, while Blackbox tells you what your users are actually experiencing when they try to reach it.
Ready to implement a robust monitoring strategy without the overhead of hiring and management? OpsMoon connects you with the top 0.7% of remote DevOps engineers to build and scale your observability stack. Start with a free work planning session to map out your infrastructure goals today.
Leave a Reply