An open source observability platform is a curated stack of tools for collecting, processing, and analyzing telemetry data—metrics, logs, and traces—from your systems. Unlike proprietary SaaS offerings, building your own platform provides complete control over the data pipeline, eliminates vendor lock-in, and allows for deep customization tailored to your specific architecture and budget. For modern distributed systems, this level of control is not a luxury; it's an operational necessity.
Why Open Source Observability Is Mission-Critical
In monolithic architectures, monitoring focused on predictable infrastructure-level signals: server CPU, memory, and disk I/O. The approach was reactive, designed to track "known unknowns"—failure modes that could be anticipated and dashboarded.
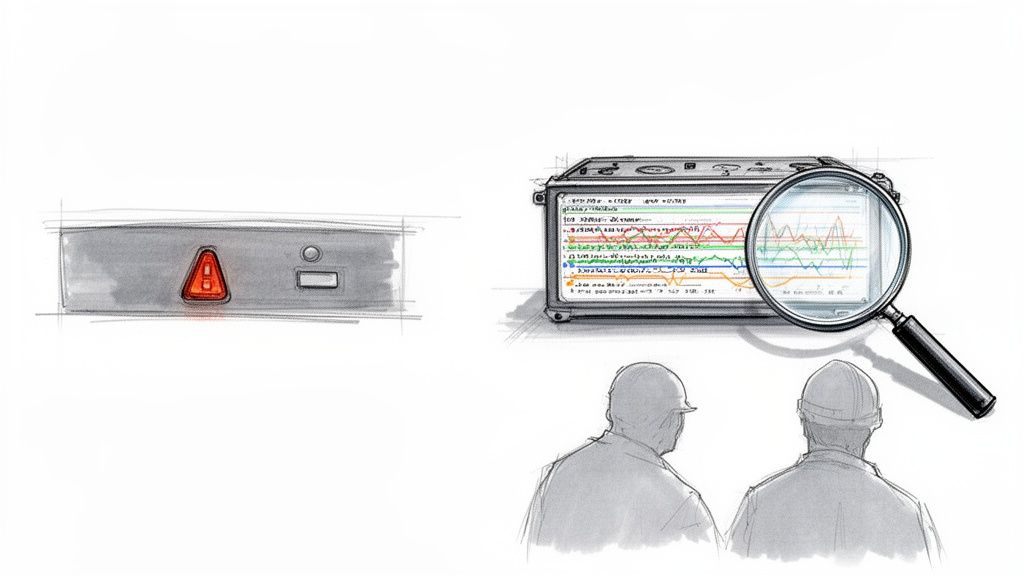
Think of it like the warning light on your car's dashboard. It tells you the engine is overheating, but it has no clue why.
Cloud-native systems, built on microservices, serverless functions, and ephemeral containers, present a far more complex challenge. A single user request can propagate across dozens of independent services, creating a distributed transaction that is impossible to debug with simple, siloed monitoring. That simple dashboard light just doesn't cut it anymore. You need the whole flight recorder.
Beyond Simple Monitoring
Traditional monitoring assumes you can predict failure modes. Observability assumes you can't. It is an engineering discipline focused on instrumenting systems to generate sufficient telemetry data so you can debug "unknown unknowns"—novel, cascading failures that emerge from the complex interactions within distributed architectures.
It provides the technical capability to ask arbitrary questions about your system's state in real-time, without needing to pre-configure a dashboard or alert for that specific scenario.
Observability is not just about collecting table stakes data—it needs to fit within an organization’s workflow. The goal is to design a system that works the way your engineers think and operate, rather than forcing them into a vendor’s rigid model.
This is a massive shift, especially for engineering leaders and CTOs. The ability to perform high-cardinality queries across all telemetry data is how you maintain reliability and performance SLAs. When an incident occurs, your team needs the context to pivot directly from a high-level symptom (e.g., elevated latency) to the root cause (e.g., a specific database query in a downstream service) in minutes, not hours.
The Strategic Value of Open Source
Choosing an open source observability platform puts your engineering team in control of the data plane, providing significant technical and financial advantages over proprietary, black-box tools.
Here's why it’s a strategic move:
- Cost Control: Proprietary tools often price based on data ingest volume or custom metrics, which scales unpredictably. Shopify, for instance, reduced its observability storage costs by over 80% by building a custom platform on open source components.
- No Vendor Lock-In: Standardizing on open protocols like OpenTelemetry decouples your instrumentation from your backend. You are free to swap out storage, visualization, or alerting components without rewriting application code.
- Deep Customization: Open source allows you to build custom processors, exporters, and visualizations. You can, for example, create a custom OpenTelemetry Collector processor to redact PII from logs or enrich traces with business-specific metadata before it leaves your environment.
- Empowered Engineering Teams: Providing direct, programmatic access to telemetry data enables engineers to build their own diagnostic tools and automate root cause analysis. This drives down Mean Time to Resolution (MTTR) and fosters a culture of deep system ownership.
Deconstructing Observability Into Three Core Pillars
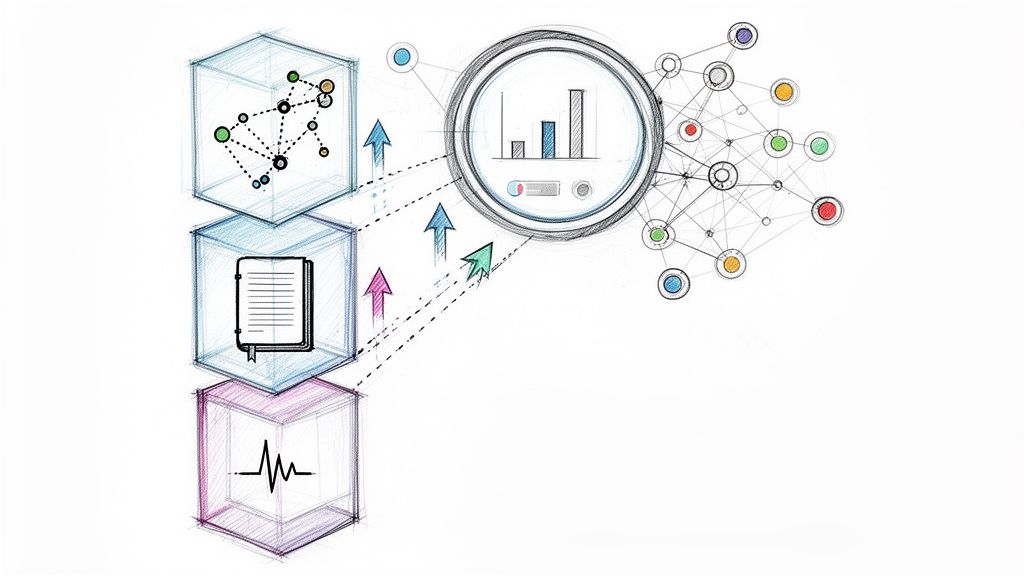
To architect an effective open source observability platform, you must understand its foundational data types. Observability is achieved by correlating three distinct forms of telemetry data. When metrics, logs, and traces are unified, they provide a multi-faceted, high-fidelity view of system behavior.
Think of it like a medical diagnosis. You wouldn't diagnose a patient based on a single vital sign. You need the full data set—EKG (metrics), the patient's detailed history (logs), and an MRI mapping blood flow (traces). The three pillars provide this comprehensive diagnostic capability, enabling engineers to zoom from a 10,000-foot aggregate view down to a single problematic line of code.
Metrics: The System's Heartbeat
First, metrics. These are numerical, time-series data points that quantify the performance of your infrastructure and applications at a specific point in time. They are optimized for efficient storage, aggregation, and querying, making them ideal for dashboards and alerting.
A metric tells you:
node_cpu_seconds_total{mode="idle"}is at 95% on a database host.http_request_duration_seconds_bucket{le="0.3"}shows a p99 latency increase of 300ms.http_requests_total{status_code="500"}rate has jumped from 0.1% to 5%.
Metrics are highly efficient because they aggregate data at the source. Their low storage footprint and fast query performance make them perfect for triggering automated alerts when a predefined threshold is breached. However, a metric tells you what is wrong, not why. That requires deeper context from the next pillar.
Logs: The Detailed System Journal
If metrics are the heartbeat, logs are the system's immutable, timestamped event stream. Each log entry is a discrete record of a specific event, providing the ground-truth context behind the numerical aggregates of metrics.
When an engineer receives a PagerDuty alert for a 5% error rate, their first diagnostic query will be against the logs to find the specific error messages.
A log entry might contain a full stack trace, an error message like
"FATAL: connection limit exceeded for role 'user'"or structured context like{ "userID": "12345", "tenantID": "acme-corp", "requestID": "abc-xyz-789" }. This level of detail is critical for debugging, as it connects an abstract symptom to a concrete failure mode.
Logs provide the rich, unstructured (or semi-structured) narrative behind the numbers. They are the primary evidence used for root cause analysis and are essential for compliance and security auditing. This also plays a huge role in a wider strategy, which you can read about by learning what is continuous monitoring.
Traces: The Detective's Storyboard
The final pillar is distributed tracing. In a microservices architecture, a single API call can trigger a complex cascade of requests across dozens of services. A trace reconstructs this entire journey, visualizing the request path and timing for each operation.
Each step in this journey is called a "span," a data structure that records the operation name, start time, and duration. By linking spans together with parent-child relationships and a common trace ID, you get a complete, end-to-end flame graph of a request's lifecycle.
This is where the most powerful "aha!" moments happen. With a trace, an engineer can:
- Visually identify the specific microservice in a long chain that is introducing latency.
- See the full request path and associated logs for a failed transaction.
- Analyze service dependencies and detect cascading failures in real-time.
By correlating these three pillars—for example, linking a trace ID to all logs generated during that trace—an engineer can move seamlessly from a high-level alert (metric), to the specific error (log), and then see the full end-to-end context of the request that failed (trace). This interconnected view is what defines modern observability.
Architecting Your Open Source Observability Stack
Constructing a robust open source observability platform requires a clear architectural strategy. It's not about simply deploying tools; it's about designing a cohesive, scalable data pipeline that optimizes for performance, cost, and operability.
The cornerstone of a modern observability architecture is OpenTelemetry (OTel). Standardizing on the OTel SDKs for instrumentation and the OTel Collector for data processing provides a unified, vendor-agnostic data plane. This single decision prevents the operational nightmare of managing multiple, proprietary agents for metrics, logs, and traces, effectively future-proofing your instrumentation investment.
Once instrumented, services send telemetry to the OpenTelemetry Collector, which acts as a sophisticated data processing and routing layer. It can receive data in various formats (e.g., OTLP, Jaeger, Prometheus), process it (e.g., filter, batch, add attributes), and export it to multiple specialized backends. This "best-of-breed" architecture ensures each component is optimized for its specific task.
The diagram below shows how the three core pillars of observability—metrics, logs, and traces—work together. They're the foundation of the technical stack we're about to build.
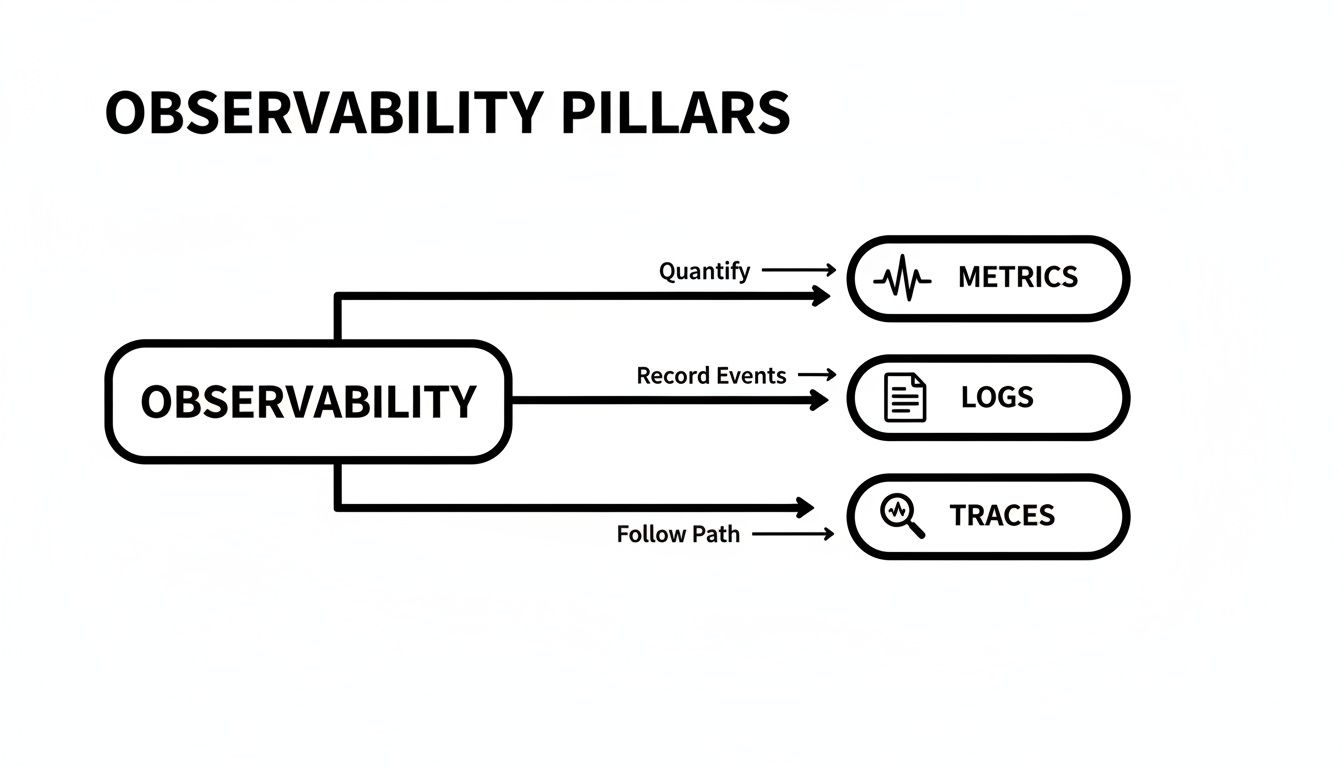
This flow is key. Metrics give you the hard numbers, logs provide the detailed story behind an event, and traces let you follow a request from start to finish. Together, they create a complete diagnostic toolkit.
The Core Components and Data Flow
Let's break down the technical components of a standard open source stack. This architecture is built around industry-standard projects, forming a powerful, cohesive platform that rivals commercial offerings.
Here's a technical overview of how these tools integrate to form the data pipeline.
Core Components of an Open Source Observability Stack
| Component | Primary Role | Key Integration |
|---|---|---|
| OpenTelemetry | Standardized instrumentation SDKs and a vendor-agnostic Collector for telemetry processing and routing. | Acts as the single entry point, forwarding processed telemetry via OTLP to Prometheus, Loki, and Jaeger. |
| Prometheus | A time-series database (TSDB) and querying engine, optimized for storing and alerting on metrics. | Receives metrics from the OTel Collector via remote_write or scraping OTel's Prometheus exporter. |
| Loki | A horizontally-scalable, multi-tenant log aggregation system inspired by Prometheus. | Receives structured logs from the OTel Collector, indexing only a small set of metadata labels. |
| Jaeger | A distributed tracing system for collecting, storing, and visualizing traces. | Receives trace data (spans) from the OTel Collector to provide end-to-end request analysis. |
| Grafana | The unified visualization and dashboarding layer for all telemetry data. | Connects to Prometheus, Loki, and Jaeger as data sources, enabling correlation in a single UI. |
This combination isn't just a technical curiosity; it’s a response to a massive market shift. The global Observability Platform Market is set to explode, projected to grow by USD 11.3 billion between 2026 and 2034. This surge, representing a 23.3% CAGR to hit USD 13.9 billion by 2034, shows just how critical scalable, cost-effective observability has become.
A Unified View with Grafana
Fragmented telemetry data is only useful when it can be correlated in a single interface. That's the role of Grafana.
Grafana serves as the "single pane of glass" by querying Prometheus, Loki, and Jaeger as independent data sources. This allows engineers to build dashboards that seamlessly correlate metrics, logs, and traces, drastically reducing the cognitive load during an incident investigation.
For example, an engineer can visualize a latency spike in a Prometheus graph, click a data point to pivot to the exact logs in Loki for that time window (using a shared job or instance label), and from a log line, use a derived field to jump directly to the full Jaeger trace for that traceID. This seamless workflow is what collapses Mean Time to Resolution (MTTR).
Putting It All Together: The Data Flow
Here is a step-by-step technical breakdown of the data flow:
- Instrumentation: An application, instrumented with the OpenTelemetry SDK for its language (e.g., Go, Java, Python), handles a user request. The SDK automatically generates traces and captures relevant metrics (e.g., RED method).
- Export: The SDK exports this telemetry data via the OpenTelemetry Protocol (OTLP) to a local or remote OpenTelemetry Collector agent.
- Processing & Routing: The Collector's pipeline configuration processes the data. For example, the
attributesprocessor adds Kubernetes metadata (k8s.pod.name,k8s.namespace.name), and thebatchprocessor optimizes network traffic before routing each signal to the appropriate backend. - Storage:
- Metrics are exported to a Prometheus instance using the
prometheusremotewriteexporter. - Logs, enriched with trace and span IDs, are sent to Grafana Loki via the
lokiexporter. - Traces are forwarded to Jaeger's collector endpoint using the
jaegerexporter.
- Metrics are exported to a Prometheus instance using the
- Visualization & Alerting: Grafana is configured with data sources for Prometheus, Loki, and Jaeger. Alerting rules defined in Prometheus are fired to Alertmanager, which handles deduplication, grouping, and routing of notifications. See our guide on monitoring Kubernetes with Prometheus for a practical example.
This modular, decoupled architecture provides immense flexibility. If you outgrow a single Prometheus instance, you can swap in a long-term storage solution like Thanos or Cortex without re-instrumenting a single application. This is the core technical advantage of building a composable open source observability platform: you retain control over your architecture's evolution.
Choosing Your Tools: A Guide to Technical Trade-Offs
Assembling your open source observability stack involves making critical architectural trade-offs that will directly impact scalability, operational cost, and maintainability. There is no single "correct" architecture; the optimal design depends on your scale, team expertise, and specific technical requirements.
One of the first major decisions is how to scale metric storage beyond a single Prometheus instance. While Prometheus is exceptionally efficient for real-time monitoring, its local TSDB is not designed for multi-year retention or a global query view across many clusters.
This leads to a fundamental choice: Prometheus federation vs. a dedicated long-term storage solution like Thanos or Cortex. Federation is simple but creates a single point of failure and a query bottleneck. Thanos and Cortex provide horizontal scalability and durable storage by shipping metric blocks to object storage (like S3 or GCS), but they introduce significant operational complexity with components like the Sidecar, Querier, and Store Gateway.
Managing High-Cardinality Data
A critical technical challenge in any observability system is managing high-cardinality data. Cardinality refers to the number of unique time series generated by a metric, determined by the combination of its name and label values. A metric like http_requests_total{path="/api/v1/users", instance="pod-1"} has low cardinality. One like http_requests_total{user_id="...", session_id="..."} can have millions of unique combinations, leading to a cardinality explosion.
High cardinality is a system killer, causing:
- Exponential Storage Growth: Each unique time series requires storage, leading to massive disk usage.
- Degraded Query Performance: Queries that need to aggregate across millions of series become slow or time out.
- High Memory Consumption: Prometheus must hold the entire index of time series in memory, leading to OOM (Out Of Memory) errors on the server.
Managing this requires a disciplined instrumentation strategy. Use high-cardinality labels only where absolutely necessary for debugging, and leverage tools that are designed to handle this data, such as exemplars in Prometheus, which link specific traces to metric data points without creating new series.
Comparing Query Languages and Ecosystems
The query language is the primary interface for debugging. Its expressiveness and performance directly impact your team's ability to resolve incidents quickly.
The real goal is to pick a toolset that not only works for your infrastructure but also works for your team. A super-powerful query language that no one knows how to use is a liability during an outage when every second counts.
Prometheus's PromQL is a powerful, functional query language designed specifically for time-series data. It excels at aggregations, rate calculations, and predictions. In contrast, Loki's LogQL is syntactically similar but optimized for querying log streams based on their metadata labels, with full-text search as a secondary filter. Understanding the strengths and limitations of each is crucial for effective use.
If you want to dig deeper into how different solutions stack up, check out our guide on comparing application performance monitoring tools.
The maturity of each tool's ecosystem is equally important. Assess factors like:
- Community Support: Active Slack channels, forums, and GitHub issue trackers are invaluable for troubleshooting.
- Documentation Quality: Clear, comprehensive, and up-to-date documentation is a non-negotiable requirement.
- Integration Points: Native integrations with tools like Grafana, Alertmanager, and OpenTelemetry are essential for a cohesive workflow.
The move toward open source observability is undeniable, especially in the cloud. These tools are winning because they are built for cloud-native environments and offer powerful, integrated solutions without the proprietary price tag. Research from Market.us shows that cloud-based deployments have already captured 67.5% of the market, fueled by the scalability and pay-as-you-go models of platforms like AWS, Azure, and GCP. Read the full research about these market trends. This trend just reinforces how important it is to choose tools that are cloud-native and have strong community backing to ensure your platform can grow with you.
Your Phased Implementation Roadmap
Implementing a comprehensive open source observability platform requires a methodical, phased approach. A "big bang" migration is a recipe for operational chaos, budget overruns, and team burnout. A phased rollout mitigates risk, demonstrates incremental value, and allows the team to build expertise gradually.
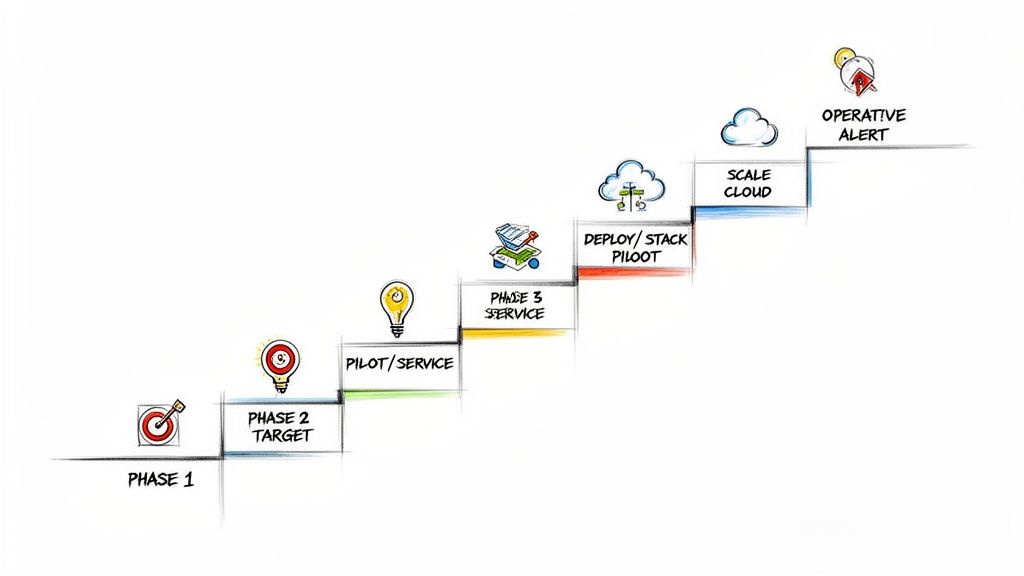
This roadmap breaks the journey into five distinct, actionable phases, transforming an intimidating project into a manageable, value-driven process.
Phase 1: Define Your Goals
Before deploying any software, define the technical and business objectives. Without clear, measurable goals, your project will lack direction and justification.
Answer these critical questions:
- What specific pain are we trying to eliminate? High MTTR? Poor visibility into microservice dependencies? Unsustainable proprietary tool costs?
- Which services are the initial targets? Identify a critical but non-catastrophic service to serve as the pilot. This service should have known performance issues that can be used to demonstrate the value of the new platform.
- What are our success metrics (KPIs)? Establish a baseline for key metrics like p99 latency, error rate, and Mean Time to Resolution (MTTR) for the pilot service. This is essential for quantifying the project's ROI.
This phase provides the architectural constraints and business justification needed to guide all subsequent technical decisions.
Phase 2: Launch a Pilot Project
The goal of this phase is to achieve a quick win by instrumenting a single service and proving the data pipeline works end-to-end. This is a technical validation phase, not a full-scale deployment.
Select a single, well-understood application. Your primary task is to instrument this service using the appropriate OpenTelemetry SDK to generate metrics, logs, and traces. Configure the application to export this telemetry via OTLP to a standalone OTel Collector instance.
This pilot is your technical proving ground. It lets your team get their hands dirty with OpenTelemetry's SDKs and the OTel Collector, working through the real-world challenges of instrumentation in a low-stakes environment. The goal is to get real, tangible data flowing that you can actually look at.
Phase 3: Deploy the Core Stack
With telemetry flowing from the pilot service, it's time to deploy the minimal viable backend to receive, store, and visualize the data. This is where the architecture takes shape.
Your deployment checklist for this phase should include:
- Prometheus: Deploy a single Prometheus server. Configure its
prometheus.ymlto scrape the OTel Collector's Prometheus exporter endpoint. - Loki: Deploy a single-binary Loki instance. Configure the OTel Collector's
lokiexporter to send logs to it. - Jaeger: Deploy the all-in-one Jaeger binary for a simple, non-production setup. Configure the OTel Collector's
jaegerexporter. - Grafana: Deploy Grafana and configure the Prometheus, Loki, and Jaeger data sources. Build an initial dashboard correlating the pilot service's telemetry.
At the end of this phase, your team should be able to see metrics, logs, and traces from the pilot service correlated in a single Grafana dashboard, proving the viability of the integrated stack.
Phase 4: Scale Your Platform
With the core stack validated, the focus shifts to production readiness, scalability, and broader adoption. This phase involves hardening the backend and systematically instrumenting more services.
A key technical task is scaling the metrics backend. As you onboard more services, a single Prometheus instance will become a bottleneck. This is the point to implement a long-term storage solution like Thanos or Cortex. This typically involves deploying a sidecar alongside each Prometheus instance to upload TSDB blocks to object storage.
Concurrently, begin a methodical rollout of OpenTelemetry instrumentation across other critical services. Develop internal libraries and documentation to standardize instrumentation practices, such as consistent attribute naming and cardinality management, to ensure data quality and control costs.
Phase 5: Operationalize and Optimize
The final phase transforms the platform from a data collection system into a proactive operational tool. This involves defining service reliability goals and automating alerting.
This phase is driven by two key SRE practices:
- Defining SLOs: For each critical service, establish Service Level Objectives (SLOs) for key indicators like availability and latency. For example, "99.9% of
/api/v1/loginrequests over a 28-day period should complete in under 200ms." - Configuring Alerts: Implement SLO-based alerting rules in Prometheus. Instead of alerting on simple thresholds (e.g., CPU > 90%), alert on the rate of error budget consumption. This makes alerts more meaningful and actionable, reducing alert fatigue.
This relentless focus on reliability is exactly why DevOps and SRE teams are flocking to open source observability. On average, organizations are seeing a 2.6x ROI from their observability investments, mostly from boosting developer productivity, and 63% plan to spend even more. This final phase is what ensures your platform delivers on that promise by directly connecting system performance to what your business and users actually expect. To see how engineering leaders are using these tools, discover more insights about observability tool evaluation.
Common Questions About Open Source Observability
Migrating to an open source observability stack is a significant engineering undertaking. It requires a shift in both technology and operational mindset. Addressing the common technical and strategic questions upfront is crucial for success.
Let's dissect the most frequent questions from teams architecting their own open source observability platform.
What Is the Biggest Challenge When Migrating from a Proprietary Tool?
The single greatest challenge is the transfer of operational responsibility. With a SaaS vendor, you are paying for a managed service that abstracts away the complexity of hosting, scaling, and maintaining the platform. When you build your own, your team inherits this entire operational burden.
Your team becomes responsible for:
- Infrastructure Management: Provisioning, configuring, and managing the lifecycle of compute, storage, and networking for every component. This is typically done via Infrastructure as Code (e.g., Terraform, Helm charts).
- Scalability Engineering: Proactively scaling each component of the stack. This requires deep expertise in technologies like Kubernetes Horizontal Pod Autoscalers, Prometheus sharding, and Loki's microservices deployment model.
- Update and Patch Cycles: Managing the security patching and version upgrades for every open source component, including handling breaking changes.
Additionally, achieving feature parity with mature commercial platforms (e.g., AIOps, automated root cause analysis, polished user interfaces) requires significant, ongoing software development effort.
How Does OpenTelemetry Fit into an Open Source Observability Stack?
OpenTelemetry (OTel) is the data collection standard that decouples your application instrumentation from your observability backend. It provides a unified set of APIs, SDKs, and a wire protocol (OTLP) for all three telemetry signals.
Instead of using separate, vendor-specific agents for metrics (e.g., Prometheus Node Exporter), logs (e.g., Fluentd), and traces (e.g., Jaeger Agent), you instrument your code once with the OTel SDK. The data is then sent to the OTel Collector, which can route it to any OTel-compatible backend—open source or commercial.
This is a powerful strategy for avoiding vendor lock-in. It allows you to change your backend tools (e.g., migrate from Jaeger to another tracing backend) without modifying a single line of application code, thus future-proofing your entire instrumentation investment.
Is an Open Source Observability Platform Really Cheaper?
The answer lies in the Total Cost of Ownership (TCO), not just licensing fees. You are trading software subscription costs for infrastructure and operational labor costs.
The TCO of an open source observability platform includes:
- Infrastructure Costs: The recurring cloud or hardware costs for compute instances, block/object storage, and network egress.
- Engineering Time (OpEx): The fully-loaded cost of the SREs or DevOps engineers required to build, maintain, and scale the platform. This is often the largest component of the TCO.
- Expertise Overhead: The potential cost of hiring or training engineers with specialized skills in Kubernetes, time-series databases, and distributed systems.
For small-scale deployments, an open source solution is often significantly cheaper. At massive scale (petabytes of data ingest per day), the required investment in engineering headcount can become substantial. The primary driver for adopting open source at scale is not just cost savings, but the strategic value of ultimate control, infinite customizability, and freedom from vendor pricing models that penalize data growth.
Ready to build a robust observability stack without the operational headache? OpsMoon connects you with elite DevOps and SRE experts who can design, implement, and manage a high-performance open source platform tailored to your needs. Start with a free work planning session and let us build your roadmap to better observability. Learn more at OpsMoon.
Leave a Reply