When you're running applications in Kubernetes, legacy monitoring tools simply cannot keep up. Pods, services, and nodes are ephemeral by design, constantly being created and destroyed. You need a monitoring system that thrives in this dynamic, ever-changing environment. This is precisely where Prometheus excels, making it the bedrock of modern cloud-native observability.
It has become the de facto standard for a reason. Its design philosophy aligns perfectly with the core principles of Kubernetes.
Why Prometheus Just Works for Kubernetes
Prometheus’s dominance in the Kubernetes ecosystem isn't accidental. It was built from the ground up to handle the kind of ephemeral infrastructure that Kubernetes orchestrates.
Its pull-based architecture, for instance, is a critical design choice. Prometheus actively scrapes metrics from HTTP endpoints on its targets at regular intervals. This means you don't need to configure every single application pod to push data to a central location. Prometheus handles discovery and collection, which radically simplifies instrumentation and reduces operational overhead.
Built for Constant Change
The real magic is how Prometheus discovers what to monitor. It integrates directly with the Kubernetes API to automatically find new pods, services, and endpoints the moment they are created. This completely eliminates the need for manual configuration updates every time a deployment is scaled or a pod is rescheduled.
This deep integration is why its adoption has skyrocketed alongside Kubernetes itself. The Cloud Native Computing Foundation (CNCF) found that 82% of container users now run Kubernetes in production. As Kubernetes became ubiquitous, Prometheus was right there with it, becoming the natural choice for real-time metrics.
To truly leverage Prometheus, you must understand its core components and their specific functions.
Prometheus Core Components and Their Roles
Here's a technical breakdown of the essential pieces of the Prometheus ecosystem and the roles they play in a Kubernetes setup.
| Component | Primary Function | Key Benefit in Kubernetes |
|---|---|---|
| Prometheus Server | Scrapes and stores time-series data from configured targets in its local TSDB. | Acts as the central brain for collecting metrics from ephemeral pods and services via service discovery. |
| Client Libraries | Instrument application code to expose custom metrics via a /metrics HTTP endpoint. |
Allows developers to easily expose application-specific metrics like request latency or error rates. |
| Push Gateway | An intermediary metrics cache for short-lived jobs that can't be scraped directly. | Useful for capturing metrics from batch jobs or serverless functions that complete before a scrape. |
| Exporters | Expose metrics from third-party systems (e.g., databases, hardware) in Prometheus format. | Enables monitoring of non-native services like databases (Postgres, MySQL) or infrastructure (nodes). |
| Alertmanager | Handles alerts sent by the Prometheus server, including deduplication, grouping, and routing. | Manages alerting logic, ensuring the right on-call teams are notified via Slack, PagerDuty, etc. |
| Service Discovery (SD) | Automatically discovers targets to scrape from various sources, including the K8s API. | The key to dynamic monitoring; automatically finds and monitors new services as they are deployed. |
Grasping how these components interoperate is the first step toward building a robust monitoring stack. Each component solves a specific problem, and together, they provide a comprehensive observability solution.
At its core, Prometheus uses a multi-dimensional data model. Metrics aren't just a name and a value; they're identified by a metric name and a set of key-value pairs called labels. This lets you slice and dice your data with incredible precision. You can move beyond simple host-based monitoring to a world where you can query metrics by microservice, environment (
env="prod"), or even a specific app version (version="v1.2.3").
The Power of PromQL
Another killer feature is PromQL, the Prometheus Query Language. It’s an incredibly flexible and powerful functional language designed specifically for time-series data. It lets engineers perform complex aggregations, calculations, and transformations directly in the query.
With PromQL, you can build incredibly insightful dashboards in Grafana or write the precise alerting rules needed to maintain your Service Level Objectives (SLOs). This is where the real value comes in, translating raw metrics into actionable intelligence.
By combining these capabilities, you start to see real-world business impact:
- Faster Incident Resolution: You can pinpoint the root cause of an issue by correlating metrics across different services and infrastructure layers.
- Reduced Downtime: Proactive alerts on metrics like
rate(http_requests_total{status_code=~"5.."}[5m])help your team fix problems before they ever affect users. - Smarter Performance Tuning: Analyzing historical trends helps you optimize resource allocation and make your applications more efficient.
Understanding these fundamentals is key. For more advanced strategies, you can explore our guide on Kubernetes monitoring best practices. The combination of automated discovery, a flexible data model, and a powerful query language is what truly solidifies Prometheus's position as the undisputed standard for Prometheus monitoring Kubernetes.
Deploying a Production-Ready Prometheus Stack
Let's move from theory to practice. For a production-grade Prometheus monitoring Kubernetes setup, manually deploying each component is a recipe for operational failure. It's slow, error-prone, and difficult to maintain.
Instead, we will use the industry-standard kube-prometheus-stack Helm chart. This chart bundles the Prometheus Operator, Prometheus itself, Alertmanager, Grafana, and essential exporters into one cohesive package.
This approach leverages the Prometheus Operator, which introduces Custom Resource Definitions (CRDs) like ServiceMonitor and PrometheusRule. This allows you to manage your entire monitoring configuration declaratively using YAML, just like any other Kubernetes resource.
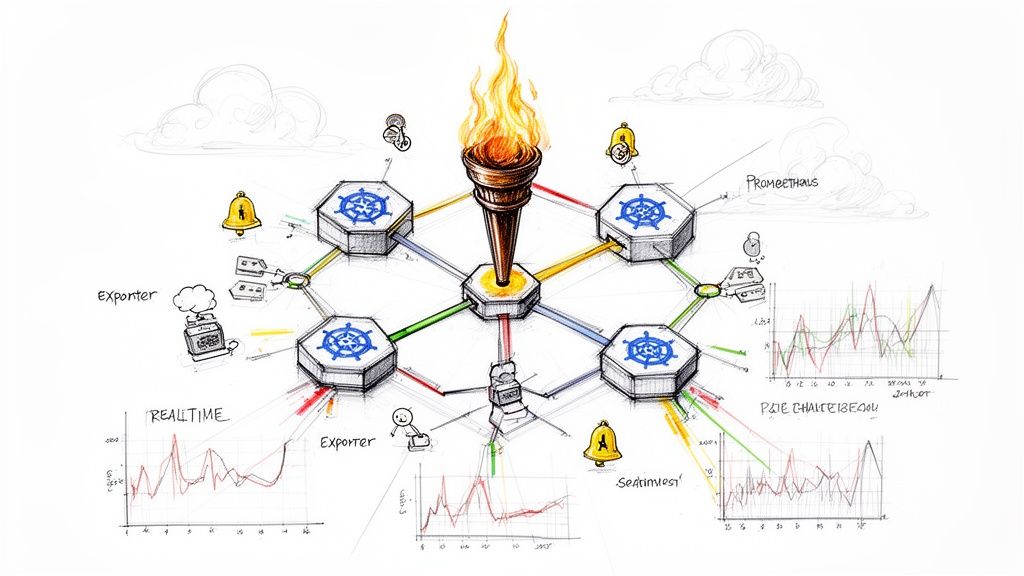
This diagram gives you a high-level view of how metrics flow from your Kubernetes cluster, through Prometheus, and ultimately onto a dashboard where you can make sense of it all.
Think of Prometheus as the central engine, constantly pulling data from your dynamic Kubernetes environment and feeding it into tools like Grafana for real, actionable insights.
Preparing Your Environment for Deployment
Before deployment, ensure you have the necessary command-line tools installed and configured to communicate with your Kubernetes cluster:
- kubectl: The standard Kubernetes command-line tool.
- Helm: The package manager for Kubernetes. It simplifies the deployment and management of complex applications.
First, add the prometheus-community Helm repository. This informs Helm where to find the kube-prometheus-stack chart.
helm repo add prometheus-community https://prometheus-community.github.io/helm-charts
helm repo update
These commands ensure your local Helm client is pointing to the correct repository and has the latest chart information.
Customizing the Deployment with a values.yaml File
A default installation is suitable for testing, but a production environment requires specific configuration. We will create a values.yaml file to override the chart's defaults. This file becomes the single source of truth for our monitoring stack's configuration.
Create a file named values.yaml. We'll populate it with essential configurations.
The kube-prometheus-stack is modular, allowing you to enable or disable components. For this guide, we will enable the full stack: Prometheus, Grafana, Alertmanager, node-exporter, and kube-state-metrics.
# values.yaml

# Enable core components
prometheus:
  enabled: true

grafana:
  enabled: true

alertmanager:
  enabled: true

# Enable essential exporters
kube-state-metrics:
  enabled: true

prometheus-node-exporter:
  enabled: true
The node-exporter is critical for collecting hardware and OS metrics from each cluster node. kube-state-metrics provides invaluable data on the state of Kubernetes objects like Deployments, Pods, and Services. Both are essential for comprehensive cluster monitoring.
Configuring Persistent Storage
By default, Prometheus and Alertmanager store data in ephemeral emptyDir volumes. This means if a pod restarts, all historical metrics and alert states are lost—a critical failure point in a production environment.
We will configure PersistentVolumeClaims (PVCs) to provide durable storage.
Pro Tip: Always use a
StorageClassthat provisions high-performance, SSD-backed volumes for the Prometheus TSDB (Time Series Database). Disk I/O performance directly impacts query speed and ingest rate.
Add the following block to your values.yaml file.
# values.yaml (continued)

prometheus:
  prometheusSpec:
    # Ensure data survives pod restarts
    storageSpec:
      volumeClaimTemplate:
        spec:
          storageClassName: standard # Change to your preferred StorageClass (e.g., gp2, premium-ssd)
          accessModes: ["ReadWriteOnce"]
          resources:
            requests:
              storage: 50Gi # Adjust based on your retention needs and metric volume

alertmanager:
  alertmanagerSpec:
    # Persist alert states and silences
    storage:
      volumeClaimTemplate:
        spec:
          storageClassName: standard # Change to your preferred StorageClass
          accessModes: ["ReadWriteOnce"]
          resources:
            requests:
              storage: 10Gi
This configuration instructs Helm to create PVCs for both Prometheus and Alertmanager. A starting size of 50Gi for Prometheus is a reasonable baseline, but you must adjust this based on your metric cardinality, scrape interval, and desired retention period.
Securing Grafana Access
The default installation uses a well-known administrator password for Grafana (prom-operator). Leaving this unchanged is a significant security vulnerability.
The recommended best practice for handling credentials in Kubernetes is to use a Secret, rather than hardcoding them in the values.yaml file.
First, create a monitoring namespace if it doesn't exist, then create the secret within it. Replace 'YOUR_SECURE_PASSWORD' with a cryptographically strong password.
# It is best practice to deploy monitoring tools in a dedicated namespace
kubectl create namespace monitoring

# Replace 'YOUR_SECURE_PASSWORD' with a strong password
kubectl create secret generic grafana-admin-credentials \
  --from-literal=admin-user=admin \
  --from-literal=admin-password='YOUR_SECURE_PASSWORD' \
  -n monitoring
Now, configure Grafana in your values.yaml to use this secret:
# values.yaml (continued)

grafana:
  # Use an existing secret for the admin user
  admin:
    existingSecret: "grafana-admin-credentials"
    userKey: "admin-user"
    passwordKey: "admin-password"
This approach adheres to security best practices by keeping sensitive credentials out of your version-controlled values.yaml file.
Deploying the Stack with Helm
With our custom values.yaml prepared, we can deploy the entire stack with a single Helm command into the monitoring namespace.
helm install prometheus-stack prometheus-community/kube-prometheus-stack \
  --namespace monitoring \
  --values values.yaml
Helm will now orchestrate the deployment of all components. To verify the installation, check the pod status in the monitoring namespace after a few minutes.
kubectl get pods -n monitoring
You should see running pods for Prometheus, Alertmanager, Grafana, node-exporter (one for each node in your cluster), and kube-state-metrics. This solid foundation is now ready for scraping custom metrics and building a powerful Prometheus monitoring Kubernetes solution.
Configuring Service Discovery with CRDs
With your Prometheus stack deployed, the next step is to configure it to scrape metrics from your applications. In a static environment, you might list server IP addresses in a configuration file. This approach is untenable in Kubernetes, where pods are ephemeral and services scale dynamically. This is where the real power of Prometheus monitoring Kubernetes shines: automated service discovery.
The Prometheus Operator extends the Kubernetes API with Custom Resource Definitions (CRDs) that automate service discovery. Instead of managing a monolithic prometheus.yml file, you define scrape targets declaratively using Kubernetes manifests. The two most important CRDs for this are ServiceMonitor and PodMonitor.
Targeting Applications with ServiceMonitor
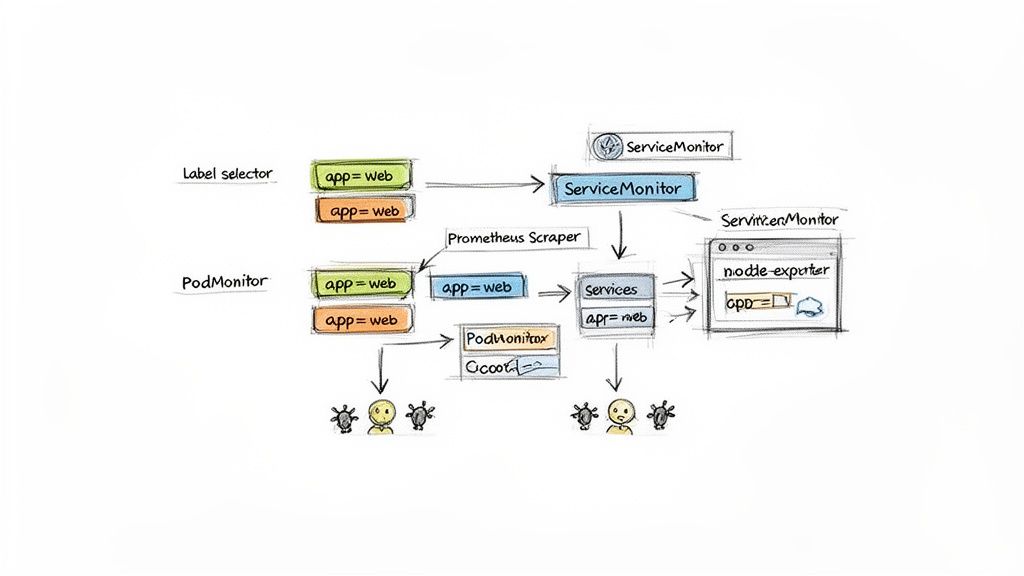
A ServiceMonitor is a CRD that declaratively specifies how a group of Kubernetes Services should be monitored. It uses label selectors to identify the target Services and defines the port and path where Prometheus should scrape metrics. This is the standard and most common method, which you'll use for 90% of your applications.
Consider a web application with the following Service manifest:
apiVersion: v1
kind: Service
metadata:
  name: my-webapp-svc
  labels:
    app.kubernetes.io/name: my-webapp
    release: production
  namespace: my-app
spec:
  selector:
    app.kubernetes.io/name: my-webapp
  ports:
  - name: web
    port: 80
    targetPort: 8080
  - name: metrics # A dedicated port for Prometheus metrics
    port: 9090
    targetPort: 9090
To configure Prometheus to scrape this service, you create a corresponding ServiceMonitor. The key is using a selector to match the labels of my-webapp-svc.
apiVersion: monitoring.coreos.com/v1
kind: ServiceMonitor
metadata:
  name: my-webapp-monitor
  labels:
    release: prometheus-stack # This must match the operator's selector
  namespace: my-app
spec:
  selector:
    matchLabels:
      app.kubernetes.io/name: my-webapp
      release: production
  namespaceSelector:
    matchNames:
    - my-app
  endpoints:
  - port: metrics
    interval: 15s
    path: /metrics
The Prometheus Operator is configured to watch for ServiceMonitor objects that have the release: prometheus-stack label. Upon finding one, it automatically generates the required scrape configuration and dynamically reloads the running Prometheus instance. This is a completely hands-off process. To learn more about the underlying mechanics, explore our article on what is service discovery.
When to Use PodMonitor
While ServiceMonitor is the default choice, PodMonitor allows you to scrape pods directly, bypassing the Service abstraction. It operates similarly, using label selectors to find pods instead of services.
PodMonitor is useful in specific scenarios:
- Headless Services: To scrape every individual pod backing a stateful service, such as a database cluster (e.g., Zookeeper, Cassandra).
- Direct Pod Metrics: For monitoring specific sidecar containers or other components not exposed through a standard Service.
- Exporter DaemonSets: A perfect use case for scraping exporters like
node-exporterthat run on every node.
The manifest is nearly identical to a ServiceMonitor; you just target pod labels instead of service labels.
The primary advantage of this CRD-based approach is managing your monitoring configuration as code. Your
ServiceMonitorlives in the same repository as your application'sDeploymentandServicemanifests. When you deploy a new microservice, you deploy its monitoring configuration with it. This declarative, GitOps-friendly workflow is essential for operating Kubernetes at scale.
Collecting Node-Level Metrics with DaemonSets
Applications run on Kubernetes nodes, making host-level metrics—CPU, memory, disk I/O, network I/O—essential for a complete operational view. The industry-standard tool for this is the node-exporter.
To ensure node-exporter runs on every node, both current and future, it is deployed as a DaemonSet. A DaemonSet is a Kubernetes controller that guarantees a copy of a specified pod runs on each node in the cluster.
The kube-prometheus-stack Helm chart we installed already handles this. It deploys node-exporter as a DaemonSet and creates the corresponding ServiceMonitor to scrape it automatically, providing instant visibility into the health of your underlying infrastructure.
Fine-Tuning Scrapes with Relabeling
Sometimes, the labels exposed by an application or exporter are inconsistent or lack necessary context. Prometheus provides an incredibly powerful mechanism to transform labels before metrics are ingested: relabeling.
Within your ServiceMonitor or PodMonitor, you can define relabel_configs to perform various transformations:
- Dropping unwanted metrics or targets:
action: drop - Keeping only specific metrics or targets:
action: keep - Renaming, adding, or removing labels:
action: labelmap,action: replace
For instance, you could use relabeling to add a cluster_name label to all metrics scraped from a specific ServiceMonitor, which is invaluable when aggregating data from multiple clusters in a centralized Grafana instance. Mastering these CRDs and techniques allows you to automatically discover and monitor any workload, creating a truly dynamic and scalable Prometheus monitoring Kubernetes solution.
Building Actionable Alerts and Insightful Dashboards
Collecting metrics is only the first step. Raw data is useless until it is transformed into actionable intelligence. For Prometheus monitoring Kubernetes, this means creating precise alerts that detect real problems without generating excessive noise, and building dashboards that provide an immediate, intuitive view of your cluster's health.
First, we'll configure Alertmanager to process and route alerts from Prometheus. Then, we will use Grafana to visualize the collected data.
Defining Actionable Alerts with PrometheusRule
The Prometheus Operator provides a Kubernetes-native approach to managing alerting rules via the PrometheusRule Custom Resource Definition (CRD). This allows you to define alerts in YAML manifests, which can be version-controlled and deployed alongside your applications.
Let's create a practical alert that fires when a pod's CPU usage is consistently high—a common indicator of resource pressure that can lead to performance degradation.
Create a new file named cpu-alerts.yaml:
apiVersion: monitoring.coreos.com/v1
kind: PrometheusRule
metadata:
  name: high-cpu-usage-alert
  namespace: monitoring
  labels:
    # This label is crucial for the Operator to discover the rule
    release: prometheus-stack
spec:
  groups:
  - name: kubernetes-pod-alerts
    rules:
    - alert: KubePodHighCPU
      expr: |
        sum(rate(container_cpu_usage_seconds_total{image!=""}[5m])) by (namespace, pod)
        /
        sum(kube_pod_container_resource_limits{resource="cpu"}) by (namespace, pod)
        > 0.80
      for: 10m
      labels:
        severity: warning
      annotations:
        summary: "Pod {{ $labels.pod }} in namespace {{ $labels.namespace }} has high CPU usage."
        description: "CPU usage for pod {{ $labels.pod }} is over 80% of its defined limit for the last 10 minutes."
Technical breakdown of this rule:
expr: The core PromQL query. It calculates the 5-minute average CPU usage for each pod as a percentage of its defined CPU limit.for: 10m: This clause prevents "flapping" alerts. The expression must remain true for a continuous 10-minute period before the alert transitions to aFiringstate. This filters out transient spikes.labels: Custom labels, likeseverity, can be attached to alerts. These are used for routing logic in Alertmanager.annotations: Human-readable information for notifications. Go templating (e.g.,{{ $labels.pod }}) dynamically inserts label values from the metric.
Apply this rule to your cluster:
kubectl apply -f cpu-alerts.yaml -n monitoring
The Prometheus Operator will detect this new PrometheusRule resource and automatically update the running Prometheus configuration. To master writing such expressions, consult our deep dive on the Prometheus Query Language.
Routing Notifications with Alertmanager
With Prometheus identifying problems, we need Alertmanager to route notifications to the appropriate teams. We'll configure it to send alerts to a Slack channel. This configuration can be managed directly in our values.yaml file and applied with a helm upgrade.
First, obtain a Slack Incoming Webhook URL. Then, add the following configuration to your values.yaml:
alertmanager:
  config:
    global:
      resolve_timeout: 5m
      slack_api_url: '<YOUR_SLACK_WEBHOOK_URL>'

    route:
      group_by: ['namespace', 'alertname']
      group_wait: 30s
      group_interval: 5m
      repeat_interval: 2h
      receiver: 'slack-notifications'
      routes:
      - receiver: 'slack-notifications'
        match_re:
          severity: warning|critical
        continue: true

    receivers:
    - name: 'slack-notifications'
      slack_configs:
      - channel: '#cluster-alerts'
        send_resolved: true
        title: '[{{ .Status | toUpper }}{{ if eq .Status "firing" }}:{{ .Alerts.Firing | len }}{{ end }}] {{ .CommonLabels.alertname }}'
        text: "{{ range .Alerts }}• *Alert*: {{ .Annotations.summary }}\n> {{ .Annotations.description }}\n{{ end }}"
This configuration does more than just forward messages. The
routeblock contains grouping rules (group_by,group_interval) that are essential for preventing alert storms. If 20 pods in the same namespace begin to exceed their CPU limits simultaneously, Alertmanager will intelligently bundle them into a single, concise notification rather than flooding your Slack channel with 20 separate messages.
Visualizing Metrics with Grafana Dashboards
The final step is visualization. Grafana is the industry standard for this purpose. The Helm chart has already deployed Grafana and pre-configured Prometheus as a data source.
A quick way to get started is by importing a popular community dashboard. The "Kubernetes Cluster Monitoring (via Prometheus)" dashboard (ID: 3119) is an excellent choice.
- Access your Grafana UI by port-forwarding the Grafana service:
kubectl port-forward svc/prometheus-stack-grafana 8080:80 -n monitoring. Access it athttp://localhost:8080. - Navigate to
Dashboards->Browsefrom the left-hand menu. - Click
Importand enter the ID3119. - Select your Prometheus data source and click
Import.
You now have a comprehensive dashboard providing insight into your cluster's health, covering node resource utilization, pod status, and deployment statistics.
To create a custom dashboard panel for tracking pod restarts—a key indicator of application instability:
- Create a new dashboard and click
Add panel. - In the query editor, ensure your Prometheus data source is selected.
- Enter the following PromQL query, replacing
<your-app-namespace>with your target namespace:sum(rate(kube_pod_container_status_restarts_total{namespace="<your-app-namespace>"}[5m])) by (pod) - In the
Visualizationsettings on the right, selectTime series. - Under
Panel options, set the title to "Pod Restarts (5m Rate)".
This panel provides a per-pod restart rate, making it easy to identify crash-looping containers. By combining proactive alerting with insightful dashboards, you transform raw metrics into a powerful system for maintaining the health and performance of your Kubernetes cluster.
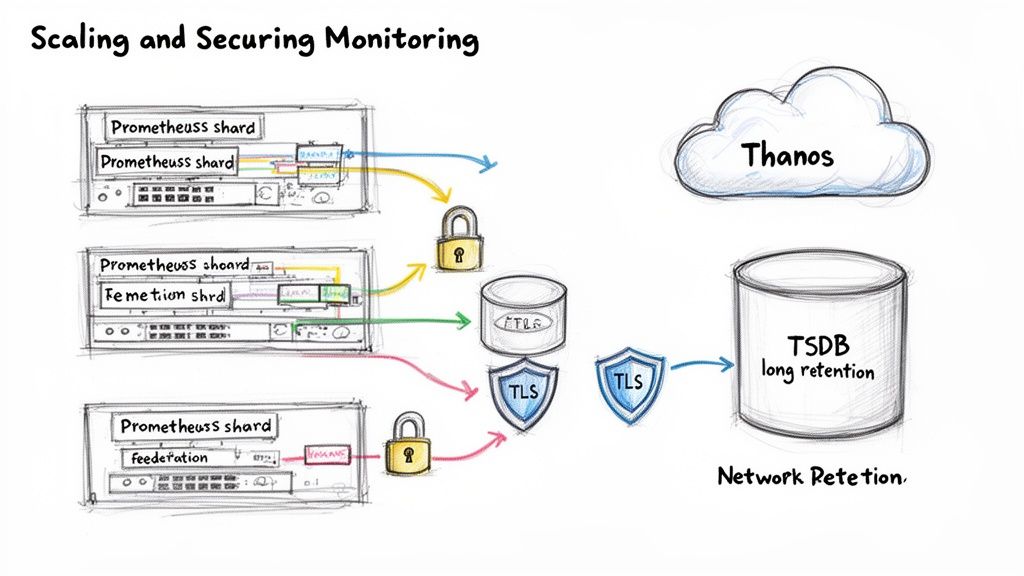
Scaling and Securing Your Monitoring Architecture
Transitioning your Prometheus monitoring Kubernetes setup to a production-grade architecture requires addressing scale, long-term data retention, and security. A single Prometheus instance, while powerful, will eventually encounter limitations in query performance and storage capacity as your cluster footprint expands.
The first major challenge is long-term data retention. Prometheus's local time-series database (TSDB) is highly optimized for recent data but is not designed to store months or years of metrics. This is insufficient for compliance audits, long-term trend analysis, or capacity planning.
Implementing Long-Term Storage with Thanos
Remote storage solutions like Thanos address this limitation. Thanos enhances Prometheus by providing a global query view, virtually unlimited retention via object storage (e.g., Amazon S3, GCS), and downsampling capabilities.
Integrating Thanos involves deploying several key components:
- Thanos Sidecar: A container that runs alongside each Prometheus pod. It uploads newly created TSDB blocks to object storage every two hours and exposes a gRPC Store API for real-time data querying.
- Thanos Querier: A central query entry point. It fetches data from both the Sidecar's real-time API and the historical data in object storage, providing a seamless, unified view across all clusters and time ranges.
- Thanos Compactor: A singleton service that performs maintenance on the object storage bucket. It compacts data, enforces retention policies, and creates downsampled aggregates to accelerate long-range queries.
By offloading historical data to cost-effective object storage, you decouple storage from the Prometheus server. This allows you to retain years of metrics without provisioning massive, expensive PersistentVolumes, transforming a basic setup into a highly scalable, long-term observability platform.
Scaling Across Multiple Clusters
As your organization grows, you will likely manage multiple Kubernetes clusters. Scraping all metrics into a single, centralized Prometheus instance is an anti-pattern that leads to high network latency and unmanageable metric volume.
Two proven patterns for multi-cluster monitoring are federation and sharding.
Prometheus Federation is a hierarchical model. Each cluster has its own local Prometheus instance for detailed, high-cardinality scraping. A central, "global" Prometheus server then scrapes a curated, aggregated subset of metrics from these downstream instances. This provides a high-level, cross-cluster view without the overhead of centralizing all raw metrics.
Sharding is a horizontal scaling strategy within a single large cluster. You partition scrape targets across multiple Prometheus instances. For example, one Prometheus shard could monitor infrastructure components (node-exporter, kube-state-metrics) while another shard monitors application metrics. This prevents any single Prometheus server from becoming a performance bottleneck.
Securing Monitoring Endpoints
By default, Prometheus, Alertmanager, and Grafana endpoints are exposed within the cluster network. In a production environment, this poses a security risk.
Your first line of defense is Kubernetes NetworkPolicies. You can define policies to strictly control ingress traffic to your monitoring components, for instance, allowing only the Grafana pod to query the Prometheus API, effectively creating a network-level firewall.
For external access, an Ingress controller with TLS termination is mandatory. By creating an Ingress resource for Grafana, you can securely expose it via HTTPS. The next step is to layer on authentication, either by deploying an OAuth2 proxy sidecar or using your Ingress controller's native support for external authentication providers (e.g., OIDC, LDAP). This ensures all connections are encrypted and only authorized users can access your dashboards.
Common Questions About Prometheus and Kubernetes
Even with a well-architected deployment, you will encounter challenges when running Prometheus in a real-world Kubernetes environment. Let's address some of the most common questions.
A frequent question is, "When do I use a ServiceMonitor versus a PodMonitor?" You will use ServiceMonitor for the vast majority of cases (~90%). It is the standard method for scraping metrics from a stable Kubernetes Service endpoint, which is ideal for stateless applications.
PodMonitor is reserved for special cases. It scrapes pods directly, bypassing the Service abstraction. This is necessary for headless services like database clusters, or when you need to target a specific sidecar container that is not exposed through the main Service.
Scaling and Data Retention
"How should I handle long-term data storage?" Prometheus's local TSDB is optimized for short-term, high-performance queries, not for storing months or years of metrics.
The industry-standard solution is to use Prometheus's remote_write feature to stream metrics in real-time to a dedicated long-term storage system. Popular choices include:
- Thanos: Excellent for creating a global query view across multiple clusters and integrating with object storage.
- VictoriaMetrics: Known for its high performance and storage efficiency.
This hybrid model provides the best of both worlds: fast local queries for recent operational data and a cost-effective, durable backend for long-term analysis.
As distributed systems become the norm, the convergence of Prometheus with OpenTelemetry (OTel) is a major trend in Kubernetes observability. It marks a shift away from siloed metrics and toward unified telemetry—correlating metrics, logs, and traces. With Prometheus as the metrics backbone, this is mission-critical for understanding complex workloads. You can explore more about these Kubernetes monitoring trends on Site24x7.
Optimizing Performance
Finally, how do you prevent Prometheus from consuming excessive resources in a large cluster?
The key is proactive resource management. Always define resource requests and limits for your Prometheus pods to ensure they operate within predictable bounds. More importantly, monitor for high-cardinality metrics—those with a large number of unique label combinations—as they are the primary cause of high memory usage. You can mitigate this by using recording rules to pre-aggregate expensive queries and by using relabel_configs to drop unnecessary labels before they are ingested.
Ready to implement a production-grade DevOps strategy without the operational overhead? OpsMoon connects you with the top 0.7% of remote DevOps engineers to build, scale, and secure your infrastructure. Start with a free work planning session to map your roadmap and get matched with the perfect expert for your needs at https://opsmoon.com.
Leave a Reply