Running Kubernetes on bare metal is exactly what it sounds like: deploying K8s directly onto physical servers, ditching the hypervisor layer entirely. It’s a move teams make when they need to squeeze every last drop of performance out of their hardware, rein in infrastructure costs at scale, or gain total control over their stack. This is the go-to approach for latency-sensitive workloads—think AI/ML, telco, and high-frequency trading.
Why Bare Metal? It's About Performance and Control
For years, the default path to Kubernetes was through the big cloud providers. It made sense; they abstracted away all the messy infrastructure. But as teams get more sophisticated, we're seeing a major shift. More and more organizations are looking at running Kubernetes on bare metal to solve problems the cloud just can't, especially around raw performance, cost, and fine-grained control.
This isn't about ditching the cloud. It's about being strategic. For certain workloads, direct hardware access gives you a serious competitive advantage.
The biggest driver is almost always performance. Virtualization is flexible, sure, but it comes with a "hypervisor tax"—that sneaky software layer eating up CPU, memory, and I/O. By cutting it out, you can reclaim 5-15% of CPU capacity per node. For applications where every millisecond is money, that's a game-changer.
Key Drivers for a Bare Metal Strategy
Moving to bare metal Kubernetes isn't a casual decision. It's a calculated move, driven by real business and technical needs. It's less about a love for racking servers and more about unlocking capabilities that are otherwise out of reach.
- Maximum Performance and Low Latency: For fintech, real-time analytics, or massive AI/ML training jobs, the near-zero latency you get from direct hardware access is everything. Bypassing the hypervisor means your apps get raw, predictable power from CPUs, GPUs, and high-speed NICs.
- Predictable Cost at Scale: Cloud is great for getting started, but the pay-as-you-go model can spiral into unpredictable, massive bills for large, steady-state workloads. Investing in your own hardware often leads to a much lower total cost of ownership (TCO) over time. You cut out the provider margins and those notorious data egress fees.
- Full Stack Control and Customization: Bare metal puts you in the driver's seat. You can tune kernel parameters using
sysctl, optimize network configs with specific hardware (e.g., SR-IOV), and pick storage that perfectly matches your application's I/O profile. Good luck getting that level of control in a shared cloud environment. - Data Sovereignty and Compliance: For industries with tight regulations, keeping data in a specific physical location or on dedicated hardware isn't a suggestion—it's a requirement. A bare metal setup makes data residency and security compliance dead simple.
The move to bare metal isn't just a trend; it's a sign of Kubernetes' maturity. The platform is now so robust that it can be the foundational OS for an entire data center, not just another tool running on someone else's infrastructure.
The Evolving Kubernetes Landscape
A few years ago, Kubernetes and public cloud were practically synonymous. But things have changed. As Kubernetes became the undisputed king of container orchestration—now dominating about 92% of the market—the ways people deploy it have diversified.
We're seeing a clear, measurable shift toward on-prem and bare-metal setups as companies optimize for specific use cases. With more than 5.6 million developers now using Kubernetes worldwide, the expertise to manage self-hosted environments has exploded. This means running Kubernetes on bare metal is no longer a niche, expert-only game. It's a mainstream strategy for any team needing to push the limits of what's possible.
You can dig into the full report on these adoption trends in the CNCF Annual Survey 2023.
Designing Your Bare Metal Cluster Architecture
Getting the blueprint right for a production-grade Kubernetes cluster on bare metal is a serious undertaking. Unlike the cloud where infrastructure is just an API call away, every choice you make here—from CPU cores to network topology—sticks with you. This is where you lay the foundation for performance, availability, and your own operational sanity down the road.
It all starts with hardware. This isn't just about buying the beefiest servers you can find; it's about matching the components to what your workloads actually need. If you're running compute-heavy applications, you’ll want to focus on higher CPU core counts and faster RAM speeds. But for storage-intensive workloads like databases or log aggregation, the choice between NVMe and SSDs becomes critical. NVMe drives can offer a massive reduction in I/O latency, which can be a game-changer.
This initial decision-making process is really about figuring out if bare metal is even the right path for you in the first place. This decision tree helps visualize the key questions around performance needs and cost control that should guide your choice.
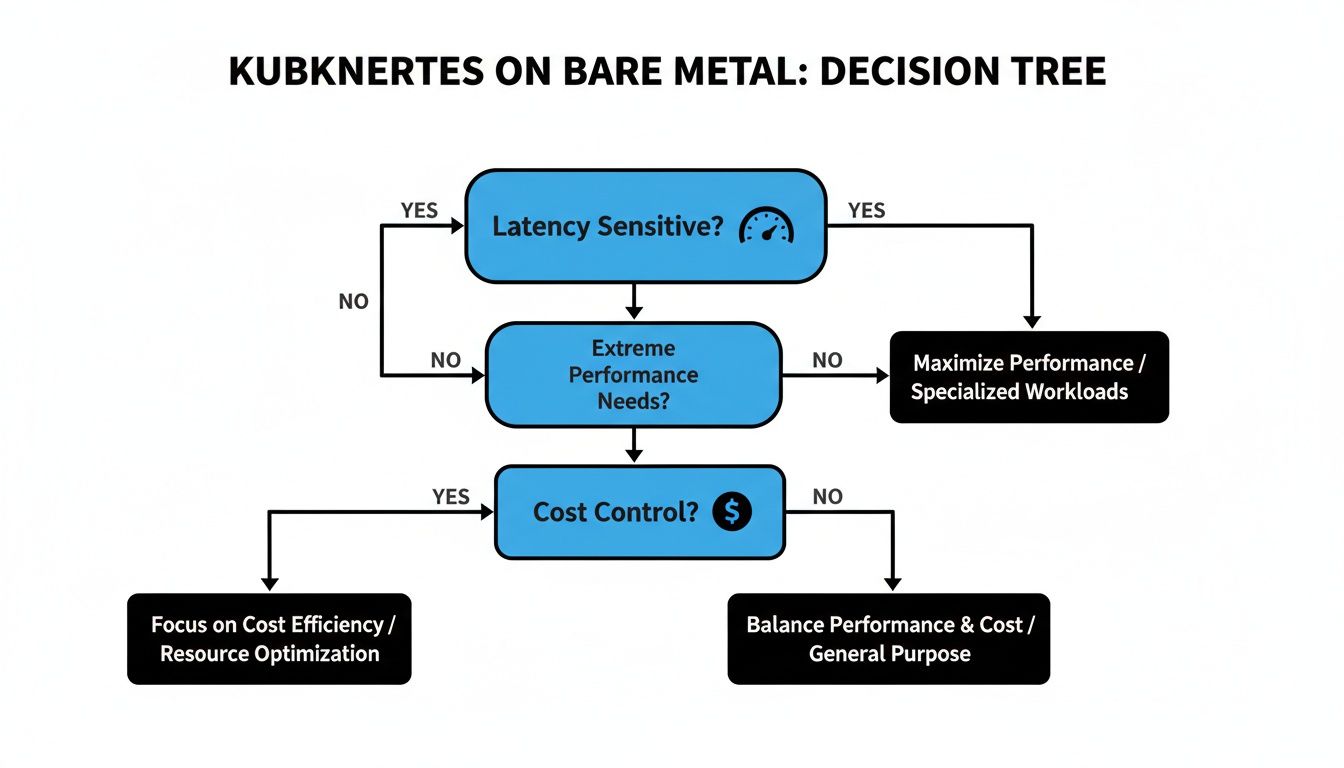
As the diagram shows, when performance is absolutely non-negotiable or when long-term cost predictability is a core business driver, the road almost always leads to bare metal.
Architecting The Control Plane
The control plane is the brain of your cluster, and its design directly impacts your overall resilience. The biggest decision here revolves around etcd, the key-value store that holds all your cluster's state. You've got two main models to choose from.
- Stacked Control Plane: This is the simpler approach. The
etcdmembers are co-located on the same nodes as the other control plane components (API server, scheduler, etc.). It’s easier to set up and requires fewer physical servers. - External
etcdCluster: Here,etcdruns on its own dedicated set of nodes, completely separate from the control plane. This gives you much better fault isolation—an issue with the API server won't directly threaten youretcdquorum—and lets you scale the control plane andetcdindependently.
For any real production environment, an external
etcdcluster with three or five dedicated nodes is the gold standard. It does demand more hardware, but the improved resilience against cascading failures is a trade-off worth making for any business-critical application.
Making Critical Networking Decisions
Networking is, without a doubt, the most complex piece of the puzzle in a bare metal Kubernetes setup. The choices you make here will define how services talk to each other, how traffic gets into the cluster, and how you keep everything highly available.
A fundamental choice is between a Layer 2 (L2) and Layer 3 (L3) network design. An L2 design is simpler, often using ARP to announce service IPs on a flat network. The problem is, it doesn't scale well and can become a nightmare of broadcast storms in larger environments.
For any serious production cluster, an L3 design using Border Gateway Protocol (BGP) is the way to go. By having your nodes peer directly with your physical routers, you can announce service IPs cleanly, enabling true load balancing and fault tolerance without the bottlenecks of L2. On top of that, implementing bonded network interfaces (LACP) on each server should be considered non-negotiable. It provides crucial redundancy, ensuring a single link failure doesn’t take a node offline.
The telecom industry offers a powerful real-world example of these architectural choices in action. The global Bare Metal Kubernetes for RAN market was pegged at USD 1.43 billion in 2024, largely fueled by 5G rollouts that demand insane performance. These latency-sensitive workloads run on bare metal for a reason—it allows for this exact level of deep network and hardware optimization, proving the model is mature enough for even carrier-grade demands.
Provisioning and Automation Strategies
Manually configuring dozens of servers is a recipe for inconsistency and human error. Repeatability is the name of the game, which means automated provisioning isn't just nice to have; it's essential. Leveraging Infrastructure as Code (IaC) examples is the best way to ensure every server is configured identically and that your entire setup is documented and version-controlled.
Your provisioning strategy can vary in complexity:
- Configuration Management Tools: This is a common starting point. Tools like Ansible can automate OS installation, package management, and kernel tuning across your entire fleet of servers.
- Fully Automated Bare Metal Provisioning: For larger or more dynamic setups, tools like Tinkerbell or MAAS (Metal as a Service) deliver a truly cloud-like experience. They can manage the entire server lifecycle—from PXE booting and OS installation to firmware updates—all driven by declarative configuration files.
With your architectural blueprint ready, it's time to get into the nitty-gritty: picking the software that will actually run your cluster. This is where the rubber meets the road. These choices will make or break your cluster's performance, security, and how much of a headache it is to manage day-to-day.
When you're running on bare metal, you're the one in the driver's seat for the entire stack. Unlike in the cloud where a lot of this is handled for you, every single component is your decision—and your responsibility. It's all about making smart trade-offs between features, performance, and the operational load you're willing to take on.
Choosing Your Container Network Interface
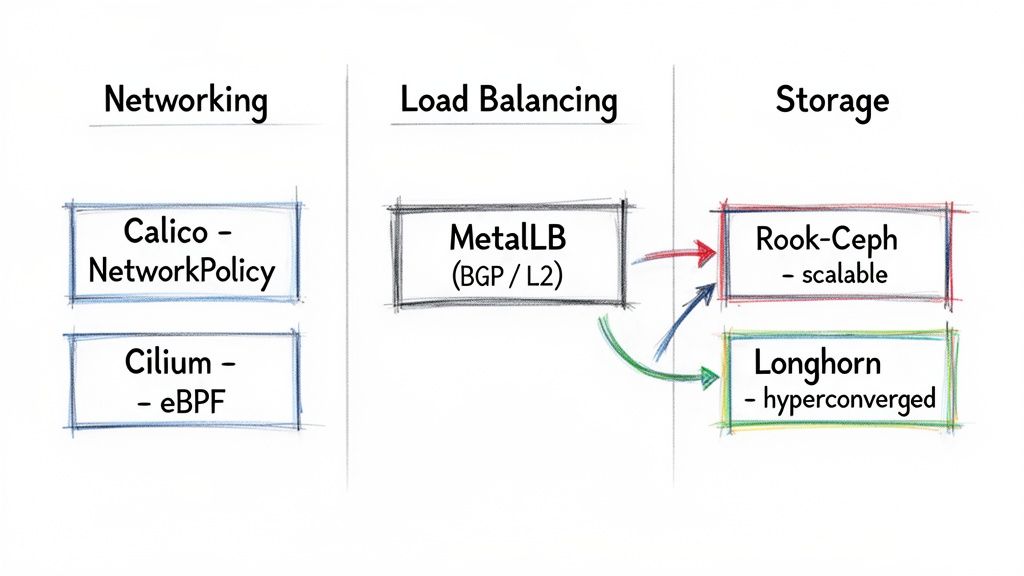
The CNI plugin is the nervous system of your cluster; it’s what lets all your pods talk to each other. In the bare-metal world, the conversation usually comes down to two big players: Calico and Cilium.
- Calico: This is the old guard, in a good way. Calico is legendary for its rock-solid implementation of Kubernetes NetworkPolicies, making it a go-to for anyone serious about security. It uses BGP to create a clean, non-overlay network that routes pod traffic directly and efficiently. If you need fine-grained network rules and want something that's been battle-tested for years, Calico is a safe and powerful bet.
- Cilium: The newer kid on the block, Cilium is all about performance. It uses eBPF to handle networking logic deep inside the Linux kernel, which means less overhead and blistering speed. But it's more than just fast; Cilium gives you incredible visibility into network traffic and even service mesh capabilities without the complexity of a sidecar. It's the future, but it does demand more modern Linux kernels.
So, what's the verdict? If your top priority is locking down traffic with IP-based rules and you value stability above all, stick with Calico. But if you're chasing maximum performance and need advanced observability for your workloads, it’s time to dive into Cilium and eBPF.
Exposing Services with Load Balancers
You can’t just spin up a LoadBalancer service and expect it to work like it does in AWS or GCP. You need to bring your own. For most people, that means MetalLB. It's the de facto standard for a reason, and it gives you two ways to get the job done.
- Layer 2 Mode: This is the easy way in. A single node grabs the service's external IP and uses ARP to announce it on the network. Simple, right? The catch is that all traffic for that service gets funneled through that one node, which is a major bottleneck and a single point of failure. It's fine for a lab, but not for production.
- BGP Mode: This is the right way for any serious workload. MetalLB speaks BGP directly with your physical routers, announcing service IPs from multiple nodes at once. This gives you actual load balancing and fault tolerance. If a node goes down, the network automatically reroutes traffic to a healthy one.
You could also set up an external load balancing tier with something like HAProxy and Keepalived. This gives you a ton of control, but it also means managing another piece of infrastructure completely separate from Kubernetes. It takes some serious networking chops.
For the vast majority of bare-metal setups, MetalLB in BGP mode hits the sweet spot. You get a cloud-native feel for exposing services, but with the high availability and performance you need for real traffic.
Selecting a Production-Grade Storage Solution
Let's be honest: storage is the hardest part of running Kubernetes on bare metal. You need something that’s reliable, fast, and can dynamically provision volumes on demand. It’s a tall order.
| Storage Solution | Primary Use Case | Performance Profile | Operational Complexity |
|---|---|---|---|
| Rook-Ceph | Scalable block, file, and object storage | High throughput, tunable for different workloads | High |
| Longhorn | Simple, hyperconverged block storage for VMs/containers | Good for general use, latency sensitive to network | Low to Moderate |
Rook-Ceph is an absolute monster. It wrangles the beast that is Ceph to provide block, file, and object storage all from one distributed system. It’s incredibly powerful and flexible. The trade-off? Ceph is notoriously complex to run. You need to really know what you're doing to manage it effectively when things go wrong.
Then there’s Longhorn. It takes a much simpler, hyperconverged approach by pooling the local disks on your worker nodes into a distributed block storage provider. The UI is clean, and it's far easier to get up and running. The downside is that it only does block storage, and its performance is directly tied to the speed of your network.
Ultimately, your choice here is about features versus operational burden. Need a do-it-all storage platform and have the team to back it up? Rook-Ceph is the king. If you just need dependable block storage and want something that won't keep you up at night, Longhorn is an excellent pick.
The tools you choose for storage and networking will heavily influence how you manage the cluster as a whole. To get a better handle on the big picture, it’s worth exploring the different Kubernetes cluster management tools that can help you tie all these pieces together.
Hardening Your Bare Metal Kubernetes Deployment
When you run Kubernetes on bare metal, you are the security team. It’s that simple. There are no cloud provider guardrails to catch a misconfiguration or patch a vulnerable kernel for you. Proactive, multi-layered hardening isn't just a "best practice"—it's an absolute requirement for any production-grade cluster. Security becomes an exercise in deliberate engineering, from the physical machine all the way up to the application layer.
This level of responsibility is a serious trade-off. Running Kubernetes on-prem can amplify security risks that many organizations already face. In fact, Red Hat's 2023 State of Kubernetes Security report found that a staggering 67% of organizations had to pump the brakes on cloud-native adoption because of security concerns. Over half had a software supply-chain issue in the last year alone.
These problems can be even more pronounced in bare-metal environments where your team has direct control—and therefore total responsibility—over the OS, networking, and storage.
Securing The Host Operating System
Your security posture is only as strong as its foundation. In this case, that's the host OS on every single node. Each machine is a potential front door for an attacker, so hardening it is your first and most critical line of defense.
The whole process starts with minimalism.
Your server OS should be as lean as humanly possible. Kick things off with a minimal installation of your Linux distro of choice (like Ubuntu Server or RHEL) and immediately get to work stripping out any packages, services, or open ports you don't strictly need. Every extra binary is a potential vulnerability just waiting to be exploited.
From there, it’s time to apply kernel hardening parameters. Don't try to reinvent the wheel here; lean on established frameworks like the Center for Internet Security (CIS) Benchmarks. They provide a clear, prescriptive roadmap for tuning sysctl values to disable unused network protocols, enable features like ASLR (Address Space Layout Randomization), and lock down access to kernel logs.
Finally, set up a host-level firewall using nftables or the classic iptables. Your rules need to be strict. I mean really strict. Adopt a default-deny policy and only allow traffic that is explicitly required for Kubernetes components (like the kubelet and CNI ports) and essential management access (like SSH).
Implementing Kubernetes-Native Security Controls
With the hosts locked down, you can move up the stack to Kubernetes itself. The platform gives you some incredibly powerful, built-in tools for enforcing security policies right inside the cluster.
Your first move should be implementing Pod Security Standards (PSS). These native admission controllers have replaced the old, deprecated PodSecurityPolicy. PSS lets you enforce security contexts at the namespace level, preventing containers from running as root or getting privileged access. The three standard policies—privileged, baseline, and restricted—give you a practical framework for classifying your workloads and applying the right security constraints.
Next, build a zero-trust network model using NetworkPolicies. Out of the box, every pod in a cluster can talk to every other pod. That's a huge attack surface. NetworkPolicies, which are enforced by your CNI plugin (like Calico or Cilium), act like firewall rules that restrict traffic between pods, namespaces, and even to specific IP blocks.
A key principle here is to start with a default-deny ingress policy for each namespace. Then, you explicitly punch holes for only the communication paths that are absolutely necessary. This is a game-changer for preventing lateral movement if an attacker manages to compromise a single pod.
For a much deeper dive into securing your cluster from the inside out, check out our comprehensive guide on Kubernetes security best practices, where we expand on all of these concepts.
Integrating Secrets and Image Scanning
Hardcoded secrets in a Git repo are a huge, flashing neon sign that says "hack me." Integrating a dedicated secrets management solution is non-negotiable for any serious deployment. Tools like HashiCorp Vault or Sealed Secrets provide secure storage and retrieval, allowing your applications to dynamically fetch credentials at runtime instead of stashing them in plain-text ConfigMaps or, even worse, in your code.
Finally, security has to be baked directly into your development lifecycle—this is the core of DevSecOps. Integrate container image scanning tools like Trivy or Clair right into your CI/CD pipeline. These tools will scan your container images for known vulnerabilities (CVEs) before they ever get pushed to a registry, letting you fail the build and force a fix. This "shifts security left," making it a proactive part of development instead of a reactive fire drill for your operations team.
Mastering Observability and Day Two Operations
Getting your bare metal Kubernetes cluster up and running is a major milestone, but it’s really just the starting line. Now the real work begins. When you ditch the cloud provider safety net, you're the one on the hook for the health, maintenance, and resilience of the entire platform. Welcome to "day two" operations, where a solid observability stack isn't a nice-to-have—it's your command center.
To keep a bare metal cluster humming, you need deep operational visibility. This goes way beyond application metrics; it means having a crystal-clear view into the performance of the physical hardware itself. Gaining that kind of insight requires a solid grasp of the essential principles of monitoring, logging, and observability to build a system that's truly ready for production traffic.
Building Your Production Observability Stack
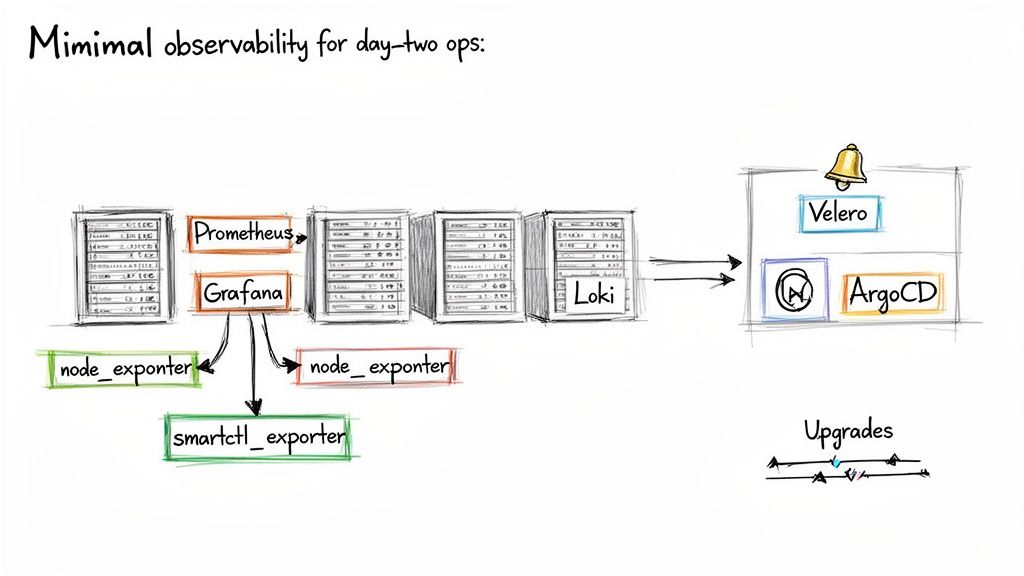
The undisputed champ for monitoring in the Kubernetes world is the trio of Prometheus, Grafana, and Loki. This combination gives you a complete picture of your cluster's health, from high-level application performance right down to the logs of a single, misbehaving pod.
- Prometheus for Metrics: Think of this as your time-series database. Prometheus pulls (or "scrapes") metrics from Kubernetes components, your own apps, and, most importantly for bare metal, your physical nodes.
- Grafana for Visualization: Grafana is where the raw data from Prometheus becomes useful. It turns cryptic numbers into actionable dashboards, letting you visualize everything from CPU usage and memory pressure to network throughput.
- Loki for Logs: Loki is brilliant in its simplicity. Instead of indexing the full text of your logs, it only indexes the metadata. This makes it incredibly resource-efficient and a breeze to scale.
In a bare metal setup, the real magic comes from monitoring the hardware itself. You absolutely must deploy Node Exporter on every single server. It collects vital machine-level metrics like CPU load, RAM usage, and disk I/O. Don't skip this.
Monitoring What Matters Most: The Hardware
Basic system metrics are great, but the real goal is to see hardware failures coming before they take you down. This is where specialized exporters become your best friends. For storage, smartctl-exporter is a must-have. It pulls S.M.A.R.T. (Self-Monitoring, Analysis, and Reporting Technology) data from your physical disks, giving you a heads-up on drive health and potential failures.
Imagine you see a spike in reallocated sectors on an SSD that's backing one of your Ceph OSDs. That's a huge red flag—the drive is on its way out. With that data flowing into Prometheus and an alert firing in Grafana, you can proactively drain the OSD and replace the faulty disk with zero downtime. That's a lot better than reacting to a catastrophic failure after it's already happened.
For a deeper dive into these systems, check out our guide on Kubernetes monitoring best practices.
Managing Cluster Upgrades and Backups
Lifecycle management is another massive part of day two. Upgrading a bare metal Kubernetes cluster requires a slow, steady hand. You’ll usually perform a rolling upgrade of the control plane nodes first, one by one, to ensure the API server stays online. After that, you can start draining and upgrading worker nodes in batches to avoid disrupting your workloads.
Just as critical is backing up your cluster's brain: etcd. If your etcd database gets corrupted, your entire cluster state is gone. A tool like Velero is invaluable here. While it’s often used for backing up application data, Velero can also snapshot and restore your cluster's resource configurations and persistent volumes. For etcd, you should have automated, regular snapshots stored on a durable system completely outside the cluster itself.
Automating Operations with GitOps
Trying to manage all of this manually is a recipe for burnout. The key is automation, and that’s where GitOps comes into play. By using a Git repository as the single source of truth for your cluster's desired state, you can automate everything from application deployments to configuring your monitoring stack.
Tools like ArgoCD or Flux constantly watch your Git repo and apply any changes to the cluster automatically. This declarative approach changes the game:
- Auditability: Every single change to your cluster is a Git commit. You get a perfect audit trail for free.
- Consistency: Configuration drift becomes a thing of the past. The live cluster state is forced to match what's in Git.
- Disaster Recovery: Need to rebuild a cluster from scratch? Just point the new cluster at your Git repository and let it sync.
By embracing GitOps, you turn complex, error-prone manual tasks into a clean, version-controlled workflow. It’s how you make a bare metal Kubernetes environment truly resilient and manageable for the long haul.
Frequently Asked Questions
When you start talking about running Kubernetes on your own hardware, a lot of questions pop up. Let's tackle the ones I hear most often from engineers who are heading down this path.
Is Bare Metal Really Cheaper Than Managed Services?
For big, steady workloads, the answer is a resounding yes. Once you factor in hardware costs spread out over a few years and cut out the cloud provider's profit margins and those killer data egress fees, the long-term cost can be dramatically lower.
But hold on, it’s not that simple. Your total cost of ownership (TCO) has to include the not-so-obvious stuff: data center space, power, cooling, and the big one—the engineering salary required to build and babysit this thing. For smaller teams or bursty workloads, the operational headache can easily wipe out any hardware savings, making something like EKS or GKE the smarter financial move.
What Are The Biggest Operational Hurdles?
If you ask anyone who's done this, they'll almost always point to three things: networking, storage, and lifecycle management. Unlike the cloud, there's no magic button to spin up a VPC or attach a block device. You're the one on the hook for all of it.
This means you’re actually configuring physical switches, setting up a load balancing solution like MetalLB from the ground up, and probably deploying a beast like Ceph for distributed storage. On top of that, you own every single OS and Kubernetes upgrade, a process that requires some serious planning if you want to avoid taking down production. Don't underestimate the deep infrastructure expertise these tasks demand.
How Do I Handle Load Balancing Without a Cloud Provider?
The go-to solution in the bare metal world is MetalLB. It's what lets you create a Service of type LoadBalancer, just like you would in a cloud environment. It has two modes, and picking the right one is critical.
- Layer 2 Mode: This mode uses ARP to make a service IP available on your local network. It's dead simple to set up, but it funnels all traffic through a single node. That node becomes a single point of failure, making this a non-starter for anything serious.
- BGP Mode: This is the production-grade choice. It peers with your network routers using BGP to announce service IPs from multiple nodes at once. You get genuine high availability and scalability that you just can't achieve with L2 mode.
What Happens When a Physical Node Fails?
Assuming you've designed your cluster for high availability, Kubernetes handles this beautifully. The scheduler sees the node is gone and immediately starts rescheduling its pods onto other healthy machines in the cluster.
The real question isn't about the pods; it's about the data. If you're running a replicated storage system like Rook-Ceph or Longhorn, the persistent volumes just get re-mounted on the new nodes and your stateful apps carry on. But if you don't have replicated storage, a node failure almost guarantees data loss.
Getting a bare metal Kubernetes deployment right is a specialized skill. OpsMoon connects you with the top 0.7% of global DevOps engineers who live and breathe this stuff. They can help you design, build, and manage a high-performance cluster that fits your exact needs.
Why not start with a free work planning session to map out your infrastructure roadmap today?
Leave a Reply