If you're building software for the cloud, mastering CI/CD with Kubernetes is non-negotiable. It's the definitive operational model for engineering teams serious about delivering software quickly, reliably, and at scale. This isn't just about automating kubectl apply—it's a fundamental shift in how we build, test, and deploy code from a developer's machine into a production cluster.
Why Bother With Kubernetes CI/CD?
Let's be technical: pairing a CI/CD pipeline with Kubernetes is a strategic move to combat configuration drift and achieve immutable infrastructure. Traditional CI/CD setups, often reliant on mutable VMs and imperative shell scripts, are a breeding ground for snowflake environments. Your staging environment inevitably diverges from production, leading to unpredictable, high-risk deployments.
This is where Kubernetes changes the game. It enforces a declarative, container-native paradigm. Instead of writing scripts that execute a sequence of commands (HOW), you define the desired state of your application in YAML manifests (WHAT). Kubernetes then acts as a relentless reconciliation loop, constantly working to make the cluster's actual state match your declared state. This self-healing, declarative nature crushes environment-specific bugs and makes deployments predictable and repeatable.
The industry has standardized on this model. A recent CNCF survey revealed that 60% of organizations are already using a continuous delivery platform for most of their cloud-native apps. This isn't just for show; it's delivering real results. The same report found that nearly a third of organizations (29%) now deploy code multiple times a day. You can dig into more of the data on the cloud-native adoption trend here.
Key Pillars of a Kubernetes CI/CD Pipeline
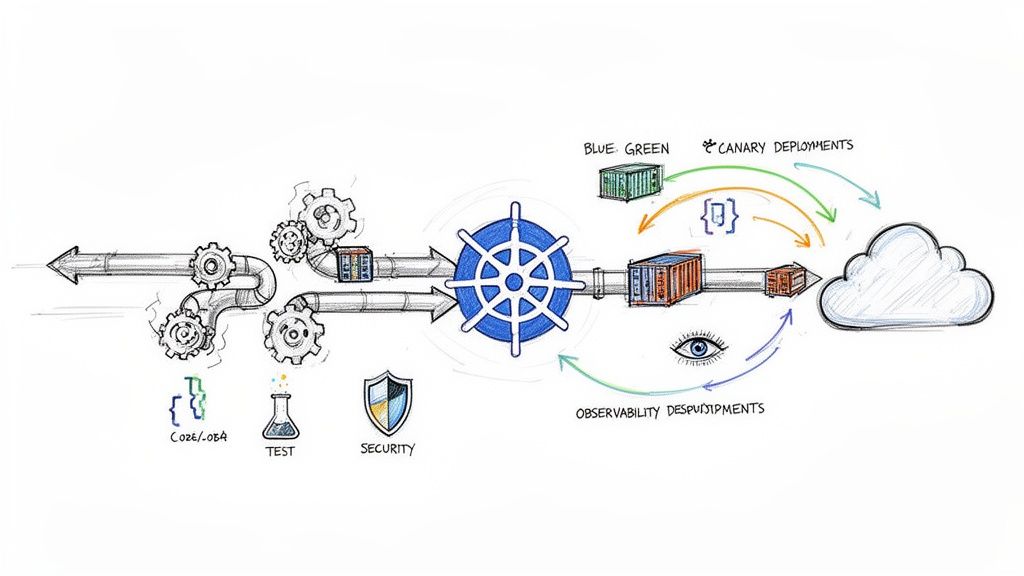
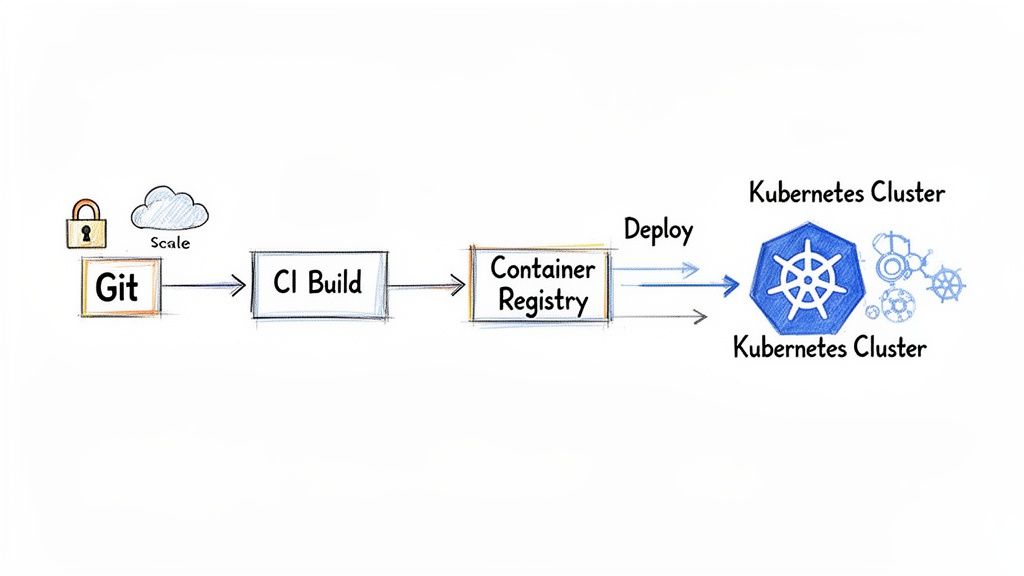
To build a robust pipeline, you must understand its core components. These pillars work in concert to automate the entire software delivery lifecycle, providing a clear blueprint for a mature, production-grade setup.
| Component | Core Function | Key Benefit |
|---|---|---|
| Source Control (Git) | Acts as the single source of truth for all application code and Kubernetes manifests. | Enables auditability, collaboration, and automated triggers for the pipeline via webhooks. |
| Continuous Integration | On git push, automatically builds, tests, and packages the application into a container image. |
Catches integration bugs early, ensures code quality, and produces a versioned, immutable artifact. |
| Container Registry | A secure and centralized storage location for all versioned container images (e.g., Docker Hub, ECR). | Provides reliable, low-latency access to immutable artifacts for all environments. |
| Continuous Deployment | Deploys the container image to the Kubernetes cluster and manages the application's lifecycle. | Automates releases, reduces human error, and enables advanced deployment strategies. |
| Observability | Gathers metrics, logs, and traces from the running application and the pipeline itself. | Offers deep insight into application health and performance for rapid troubleshooting. |
By architecting a system around these pillars, we're doing more than just shipping code faster. We're creating a resilient, self-documenting system where every change is versioned, tested, and deployed with high confidence. It transforms software delivery from a high-anxiety event into a routine, predictable process.
Choosing Your Architecture: GitOps vs. Traditional CI/CD
When architecting CI/CD with Kubernetes, your first and most critical decision is the deployment model. This choice dictates your entire workflow, security posture, and scalability. You're choosing between two distinct paradigms: traditional push-based CI/CD and modern, pull-based GitOps.
In a traditional setup, tools like Jenkins or GitLab CI orchestrate the entire process. A developer merges code, triggering a CI server. This server builds a container image, pushes it to a registry, and then executes commands like kubectl apply -f deployment.yaml or helm upgrade to push the new version directly into your Kubernetes cluster.
While familiar, this push-based model has significant security and stability drawbacks. The CI server requires powerful, long-lived kubeconfig credentials with broad permissions (e.g., cluster-admin) to interact with your cluster. This turns your CI system into a high-value target; a compromise there could expose your entire production environment.
Worse, this approach actively encourages configuration drift. A developer might execute a kubectl patch command for a hotfix. An automated script might fail halfway through an update. Suddenly, the live state of your cluster no longer matches the configuration defined in your Git repository. This divergence between intended state and actual state is a primary cause of failed deployments and production incidents.
The Declarative Power of GitOps
GitOps inverts the model. Instead of a CI server pushing changes to the cluster, an operator running inside the cluster continuously pulls the desired state from a Git repository. This is the pull-based, declarative model championed by tools like Argo CD and Flux.
With GitOps, Git becomes the single source of truth for your entire system's desired state. Your application manifests, infrastructure configurations—everything—is defined declaratively in YAML files stored in a Git repo. Any change, from updating a container image tag to scaling a deployment, is executed via a Git commit and pull request.
This is a profound architectural shift. By making Git the convergence point, every change becomes auditable, version-controlled, and subject to peer review. You gain a perfect, chronological history of your cluster's intended state.
The security benefits are immense. The GitOps operator inside the cluster only needs read-only credentials to your Git repository and container registry. The highly-sensitive cluster API credentials never leave the cluster boundary, eliminating a massive attack vector.
For a deeper dive into locking down this workflow, check out our guide on GitOps best practices. It covers repository structure, secret management, and access control.
Practical Scenarios and Making Your Choice
Which path is right for you? It depends on your team's context.
For a fast-moving startup, a pure GitOps model with Argo CD is an excellent choice. It provides a secure, low-maintenance deployment system out of the box, enabling a small team to manage complex applications with confidence.
For a large enterprise with a mature Jenkins installation, a rip-and-replace approach is often unfeasible. Here, a hybrid model is superior. Let the existing Jenkins pipeline handle the CI part: building code, running tests/scans, and publishing the container image.
In the final step, instead of running kubectl, the Jenkins job simply uses git commands or a tool like kustomize edit set image to update a Kubernetes manifest in a separate Git repository and commits the change. From there, a GitOps operator like Argo CD detects the commit and pulls the change into the cluster. You retain your CI investment while gaining the security and reliability of GitOps for deployment.
The Argo CD UI provides real-time visibility into your application's health and sync status against the Git repository.
This dashboard instantly reveals which applications are synchronized with Git and which have drifted, offering a clear operational overview.
To make it even clearer, here's a side-by-side comparison:
| Aspect | Traditional Push-Based CI/CD | GitOps Pull-Based CD |
|---|---|---|
| Workflow | Imperative: CI server executes kubectl or helm commands. |
Declarative: In-cluster operator reconciles state based on Git commits. |
| Source of Truth | Scattered across CI scripts, config files, and the live cluster state. | Centralized: The Git repository is the single, undisputed source of truth. |
| Security Posture | Weak: CI server requires powerful, long-lived cluster credentials. | Strong: Cluster credentials remain within the cluster boundary. The operator has limited, pull-based permissions. |
| Configuration Drift | High risk: Manual changes (kubectl patch) and partial failures are common. |
Eliminated: The operator constantly reconciles the cluster state back to what is defined in Git. |
| Auditability | Difficult: Changes are logged in CI job outputs, not versioned artifacts. | Excellent: Every change is a versioned, auditable Git commit with author and context. |
| Scalability | Can become a bottleneck as the CI server's responsibilities grow. | Highly scalable as operators work independently within each cluster. |
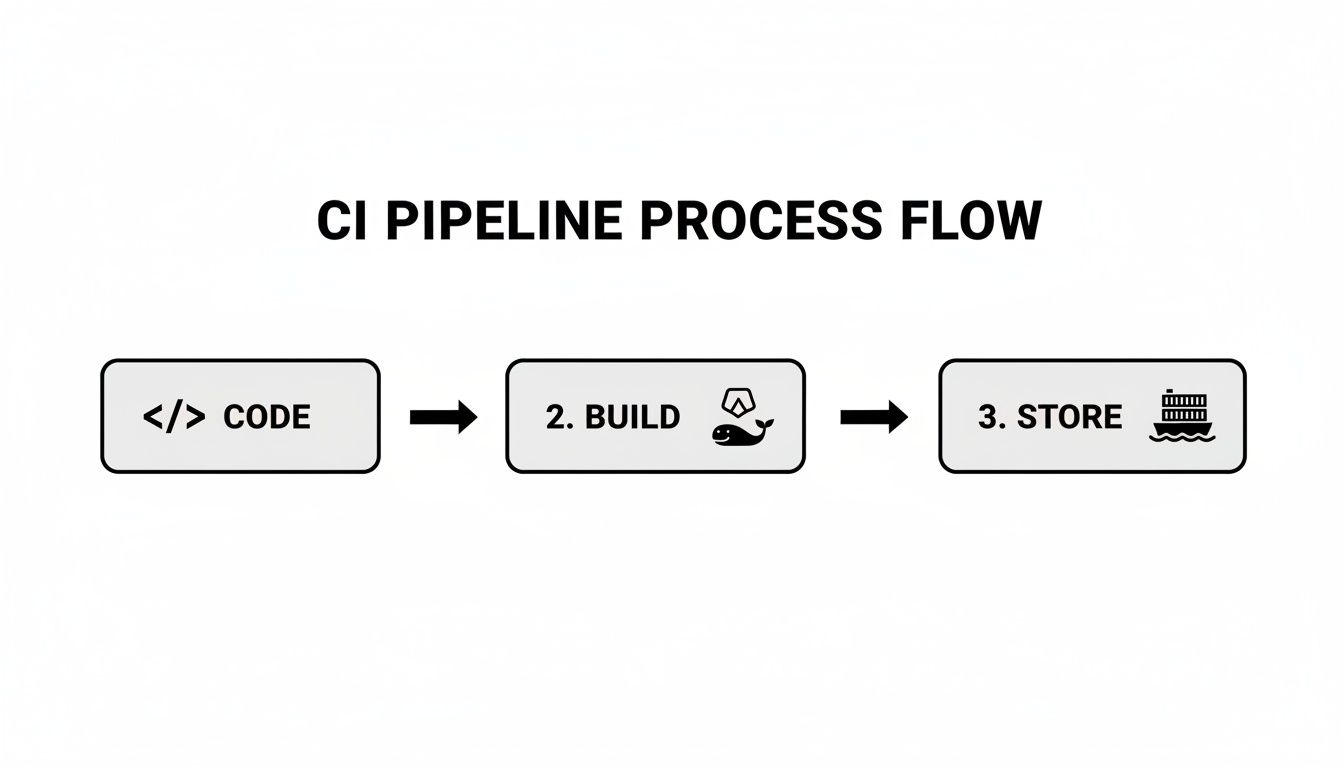
Implementing the Continuous Integration Stage
Now that you’ve settled on an architecture, it's time to build the CI pipeline. This is where your source code is transformed into a secure, deployable artifact. This stage is non-negotiable for a professional CI/CD with Kubernetes setup.
The process begins with containerizing your application. A well-written Dockerfile is the blueprint for creating container images that are lightweight, secure, and efficient. The most critical technique here is the use of multi-stage builds. This pattern allows you to use a build-time environment with all necessary SDKs and dependencies, then copy only the compiled artifacts into a minimal final image, drastically reducing its size and attack surface.
Crafting an Optimized Dockerfile
Consider a standard Node.js application. A common mistake is to copy the entire project directory and run npm install, which bloats the final image with devDependencies and source code. A multi-stage build is far superior.
Here is an actionable example:
# ---- Base Stage ----
# Use a specific version to ensure reproducible builds
FROM node:18-alpine AS base
WORKDIR /app
COPY package*.json ./

# ---- Dependencies Stage ----
# Install only production dependencies in a separate layer for caching
FROM base AS dependencies
RUN npm ci --only=production

# ---- Build Stage ----
# Install all dependencies (including dev) to build the application
FROM base AS build
RUN npm ci
COPY . .
# Example build command for a TypeScript or React project
RUN npm run build

# ---- Release Stage ----
# Start from a fresh, minimal base image
FROM node:18-alpine
WORKDIR /app
# Copy only the necessary production dependencies and compiled code
COPY --from=dependencies /app/node_modules ./node_modules
COPY --from=build /app/dist ./dist
COPY package.json .

# Expose the application port and define the runtime command
EXPOSE 3000
CMD ["node", "dist/index.js"]
The final image contains only the compiled code and production dependencies—nothing superfluous. This is a fundamental step toward creating lean, fast, and secure container artifacts.
Pushing to a Container Registry with Smart Tagging
Once the image is built, it requires a versioned home. A container registry like Docker Hub, Google Container Registry, or Amazon ECR stores your images. While the docker push command is simple, your image tagging strategy is what ensures traceability and prevents chaos.
Two tagging strategies are essential for production workflows:
- Git SHA: Tagging an image with the short Git commit SHA (e.g.,
myapp:a1b2c3d) creates an immutable, one-to-one link between your container artifact and the exact source code that produced it. This is invaluable for debugging and rollbacks. - Semantic Versioning: For official releases, using tags like
myapp:1.2.5aligns your image versions with your application’s release lifecycle, making it human-readable and compatible with deployment tooling.
Pro Tip: Don't choose one—use both. In your CI script, tag and push the image with both the Git SHA for internal traceability and the semantic version if it's a tagged release build. This provides maximum visibility for both developers and automation.
Managing Kubernetes Manifests: Helm vs. Kustomize
With a tagged image in your registry, you now need to instruct Kubernetes how to run it using manifest files. Managing raw YAML across multiple environments (dev, staging, prod) by hand is error-prone and unscalable.
Two tools have emerged as industry standards for this task: Helm and Kustomize.
Helm is a package manager for Kubernetes. It bundles application manifests into a distributable package called a "chart." Helm's power lies in its Go-based templating engine, which allows you to parameterize your configurations. This is ideal for complex applications that need to be deployed with environment-specific values.
Kustomize, on the other hand, is a template-free tool built directly into kubectl. It operates by taking a "base" set of YAML manifests and applying environment-specific "patches" or overlays. This declarative approach avoids templating complexity and is often favored for its simplicity and explicit nature.
Mastering one of these tools is critical. Kubernetes now commands 92% of the container orchestration market share, and with 80% of IT professionals at companies running Kubernetes in production, effective deployment management is a core competency. You can dig into more stats about the overwhelming adoption of Kubernetes here.
For more context on the tooling ecosystem, explore our list of the best CI/CD tools available today.
To help you decide, here's a direct comparison.
Helm vs. Kustomize: A Practical Comparison
This table breaks down the key differences to help you choose the right manifest management tool for your project.
| Feature | Helm | Kustomize |
|---|---|---|
| Core Philosophy | A package manager with a powerful templating engine for reusable charts. | A declarative, template-free overlay engine for customizing manifests. |
| Complexity | Higher learning curve due to Go templating, functions, and chart structure. | Simpler to learn; uses standard YAML syntax and JSON-like patches. |
| Use Case | Ideal for distributing complex, configurable off-the-shelf software. | Excellent for managing application configurations across internal environments (dev, staging, prod). |
| Workflow | helm install release-name chart-name --values values.yaml |
kubectl apply -k ./overlays/production |
| Extensibility | Highly extensible with chart dependencies (Chart.yaml) and lifecycle hooks. |
Focused and less extensible, prioritizing declarative simplicity over programmatic control. |
Ultimately, both tools solve configuration drift. The choice depends on whether you need the powerful, reusable packaging of Helm or prefer the straightforward, declarative patching of Kustomize.
Mastering Advanced Kubernetes Deployment Strategies
Simply executing kubectl apply is not a deployment strategy; it's a gamble with your uptime. To ship code to production with confidence, you must implement battle-tested patterns that ensure service reliability and minimize user impact. This is a core discipline of professional CI CD with Kubernetes.
These strategies distinguish high-performing teams from those constantly fighting production fires. They provide a controlled, predictable methodology for introducing new code, allowing you to manage risk, monitor performance, and execute clean rollbacks.
First, ensure your CI pipeline is solid, transforming code from a commit into a deployable artifact.
With a versioned artifact ready, you can proceed with a controlled deployment.
Understanding Rolling Updates
By default, a Kubernetes Deployment uses a Rolling Update strategy. When you update the container image, it gradually replaces old pods with new ones, one by one, ensuring zero-downtime. It terminates an old pod, waits for the new pod to pass its readiness probe, and then proceeds to the next.
While better than a full stop-and-start deployment, this strategy has drawbacks. During the rollout, you have a mix of old and new code versions serving traffic simultaneously, which can cause compatibility issues. A full rollback is also slow, as it is simply another rolling update in reverse.
Implementing Blue-Green Deployments
A Blue-Green deployment provides a much cleaner, atomic release. The concept is to maintain two identical production environments: "Blue" (the current live version) and "Green" (the new version).
The execution flow is as follows:
- Deploy Green: You deploy the new version of your application (Green) alongside the live one (Blue). The Kubernetes Service continues to route all user traffic to the Blue environment.
- Verify and Test: With the Green environment fully deployed but isolated from live traffic, you can run a comprehensive suite of automated tests against it (integration tests, smoke tests, performance tests). This is your final quality gate.
- Switch Traffic: Once confident, you update the Kubernetes Service's selector to point to the Green deployment's pods (
app: myapp, version: v2). This traffic switch is nearly instantaneous.
If a post-release issue is detected, a rollback is equally fast: simply update the Service selector back to the stable Blue deployment (app: myapp, version: v1). This eliminates the mixed-version problem entirely.
The primary advantage of Blue-Green is the speed and safety of its rollout and rollback. The main trade-off is resource cost, as you are effectively running double the infrastructure during the deployment window.
Gradual Rollouts with Canary Deployments
For mission-critical applications where minimizing the blast radius of a faulty release is paramount, Canary deployments are the gold standard. Instead of an all-or-nothing traffic switch, a Canary deployment incrementally shifts a small percentage of live traffic to the new version.
This acts as an early warning system. You can expose the new code to just 1% or 5% of users while closely monitoring key Service Level Indicators (SLIs) like error rates, latency, and CPU utilization.
Progressive delivery tools like Istio, Linkerd, or Flagger are essential for automating this process. They integrate with monitoring tools like Prometheus to manage traffic shifting based on real-time performance metrics.
A typical automated Canary workflow:
- Initial Rollout: Deploy the "canary" version and use a service mesh to route 5% of traffic to it.
- Automated Analysis: Flagger queries Prometheus for a set period (e.g., 15 minutes), comparing the canary's error rate and latency against the primary version.
- Incremental Increase: If SLIs are met, traffic is automatically increased to 25%, then 50%, and finally 100%.
- Automated Rollback: If at any stage the error rate exceeds a predefined threshold, the system automatically aborts the rollout and routes all traffic back to the stable version.
This strategy provides the highest level of safety by limiting the impact of any failure to a small subset of users, making it ideal for high-traffic, critical applications.
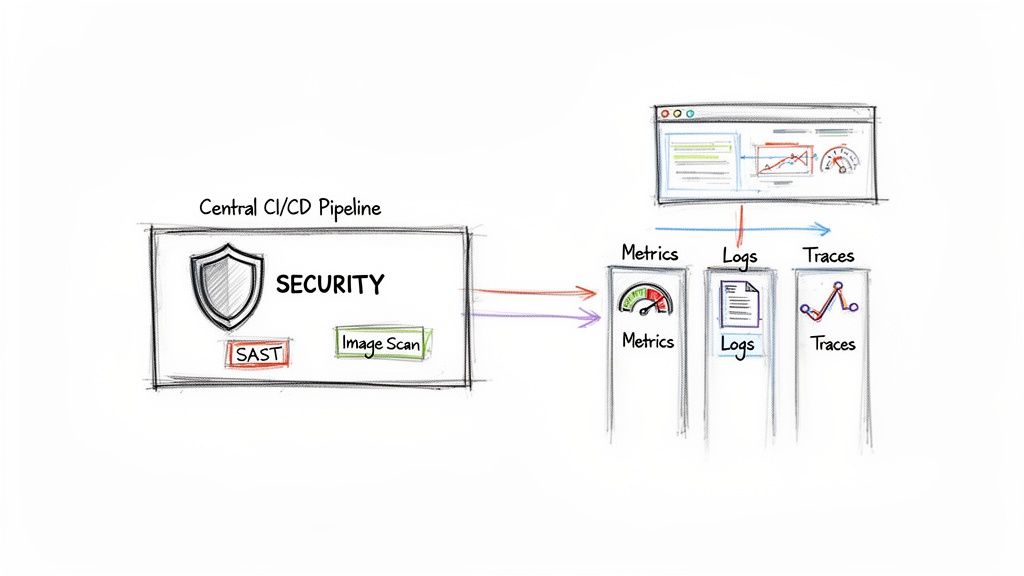
Securing Your Pipeline and Enabling Observability
A high-velocity pipeline that deploys vulnerable or buggy code isn't an asset; it's a high-speed liability. A mature CI CD with Kubernetes pipeline must integrate security and observability as first-class citizens, not afterthoughts. This transforms your automation from a simple code-pusher into a trusted, transparent delivery system.
This practice is known as "shifting left"—integrating security checks as early as possible in the development lifecycle. Instead of discovering vulnerabilities in production, you automate their detection within the CI pipeline itself, making them cheaper and faster to remediate.
Shifting Left with Automated Security Checks
The objective is to make security a non-negotiable, automated gate in every code change. This ensures vulnerabilities are caught and fixed before they are ever published to your container registry.
Here are three critical security gates to implement in your CI stage:
- Static Application Security Testing (SAST): Before building, tools like SonarQube or CodeQL scan your source code for security flaws like SQL injection, insecure dependencies, or improper error handling.
- Container Image Vulnerability Scanning: After the
docker buildcommand, tools like Trivy or Clair must scan the resulting image. They inspect every layer for known vulnerabilities (CVEs) in OS packages and application libraries. AHIGHorCRITICALseverity finding should fail the pipeline build immediately. - Infrastructure as Code (IaC) Policy Enforcement: Before deployment, scan your Kubernetes manifests. Using tools like Open Policy Agent (OPA) or Kyverno, you can enforce policies to prevent misconfigurations, such as running containers as the root user, not defining resource limits, or exposing a LoadBalancer service unintentionally.
Automating these checks establishes a secure-by-default system. For a deeper technical guide, see our article on implementing DevSecOps in your CI/CD pipeline.
The Three Pillars of Observability
A secure pipeline is insufficient without visibility. If you cannot observe the behavior of your application and pipeline, you are operating blindly. True observability rests on three distinct but interconnected data pillars.
Observability is not merely collecting data; it's the ability to ask arbitrary questions about your system's state without having to ship new code to answer them. It’s the difference between a "deployment successful" log and knowing if that deployment degraded latency for 5% of your users.
These pillars provide the raw data required to understand system behavior, detect anomalies, and perform root cause analysis.
Instrumenting Your Pipeline for Full Visibility
Correlating these three data types provides a complete view of your system's health.
- Metrics with Prometheus: Metrics are numerical time-series data—CPU utilization, request latency, error counts. Prometheus is the de facto standard in the Kubernetes ecosystem for scraping, storing, and querying this data. It is essential for defining alerts on Service Level Objectives (SLOs).
- Logs with Fluentd or Loki: Logs are discrete, timestamped events that provide context for what happened. Fluentd is a powerful log aggregator, while Loki offers a cost-effective approach by indexing log metadata rather than full-text content, making it highly efficient when paired with Grafana.
- Traces with Jaeger: Traces are essential for microservices architectures. They track the end-to-end journey of a single request as it propagates through multiple services. A tool like Jaeger helps visualize these distributed traces, making it possible to pinpoint latency bottlenecks that logs and metrics alone cannot reveal.
When you instrument your applications and pipeline to emit this data, you create a powerful feedback loop. During a canary deployment, your automation can query Prometheus for the canary's error rate. If it exceeds a defined threshold, the pipeline can trigger an automatic rollback, preventing a widespread user impact.
Knowing When You Need a Hand
It's one thing to understand the theory behind a slick Kubernetes CI/CD setup. It's a whole other ball game to actually build and run one when the pressure is on and production is calling. Teams hit wall after wall, and what should be a strategic advantage quickly becomes a major source of frustration.
There are some clear signs you might need to bring in an expert. Are your releases slowing down instead of speeding up? Seeing a spike in security issues after code goes live? Is your multi-cloud setup starting to feel like an untamable beast? These aren't just growing pains; they're indicators that your team's current approach isn't scaling.
When these problems pop up, it’s time for an honest look at your DevOps maturity. You have to decide if you have the skills in-house to push through these hurdles, or if an outside perspective could get you to the finish line faster.
The Telltale Signs You Need External Expertise
Keep an eye out for these patterns. If they sound familiar, it might be time to call for backup:
- Pipelines are always on fire. Your CI/CD process breaks down so often that your engineers are spending more time troubleshooting than shipping code.
- Your setup can't scale. What worked for a handful of microservices is now crumbling as you try to bring more teams and applications into the fold.
- Security is an afterthought. You either lack automated security scanning entirely, or your current tools are letting critical vulnerabilities slip right through to production.
And things are only getting more complicated. As AI workloads move to Kubernetes—and 90% of organizations expect them to grow—the need for sophisticated automation becomes critical. You can read more about that trend in the 2025 State of Production Kubernetes report.
This is where the rubber meets the road. Simply knowing you have a gap is the first real step toward building a software delivery lifecycle that's actually resilient, automated, and secure.
At OpsMoon, this is exactly what we do—we help close that gap. Our free work planning session is designed to diagnose these exact issues. From there, our Experts Matcher technology can connect you with the right top-tier engineering talent for your specific needs. Whether it's accelerating your CI/CD adoption from scratch or optimizing the pipelines you already have, our flexible engagement models are built to help you overcome the challenges we've talked about in this guide.
Got Questions? We've Got Answers
Let's tackle some of the practical, real-world questions that always pop up when teams start building out their CI/CD pipelines for Kubernetes. These are the sticking points we see time and time again.
How Should I Handle Database Migrations?
Database schema migrations are a classic CI/CD challenge. The most robust pattern is to execute migrations as part of your deployment process using either Kubernetes Jobs or Helm hooks.
Specifically, a pre-install or pre-upgrade Helm hook is ideal for this. The hook can trigger a Kubernetes Job that runs a container with your migration tool (e.g., Flyway, Alembic) to apply schema changes before the new application pods are deployed. This ensures the database schema is compatible with the new code before it starts serving traffic, preventing startup failures.
Pro Tip: Your application code must always be backward-compatible with the previous database schema version. This is non-negotiable for achieving zero-downtime deployments, as old pods will continue running against the new schema until the rolling update is complete.
What's the Best Way to Manage Secrets?
Committing secrets (API keys, database credentials) directly to Git is a severe security vulnerability. Instead, you must use a dedicated secrets management solution. Two patterns are highly effective:
- Kubernetes Secrets with Encryption: This is the native approach. Create Kubernetes Secrets and inject them into pods as environment variables or mounted files. For production, you must enable encryption at rest for Secrets in etcd, typically by integrating your cluster's Key Management Service (KMS) provider.
- External Secret Stores: For superior, centralized management, use a tool like HashiCorp Vault or AWS Secrets Manager. An in-cluster operator, such as the External Secrets Operator, can then securely fetch secrets from the external store and automatically sync them into the cluster as native Kubernetes Secrets, ready for your application to consume.
Which CI Tool Is Right For My Team Size?
The "best" tool depends on your team's scale, skills, and existing ecosystem. There is no single correct answer, but here is a practical framework for choosing.
For startups and small teams, a GitOps-centric tool like ArgoCD or Flux is often the optimal choice. They are secure by design, have a low operational overhead, and enforce best practices from day one.
For larger organizations with significant investments in tools like Jenkins or GitLab CI, a hybrid model is more effective than a full migration. Continue using your existing CI tool for building, testing, and scanning. The final step of the pipeline should not run kubectl apply, but instead commit the updated Kubernetes manifests (e.g., with a new image tag) to a Git repository. A GitOps operator then takes over for the actual deployment. This approach leverages your existing infrastructure while adopting the security and reliability of a pull-based GitOps model.
Ready to bridge the gap between knowing the theory and executing a flawless pipeline? OpsMoon connects you with top-tier engineering talent to accelerate your CI/CD adoption, optimize existing workflows, and overcome your specific technical challenges. Start with a free work planning session to map out your path to production excellence.
Leave a Reply