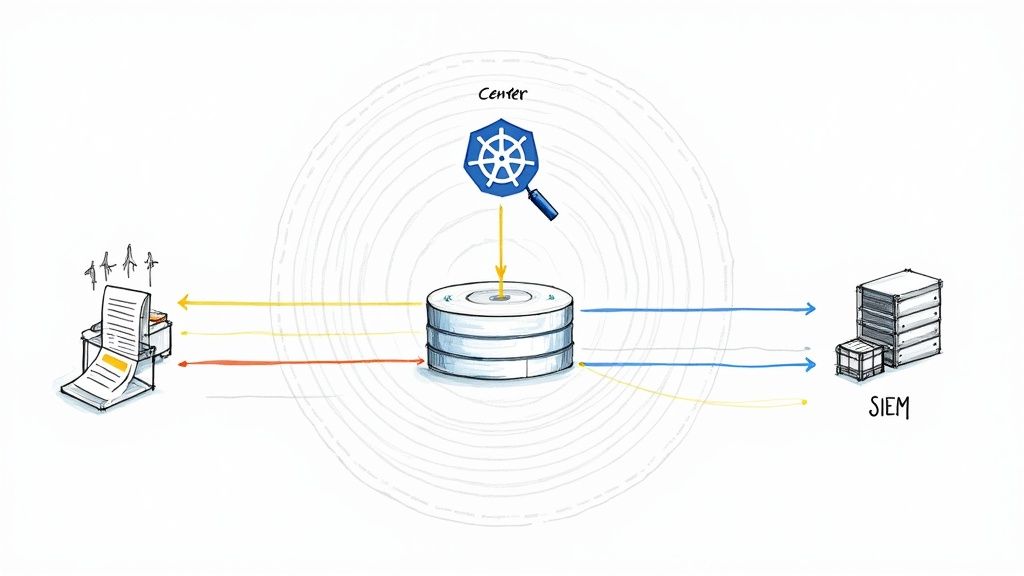
The Kubernetes audit log is the definitive black box recorder for your cluster, capturing a security-oriented, chronological record of every request that hits the Kubernetes API server. This log is the authoritative source for answering the critical questions: who did what, when, and from where? From a technical standpoint, this log is an indispensable tool for security forensics, compliance auditing, and operational debugging.
Why Audit Logs Are Non-Negotiable in Production
In any production-grade Kubernetes environment, understanding the sequence of API interactions is a core requirement for security and stability. Because the audit log captures every API call, it creates an immutable, chronological trail of all cluster activities, making it a cornerstone for several critical operational domains.
As Kubernetes adoption has surged, audit logs have become a primary control for governance and incident response. With the vast majority of organizations now running Kubernetes in production, robust auditing is a technical necessity.
To understand the practical value of these logs, let's dissect the structure of a typical audit event.
Anatomy of a Kubernetes Audit Event
Each entry in the audit log is a JSON object detailing a single API request. Understanding these fields is key to effective analysis.
| Field Name | Description | Example Value |
|---|---|---|
auditID |
A unique identifier for the event, essential for deduplication and tracing. | a1b2c3d4-e5f6-7890-1234-567890abcdef |
stage |
The stage of the request lifecycle when the event was generated (e.g., RequestReceived, ResponseStarted, ResponseComplete, Panic). |
ResponseComplete |
verb |
The HTTP verb corresponding to the requested action (create, get, delete, update, patch, list, watch). |
create |
user |
The authenticated user or service account that initiated the request, including group memberships. | { "username": "jane.doe@example.com", "uid": "...", "groups": [...] } |
sourceIPs |
A list of source IP addresses for the request, critical for identifying the request's origin. | ["192.168.1.100"] |
objectRef |
Details about the resource being acted upon, including its resource, namespace, name, and apiVersion. |
{ "resource": "pods", "namespace": "prod", "name": "nginx-app" } |
responseStatus |
The HTTP status code of the response, indicating success or failure. | { "metadata": {}, "code": 201 } |
requestObject |
The full body of the request object, logged at Request or RequestResponse levels. |
A complete JSON object, e.g., a Pod manifest. |
responseObject |
The full body of the response object, logged at the RequestResponse level. |
A complete JSON object, e.g., the state of a created Pod. |
Each event provides a rich data object, offering a complete forensic picture of every interaction with your cluster's control plane.
Security Forensics and Incident Response
During a security incident, the audit log is the primary source of truth. It allows security teams to reconstruct an attacker's lateral movements, identify compromised resources, and determine the blast radius of a breach.
For instance, specific log queries can reveal:
- Unauthorized Access: Search for events where
responseStatus.codeis403(Forbidden) against a sensitive resource like aSecret. - Privilege Escalation: An event where
verbiscreate,objectRef.resourceisclusterrolebindings, and therequestObjectbinds a user to thecluster-adminrole. - Anomalous Behavior: A spike in
deleteverbs onDeploymentorStatefulSetresources originating from an unknown IP insourceIPs.
Without this granular record, incident response becomes a high-latency process of conjecture, dramatically increasing the mean time to detect (MTTD) and remediate (MTTR).
Regulatory Compliance and Governance
Industries governed by frameworks like PCI-DSS, HIPAA, or SOX mandate detailed logging and auditing of system activities. A correctly configured Kubernetes audit log directly addresses these requirements by providing an immutable trail of evidence.
A well-maintained audit trail is your non-repudiable proof to auditors that you have controls to monitor access to sensitive data and critical system configurations. It demonstrates that you can trace any change back to a specific user identity and timestamp.
This capability is crucial for passing audits and avoiding significant financial penalties for non-compliance. It provides the concrete evidence of resource access and modification that underpins most compliance standards. For those new to these concepts, our Kubernetes tutorial for beginners offers a solid foundation.
Operational Debugging and Troubleshooting
Beyond security, audit logs are a powerful tool for debugging complex application and infrastructure issues. When a misconfiguration causes a service outage, the logs can pinpoint the exact API call responsible.
For example, if a developer accidentally deletes a critical ConfigMap, a query for verb: "delete" and objectRef.resource: "configmaps" will immediately identify the user, timestamp, and the exact manifest of the deleted object (if logged at the Request level). This eliminates guesswork and drastically reduces MTTR.
Configuring Audit Logging in Your Cluster
Enabling Kubernetes audit logging requires modifying the startup configuration for the kube-apiserver component of the control plane. The implementation details vary based on the cluster's deployment model, but the core configuration flags are consistent.
You will primarily use three flags to enable auditing:
--audit-policy-file: Points to a YAML file defining the audit policy rules—what to log and at what level of detail. This flag is mandatory; without it, no audit events are generated.--audit-log-path: Specifies the file path where the API server will write log events. A common value is/var/log/audit.log. If not specified, logs are sent to standard output.--audit-log-maxage: Sets the maximum number of days to retain old audit log files before they are automatically deleted, essential for managing disk space on control plane nodes.
Self-Managed Clusters Using Kubeadm
In a kubeadm-bootstrapped cluster, the kube-apiserver runs as a static pod defined by a manifest at /etc/kubernetes/manifests/kube-apiserver.yaml on control plane nodes. Enabling auditing requires editing this file directly.
First, create an audit policy file on each control plane node. A minimal starting policy can be placed at /etc/kubernetes/audit-policy.yaml:
# /etc/kubernetes/audit-policy.yaml
apiVersion: audit.k8s.io/v1
kind: Policy
rules:
  # Log all requests at the Metadata level.
  - level: Metadata
This policy logs the metadata for every request, providing a high-level overview without the performance overhead of logging request/response bodies.
Next, edit the /etc/kubernetes/manifests/kube-apiserver.yaml manifest. Add the audit flags to the command section and define volumeMounts and volumes to expose the policy file and log directory to the container.
# /etc/kubernetes/manifests/kube-apiserver.yaml
spec:
  containers:
  - command:
    - kube-apiserver
    # ... other flags
    - --audit-policy-file=/etc/kubernetes/audit-policy.yaml
    - --audit-log-path=/var/log/kubernetes/audit.log
    - --audit-log-maxage=30
    volumeMounts:
    # ... other volumeMounts
    - mountPath: /etc/kubernetes/audit-policy.yaml
      name: audit-policy
      readOnly: true
    - mountPath: /var/log/kubernetes/
      name: audit-log
  volumes:
  # ... other volumes
  - name: audit-policy
    hostPath:
      path: /etc/kubernetes/audit-policy.yaml
      type: File
  - name: audit-log
    hostPath:
      path: /var/log/kubernetes/
      type: DirectoryOrCreate
Upon saving these changes, the kubelet on the node will detect the manifest modification and automatically restart the kube-apiserver pod with the new audit configuration enabled.
Managed Kubernetes Services (GKE and EKS)
Managed Kubernetes providers abstract away direct control plane access, requiring you to use their specific APIs or UIs to manage audit logging.
-
Google Kubernetes Engine (GKE): GKE integrates audit logging with the Google Cloud operations suite. It's enabled by default and sends logs to Cloud Audit Logs. You can view logs in the Cloud Console's Logs Explorer and use the GKE API or
gcloudCLI to configure the audit logging level. -
Amazon Elastic Kubernetes Service (EKS): In EKS, you enable audit logging during cluster creation or via an update. You select the desired log types (
audit,api,authenticator) which are then streamed to Amazon CloudWatch Logs. This is configured via the AWS Management Console, CLI, or Infrastructure as Code tools like Terraform.
The trade-off with managed services is exchanging direct control for operational simplicity. The provider handles log collection and storage, but you are integrated into their ecosystem and must use their tooling for log analysis.
Local Development with Minikube
For local development and testing, Minikube allows you to pass API server flags directly during cluster startup.
This command starts a minikube cluster with a basic audit configuration:
minikube start --extra-config=apiserver.audit-policy-file=/etc/kubernetes/audit-policy.yaml \
--extra-config=apiserver.audit-log-path=/var/log/audit.log \
--extra-config=apiserver.audit-log-maxage=1
You must first copy your audit-policy.yaml file into the Minikube VM using minikube cp audit-policy.yaml minikube:/etc/kubernetes/audit-policy.yaml. This provides a fast feedback loop for testing and refining audit policies before production deployment.
Crafting a High-Impact Audit Policy
The audit policy is the core of your Kubernetes logging strategy. It's a set of rules that instructs the API server on precisely what to record and what to ignore. A poorly designed policy will either log nothing useful or overwhelm your logging backend with low-value, high-volume data.
The objective is to achieve a balance: capture all security-relevant actions while filtering out the benign chatter from system components and routine health checks.
Your configuration path will vary depending on your environment, as illustrated by this decision flowchart.
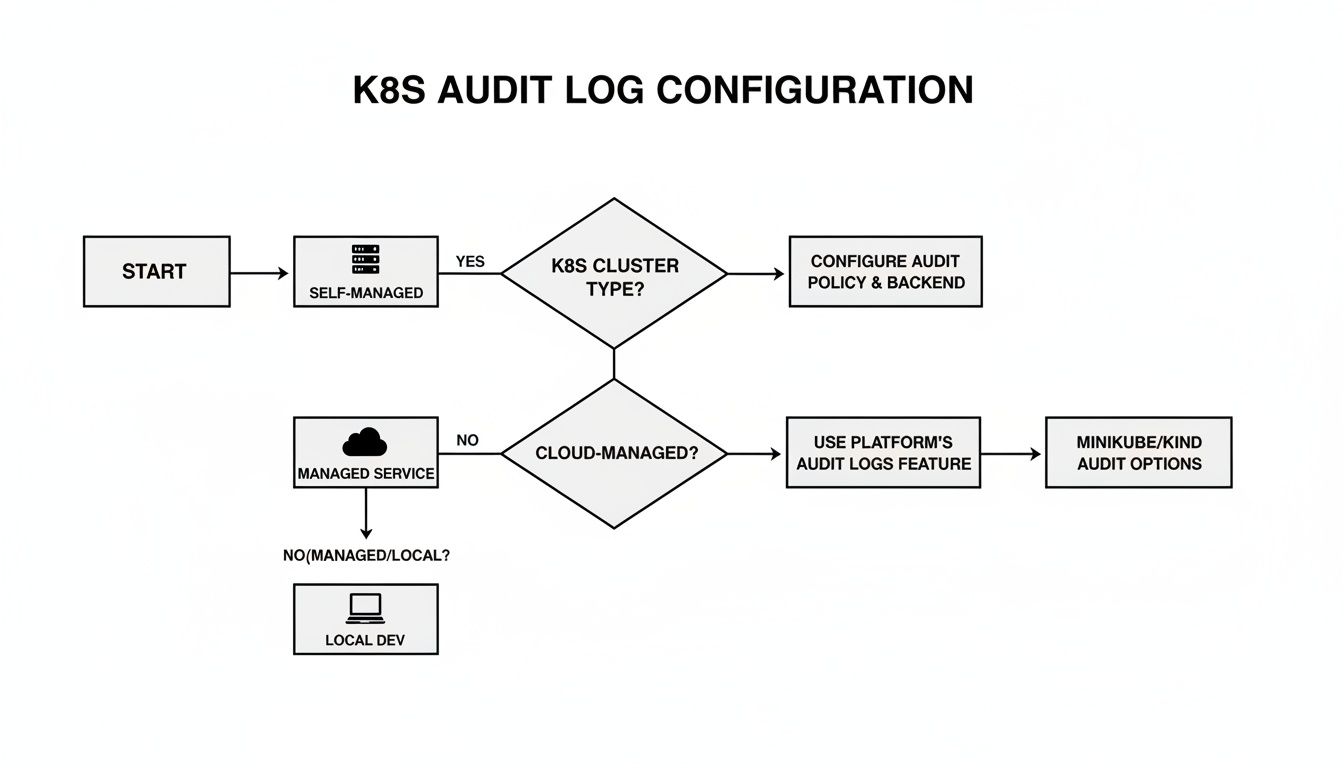
As shown, self-managed clusters offer direct control over the audit policy file and API server flags, whereas managed services require you to work within their provided configuration interfaces.
Understanding Audit Policy Structure and Levels
An audit policy is a YAML file containing a list of rules. When a request hits the API server, it is evaluated against these rules sequentially. The first rule that matches determines the audit level for that event.
There are four primary audit levels, each representing a trade-off between visibility and performance overhead.
Audit Level Comparison and Use Cases
Selecting the correct audit level is critical. Using RequestResponse indiscriminately will degrade API server performance, while relying solely on Metadata may leave blind spots during a security investigation. This table outlines each level's characteristics and optimal use cases.
| Audit Level | Data Logged | Performance Impact | Recommended Use Case |
|---|---|---|---|
None |
No data is recorded for matching events. | Negligible | Essential for filtering high-frequency, low-risk requests like kubelet health checks (/healthz, /livez) or controller leader election leases. |
Metadata |
Logs user, timestamp, resource, and verb. Excludes request and response bodies. | Low | The ideal baseline for most read operations (get, list, watch) and high-volume system traffic that still requires tracking. |
Request |
Logs Metadata plus the full request body. |
Medium | Captures the "what" of a change without the overhead of the response. Useful for logging the manifest of a newly created pod or other resources. |
RequestResponse |
The most verbose level. Logs metadata, request body, and response body. | High | Reserved for critical, sensitive write operations (create, update, delete, patch) on resources like Secrets, ClusterRoles, or Deployments. |
An effective policy employs a mix of all four levels, applying maximum verbosity to the most critical actions and silencing the noise from routine system operations.
Building Practical Audit Policies
Let's translate theory into actionable policy examples. These policies provide a robust starting point that can be adapted to your specific cluster requirements.
A best-practice approach is to align the policy with established security benchmarks, such as the CIS Kubernetes Benchmark, to ensure comprehensive visibility without generating excessive log volume.
# A baseline CIS-compliant audit policy example
apiVersion: audit.k8s.io/v1
kind: Policy
rules:
  # Ignore high-volume, low-risk requests from system components and health checks.
  - level: None
    users: ["system:kube-proxy"]
    verbs: ["watch"]
    resources:
    - group: ""
      resources: ["endpoints", "services"]
  - level: None
    userGroups: ["system:nodes"]
    verbs: ["get"]
    resources:
    - group: ""
      resources: ["nodes"]
  - level: None
    # Health checks are high-volume and low-value.
    nonResourceURLs:
    - "/healthz*"
    - "/version"
    - "/livez*"
    - "/readyz*"

  # Log sensitive write operations with full request/response details.
  - level: RequestResponse
    resources:
    - group: ""
      resources: ["secrets", "configmaps", "serviceaccounts"]
    - group: "rbac.authorization.k8s.io"
      resources: ["clusterroles", "clusterrolebindings", "roles", "rolebindings"]
    verbs: ["create", "update", "patch", "delete"]

  # Log metadata for all other requests as a catch-all to ensure nothing is missed.
  - level: Metadata
    omitStages:
      - "RequestReceived"
This policy is strategically designed. It begins by explicitly ignoring high-frequency noise from kube-proxy and node health checks. It then applies RequestResponse logging to security-critical resources like Secrets and RBAC objects—precisely the data required for forensic analysis.
Adopt a "log by default, ignore by exception" strategy. Start with a catch-all
Metadatarule at the bottom of your policy. Then, add more specificNoneorRequestResponserules above it to handle exceptions. This ensures you never inadvertently miss an event.
Implementing a robust audit policy is a top priority for security teams. With a significant number of security incidents stemming from misconfigurations or exposed control planes, audit logs are the primary tool for detection and forensics. Red Hat's 2024 trends report found that nearly 89% of organizations experienced a container or Kubernetes security incident in the last year, and 53% faced project delays due to security issues, underscoring the critical role of audit logs in root cause analysis. For a deeper technical perspective, review this Kubernetes threat hunting analysis.
Shipping and Storing Audit Logs at Scale
Generating detailed Kubernetes audit logs is the first step. To transform this raw data into actionable intelligence, you must implement a robust pipeline to transport logs from the control plane nodes to a centralized log analytics platform.
The kube-apiserver provides two primary backends for this purpose: writing to a local log file or sending events to a remote webhook. Your choice of backend will fundamentally define your logging architecture.
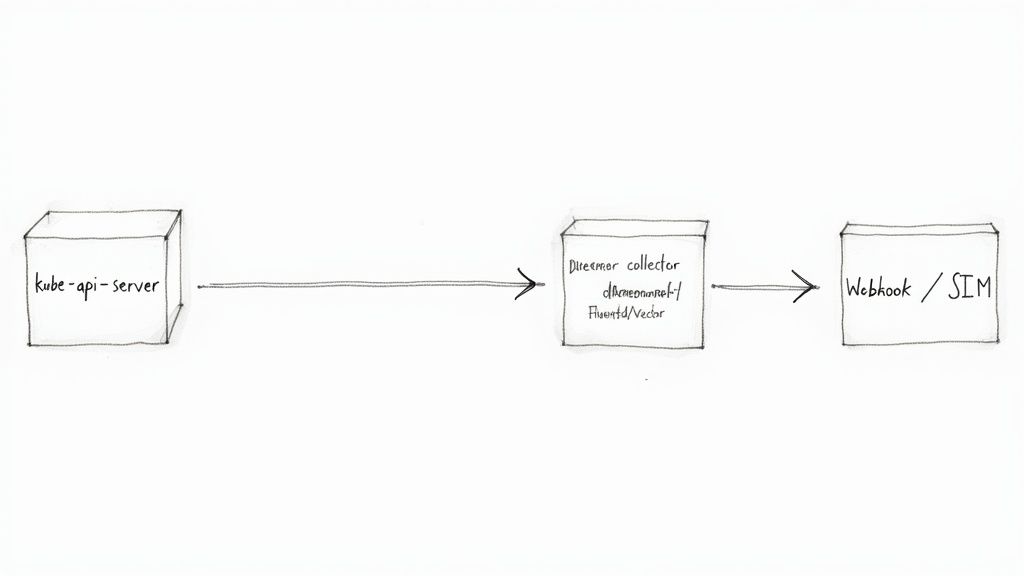
The Log File Backend with a Forwarder
The most common and resilient method is to configure the API server to write audit events to a local file (--audit-log-path). This alone is insufficient; a log forwarding agent, typically deployed as a DaemonSet on the control plane nodes, is required to complete the pipeline.
This agent tails the audit log file, parses the JSON-formatted events, and forwards them to a centralized log management system or SIEM.
Popular open-source agents for this task include:
- Fluentd: A highly extensible and mature log collector with a vast ecosystem of plugins for various output destinations.
- Fluent Bit: A lightweight, high-performance log processor, designed for resource-constrained environments.
- Vector: A modern, high-performance agent built in Rust, focusing on reliability and performance in observability data pipelines.
This architecture decouples log collection from the API server's critical path. If the downstream logging endpoint experiences an outage, the agent can buffer logs locally on disk, preventing data loss.
The Webhook Backend for Direct Streaming
For a more direct, real-time approach, the API server can be configured to send audit events to an external HTTP endpoint via the webhook backend. This bypasses the need for a local log file and a separate forwarding agent on the control plane.
With each audit event, the API server sends a POST request containing a batch of events to the configured webhook URL. This is a powerful method for direct integration with:
- Custom log processing applications.
- Serverless functions like AWS Lambda or Google Cloud Functions.
- Real-time security tools like Falco that can consume and react to audit events instantly.
A critical configuration detail for the webhook backend is its operational mode. The default
batchmode is asynchronous and non-blocking, making it suitable for most use cases. However, theblockingmode forces the API server to wait for the webhook to respond before completing the original client request. Useblockingwith extreme caution, as it can introduce significant latency and impact API server performance.
This direct streaming approach is excellent for low-latency security alerting but creates a tight operational dependency. If the webhook receiver becomes unavailable, the API server may drop audit events, depending on its buffer configuration.
Choosing the Right Architecture
The choice between a log file forwarder and a webhook depends on the trade-offs between reliability, complexity, and real-time requirements.
This table provides a technical comparison to guide your decision.
| Feature | Log File + Forwarder | Webhook Backend |
|---|---|---|
| Reliability | Higher. Decoupled architecture allows the agent to buffer logs on disk during backend outages, preventing data loss. | Lower. Tightly coupled; dependent on the availability of the webhook endpoint and API server buffers. |
| Complexity | Higher. Requires deploying and managing an additional agent (DaemonSet) on control plane nodes. | Lower. Simplifies the control plane architecture by eliminating the need for a separate agent. |
| Performance | Minimal impact on the API server, as it's an asynchronous local file write. | Potential impact. Can add latency to API requests, especially in blocking mode. |
| Real-Time | Near real-time, with a slight delay introduced by the forwarding agent's buffer and flush interval. | True real-time streaming, ideal for immediate threat detection and response. |
In practice, many large-scale environments adopt a hybrid approach. They use a log forwarder for durable, long-term storage and compliance, while simultaneously configuring a webhook to send a specific subset of critical security events to a real-time detection engine. This provides both comprehensive, reliable storage and immediate, actionable security alerts. For a broader view on this topic, review these log management best practices.
Real-World Threat Detection Playbooks
With a functional Kubernetes audit log pipeline, you can transition from passive data collection to proactive threat hunting. These technical playbooks provide actionable queries to detect specific, high-risk activities within your cluster. The queries are designed to be adaptable to any log analysis platform that supports JSON querying, such as Elasticsearch, Splunk, or Loki.
This audit-driven detection approach is becoming an industry standard. Between 2022 and 2025, the use of automated detection and response based on audit logs has seen significant growth. Industry reports from observability and security vendors consistently show that integrating Kubernetes API server audit logs into detection pipelines dramatically reduces the mean time to detect (MTTD) and mean time to remediate (MTTR) for cluster-based security incidents.
Playbook 1: Detecting Privileged Pod Creation
Creating a pod with securityContext.privileged: true is one of the most dangerous operations in Kubernetes. It effectively breaks container isolation, granting the pod root-level access to the host node's kernel and devices. A compromised privileged pod is a direct path to host and cluster compromise.
The Threat: A privileged pod can manipulate host devices (/dev), load kernel modules, and bypass nearly all container security mechanisms, facilitating a container escape.
Detection Query:
The objective is to identify any audit event where a pod was created or updated with the privileged flag set to true.
- Target Fields:
verb: "create" OR "update"objectRef.resource: "pods"requestObject.spec.containers[*].securityContext.privileged: "true"
Example (Loki LogQL Syntax):
{job="kube-audit"} | json | verb=~"create|update" and objectRef_resource="pods" | line_format "{{ .requestObject }}" | json | spec_containers_securityContext_privileged="true"
Playbook 2: Spotting Risky Exec Sessions
The kubectl exec command, while essential for debugging, is a primary tool for attackers to gain interactive shell access within a running container. This access can be used to exfiltrate data, steal credentials, and pivot to other services within the cluster network.
The Threat: An attacker can use an exec session to access service account tokens (/var/run/secrets/kubernetes.io/serviceaccount/token), explore the container's filesystem, and launch further attacks.
Detection Query:
Filter for events that represent the creation of an exec subresource on a pod. Monitoring the response code identifies successful attempts.
- Target Fields:
verb: "create"objectRef.resource: "pods"objectRef.subresource: "exec"responseStatus.code: 201 (Created) for successful connections
Example (Elasticsearch KQL Syntax):
verb: "create" AND objectRef.resource: "pods" AND objectRef.subresource: "exec" AND responseStatus.code: 201
Playbook 3: Identifying Dangerous Role Bindings
Privilege escalation is a primary attacker objective. In Kubernetes, a common technique is to create a ClusterRoleBinding that grants a user or service account powerful permissions, such as the omnipotent cluster-admin role.
An alert on the creation of a binding to the
cluster-adminrole is a mandatory, high-severity detection rule for any production environment. This single action can grant an attacker complete administrative control over the entire cluster.
The Threat: A malicious or accidental binding can instantly escalate a low-privilege identity to a cluster superuser. This level of auditing is a non-negotiable requirement in regulated environments, such as those subject to PSD2 Banking Integration.
Detection Query:
Hunt for the creation of any ClusterRoleBinding that references the cluster-admin ClusterRole.
- Target Fields:
verb: "create"objectRef.resource: "clusterrolebindings"requestObject.roleRef.name: "cluster-admin"requestObject.roleRef.kind: "ClusterRole"
Example (Splunk SPL Syntax):
index="k8s_audit" verb="create" objectRef.resource="clusterrolebindings" requestObject.roleRef.name="cluster-admin" | table user, sourceIPs, objectRef.name
Building these detection capabilities is a cornerstone of a mature Kubernetes security posture. To further strengthen your defenses, review our comprehensive guide on Kubernetes security best practices. By transforming your audit logs into an active threat detection system, you empower your team to identify and neutralize threats before they escalate into incidents.
Common Questions About Kubernetes Auditing
When implementing Kubernetes audit logging, several practical questions consistently arise regarding performance, retention, and filtering. Addressing these correctly is crucial for creating a valuable and sustainable security tool.
What's the Real Performance Hit from Enabling Audit Logging?
The performance impact of audit logging is directly proportional to your audit policy's verbosity and the API server's request volume. There is no single answer.
A poorly configured policy that logs all requests at the RequestResponse level will impose significant CPU and memory overhead on the kube-apiserver and increase API request latency. The key is to be strategic and surgical.
A battle-tested strategy includes:
- Use the
Metadatalevel for high-frequency, low-risk requests, such as kubelet health checks or routine reads from system controllers. - Reserve
RequestResponselogging for security-critical write operations: creating secrets, modifying RBAC roles, or deleting deployments.
Technical advice: Always benchmark your cluster's performance (API request latency, CPU/memory usage of
kube-apiserver) before and after deploying a new audit policy. This is the only way to quantify the real-world impact and ensure you have not introduced a new performance bottleneck.
How Long Should I Actually Keep These Logs?
The required retention period is dictated by your organization's specific compliance and security policies. However, industry standards provide a solid baseline.
Many regulatory frameworks like PCI DSS mandate that logs be retained for at least one year, with a minimum of three months immediately accessible for analysis. For general security forensics and incident response, a retention period of 90 to 180 days in a hot, searchable storage tier is a common and effective practice.
After this period, logs can be archived to cheaper, cold storage solutions for long-term retention. It is imperative to consult with your internal compliance and legal teams to establish an official data retention policy.
Can I Just Audit Events from One Specific Namespace?
Yes. Kubernetes audit policy rules are designed for this level of granularity. You can precisely target specific workloads by combining multiple attributes within a rule.
For example, to implement heightened monitoring on a critical database namespace, you could create a specific rule like this in your audit policy:
- level: RequestResponse
  verbs: ["create", "update", "patch", "delete"]
  resources:
  - group: "" # Core API group
    resources: ["secrets", "configmaps"]
  namespaces: ["production-db"]
This rule logs the full request and response bodies for any modification to Secrets or ConfigMaps but only within the production-db namespace. This granular control is your most effective tool against log fatigue, allowing you to increase verbosity on sensitive areas while filtering out noise from less critical operations, resulting in a cleaner, more actionable security signal.
Managing Kubernetes infrastructure requires deep expertise. At OpsMoon, we connect you with the top 0.7% of remote DevOps engineers to build, secure, and scale your cloud-native environments. Start with a free work planning session to map out your DevOps roadmap.
Leave a Reply