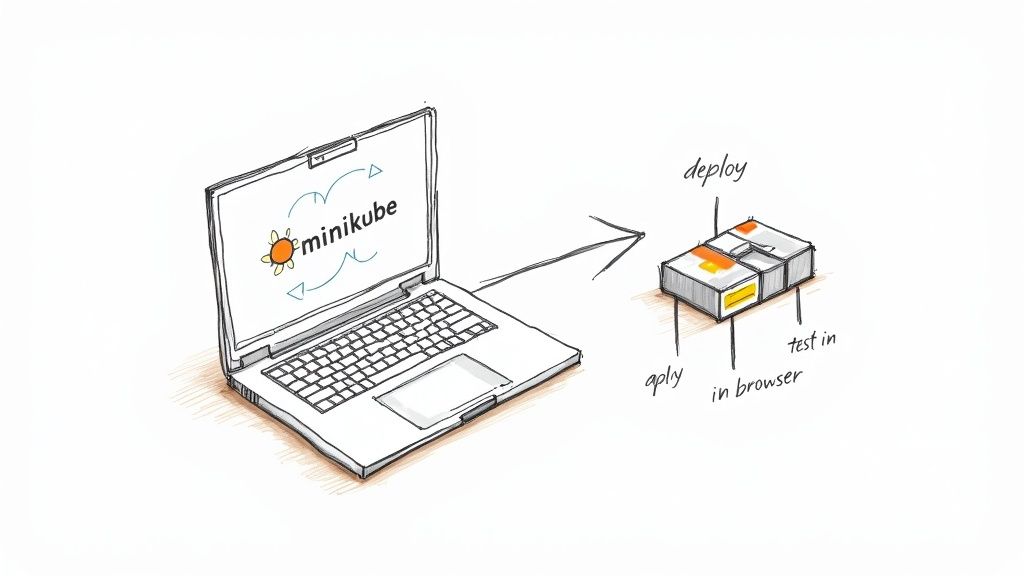
A Kubernetes tutorial for beginners should feel more like pairing with a teammate than reading dry docs. You’ll learn how to launch a local cluster, apply your YAML manifests, open services, and then hit those endpoints in your browser. Minikube mirrors the hands-on flow of a small startup running microservices on a laptop before shifting to a cloud provider. We’ll also cover how to enable metrics-server and Ingress addons to prepare for autoscaling and routing.
Kickoff Your Kubernetes Tutorial Journey
Before you type a single command, let’s sketch out the journey ahead. You’ll:
- Spin up a local cluster with Minikube or kind
- Apply YAML files to create Pods, ConfigMaps and Deployments
- Expose your app via Services, Ingress, and RBAC
- Enable metrics-server for autoscaling
- Validate endpoints and inspect resource metrics
- Spot common hiccups like context mix-ups, CrashLoopBackOff or RBAC denials
Deploying microservices in Minikube turns abstract terms into something you can click and inspect. One early adopter I worked with stood up a Node.js API alongside a React frontend, then reproduced the exact same setup on GKE. That early local feedback loop caught misconfigured CPU limits before they ever hit production.
Real-World Setup Scenario
Here’s what our team actually did:
- Started Minikube with a lightweight VM and enabled addons:
minikube start --cpus 2 --memory 4096 --driver=docker minikube addons enable ingress metrics-server - Built and tagged custom Docker images with local volume mounts
- Applied Kubernetes manifests for Deployments, Services, ConfigMaps and Secrets
“Testing locally with Minikube shaved days off debugging networking configs before pushing to production.”
Whether you pick Minikube or kind hinges on your needs. Minikube gives you a full VM—perfect for testing PersistentVolumes or Ingress controllers. kind spins clusters in Docker containers, which is a real winner if you’re automating tests in CI.
Hands-on tutorials often stumble on the same few issues:
- Forgetting to switch your kubectl context (
kubectl config use-context) - Overlooking default namespaces and hitting “not found” errors
- Skipping resource requests and limits, leading to unexpected restarts
Calling out these pitfalls early helps you sidestep them.
Tool Selection Tips
- Verify your laptop can handle 2 CPUs and 4GB RAM before you choose a driver
- Install metrics-server for HPA support:
kubectl apply -f https://github.com/kubernetes-sigs/metrics-server/releases/latest/download/components.yaml - Pick kind for lightweight, ephemeral clusters in CI pipelines
- Pin your cluster version to match production:
minikube start --kubernetes-version=v1.24.0 - Install kubectx for fast context and namespace switching
- Consider CRI-O or containerd as alternative runtimes for parity with managed clouds
These small prep steps smooth out cluster spins and cut down on frustrating errors.
Next up, we’ll explore core Kubernetes objects—Pods, Services, Deployments, ConfigMaps, and RBAC—with concrete examples.
Understanding Kubernetes Core Concepts
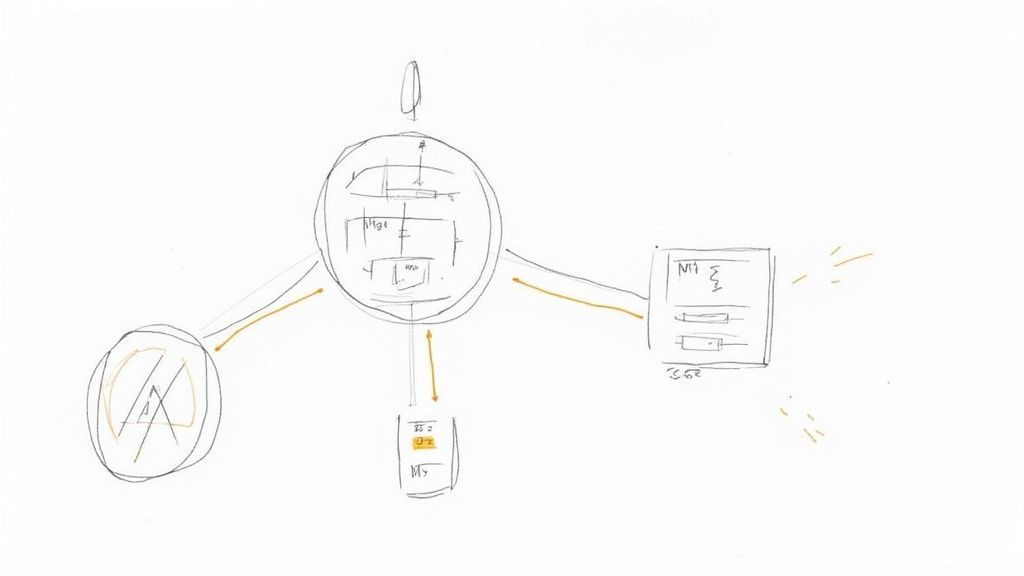
Every Kubernetes cluster relies on a handful of core objects to keep workloads running smoothly. Think of them as the foundation beneath a media streaming service: they coordinate video transcoders, balance traffic, and spin up resources on demand. Grasping these abstractions will set you on the right path as you build out your own Kubernetes tutorial for beginners.
A Pod is the smallest thing you can deploy—it packages one or more containers with a shared network and storage namespace. Because pods share the host kernel, they launch in seconds and consume far fewer resources than virtual machines.
Your cluster is made up of Nodes, the worker machines that run pods. The Control Plane then decides where each pod should land, keeping an eye on overall health and distributing load intelligently.
- Pods: Group containers that need to talk over localhost
- Nodes: Physical or virtual machines providing CPU and memory
- ReplicaSets: Keep a desired number of pods alive at all times
- Deployments: Declarative rollouts and rollbacks around ReplicaSets
- Services: Offer stable IPs and DNS names for pod sets
- ConfigMaps: Inject configuration data as files or environment variables
- Secrets: Store credentials and TLS certs securely
- ServiceAccounts & RBAC: Control API access
Pod And Node Explained
Pods have largely replaced the old VM-centric model for container workloads. In our streaming pipeline, for instance, we launch separate pods hosting transcoder containers for 720p, 1080p, and 4K streams. Splitting them this way lets us scale each resolution independently, without booting up full operating systems.
Behind the scenes, nodes run the kubelet agent to report pod health back to the control plane. During a live event with sudden traffic spikes, we’ve seen autoscaling add nodes in minutes—keeping streams running without a hitch.
During peak traffic, rolling updates kept our transcoding service online without dropping frames.
Controls And Abstractions
When you need to update your application, Deployments wrap ReplicaSets so rollouts and rollbacks happen gradually. You declare the desired state—and Kubernetes handles the rest—avoiding full-scale outages when you push a new version.
Namespaces let you carve up a cluster for different teams, projects, or environments. In our lab, “dev” and “prod” namespaces live side by side, each with its own resource quotas and access controls.
Define resource limits on pods:
resources:
  requests:
    cpu: "200m"
    memory: "512Mi"
  limits:
    cpu: "500m"
    memory: "1Gi"
Label workloads clearly for quick filtering and monitoring.
Since Google open-sourced Kubernetes on June 6, 2014, it’s become the de facto container orchestrator. By 2025, over 60% of enterprises worldwide will rely on it, with adoption rates soaring to 96% according to CNCF surveys. Explore the full research on ElectroIQ.
Networking With Services
Rather than hard-coding pod IPs, Services give you stable endpoints. You can choose:
- ClusterIP for internal-only traffic
- NodePort to expose a service on each node’s port
- LoadBalancer to tie into your cloud provider’s load balancer
- ExternalName for DNS aliases
In our streaming setup, a LoadBalancer Service made the transcoder API accessible to external clients, routing traffic seamlessly through updates. When you work locally with Minikube, switching to NodePort lets you test that same setup on your laptop.
For HTTP routing, Ingress steps in with host- and path-based rules. Pair it with an Ingress controller—NGINX, for example—to direct requests to the right service in a multi-tenant environment.
Comparison Of Kubernetes Core Objects
| Object Type | Purpose | When To Use | Example Use Case |
|---|---|---|---|
| Pod | Encapsulate one or more containers | Single-instance or tightly coupled | Streaming transcoder |
| ReplicaSet | Maintain a stable set of pod replicas | Ensure availability after failures | Auto-recover crashed pods |
| Deployment | Manage ReplicaSets declaratively | Rolling updates and safe rollbacks | Versioned microservice launches |
| Service | Expose pods through stable endpoints | Connect clients to backend pods | External API via LoadBalancer |
With this comparison in hand, you can:
- Scope pods for simple tasks
- Rely on ReplicaSets for resilience
- Use deployments to handle versioning safely
- Expose endpoints through services without worrying about pod churn
Next up, we’ll deploy a sample app—putting these fundamentals into practice and solidifying your grasp of Kubernetes core concepts.
Setting Up A Local Kubernetes Cluster
Creating a sandbox on your laptop is where the tutorial truly comes alive. You’ll need either Docker or a hypervisor driver (VirtualBox, HyperKit, Hyper-V or WSL2) to host Minikube or kind. By matching macOS, Linux or Windows to your production setup, you reduce surprises down the road.
Before you jump in, gather these essentials:
- Docker running as your container runtime
- A hypervisor driver (VirtualBox, HyperKit, Hyper-V or WSL2) enabled
- kubectl CLI at version v1.24 or higher
- 2 CPUs and 4 GB RAM allocated
- Metrics-server
- kubectx (optional) for lightning-fast context switching
With those in place, the same commands work whether you’re on Homebrew (macOS), apt/yum (Linux) or WSL2 (Windows).
Cluster Initialization Examples
Spinning up Minikube gives you a VM-backed node that behaves just like production:
minikube start --cpus 2 --memory 4096 --driver=docker
minikube addons enable ingress metrics-server
Enable the dashboard and ingress:
minikube addons enable dashboard
minikube addons enable ingress
kind, on the other hand, runs control-plane and worker nodes as Docker containers. Here’s a snippet you can tweak to mount your code and pin the K8s version:
kind: Cluster
apiVersion: kind.x-k8s.io/v1alpha4
nodes:
- role: control-plane
  extraMounts:
  - hostPath: ./app
    containerPath: /app
Mounting your local directory means you’ll see code changes inside pods instantly—no image rebuild required.
Once the YAML is saved as kind.yaml, launch the cluster:
kind create cluster --config kind.yaml
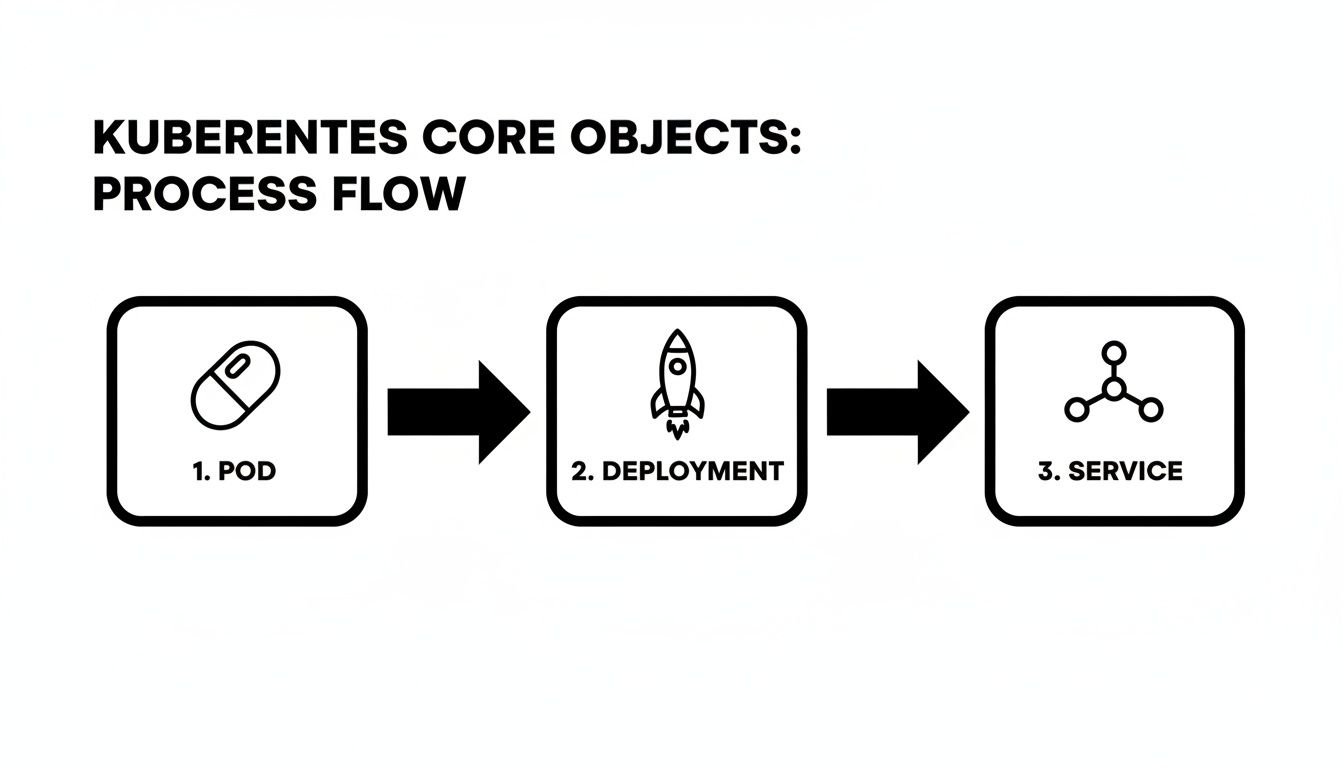
This diagram walks you through how a Pod moves into a Deployment and then exposes itself via a Service—exactly what you’ll see in a live environment.
Minikube Versus kind Comparison
Picking the right local tool often comes down to isolation, startup speed and how you load your code. Here’s a quick look:
| Feature | Minikube | kind | Best For |
|---|---|---|---|
| Isolation | Full VM with a hypervisor | Docker container environment | Ingress & PV testing |
| Startup Time | ~20 seconds | ~5 seconds | CI pipelines |
| Local Code Mounting | Limited hostPath support | Robust volume mounts | Rapid dev feedback loops |
| Version Flexibility | Yes | Yes | Cluster version experiments |
Use Minikube when you need VM-like fidelity for Ingress controllers or PersistentVolumes. kind shines when you want near-instant spins for CI and rapid iteration.
Optimizing Context And Resource Usage
Once both clusters are live, juggling contexts takes two commands:
kubectl config use-context minikube
kubectl config use-context kind
Validate everything with:
kubectl cluster-info
kubectl get nodes
kubectl top nodes
And when something breaks, these are your first stops:
minikube logs
kind get logs
Common Initialization Troubleshooting
Boot errors usually trace back to resource constraints or driver mismatches. Try these fixes:
- driver not found → confirm Docker daemon is running
- port conflict → adjust ports with minikube config set
- CrashLoopBackOff in init containers → run
kubectl describe pod
Deleting old clusters (
minikube deleteorkind delete cluster) often clears out stubborn errors and stale state.
Performance Optimization Tips
Tune CPU/memory to your laptop’s profile:
minikube start --memory 2048 --cpus 1
Slow image pulls? A local registry mirror slashes wait time. And to test builds instantly:
kind load docker-image my-app:latest
As of 2025, the United States represents 52.4% of Kubernetes users—that’s 17,914 organizations running mission-critical workloads. Grasping that scale will help you manage real-world kubectl operations on clusters of any size. Learn more about Kubernetes adoption findings on EdgeDelta.
Read also: Check out our guide on Docker Container Tutorial for Beginners on OpsMoon.
Deploy A Sample App Using Kubectl
Deploying a Node.js microservice on Kubernetes is one of the best ways to see how real-world CI pipelines operate. We’ll package your app into a Docker image, write a Deployment manifest in YAML, and use a handful of kubectl commands to spin everything up. By the end, you’ll feel confident navigating typical kubectl workflows used in both startups and large enterprises.
Writing The Deployment Manifest
Save your YAML in a file called deployment.yaml and define a Deployment resource:
apiVersion: apps/v1
kind: Deployment
metadata:
  name: node-deployment
  labels:
    app: node-microservice
spec:
  replicas: 3
  selector:
    matchLabels:
      app: node-microservice
  template:
    metadata:
      labels:
        app: node-microservice
    spec:
      serviceAccountName: node-sa
      containers:
      - name: node-container
        image: my-node-app:latest
        ports:
        - containerPort: 3000
        resources:
          requests:
            cpu: "200m"
            memory: "512Mi"
          limits:
            cpu: "500m"
            memory: "1Gi"
        envFrom:
        - configMapRef:
            name: node-config
Create a ConfigMap for environment variables:
kubectl create configmap node-config --from-literal=NODE_ENV=production
Define a ServiceAccount and minimal RBAC:
apiVersion: v1
kind: ServiceAccount
metadata:
  name: node-sa
---
apiVersion: rbac.authorization.k8s.io/v1
kind: Role
metadata:
  name: pod-reader
rules:
- apiGroups: [""]
  resources: ["pods"]
  verbs: ["get","watch","list"]
---
apiVersion: rbac.authorization.k8s.io/v1
kind: RoleBinding
metadata:
  name: read-pods-binding
subjects:
- kind: ServiceAccount
  name: node-sa
roleRef:
  kind: Role
  name: pod-reader
  apiGroup: rbac.authorization.k8s.io
Launching The Deployment
Apply your manifest with:
kubectl apply -f deployment.yaml
kubectl apply -f serviceaccount-and-rbac.yaml
Monitor pods as they start:
kubectl get pods -l app=node-microservice -w
Once READY reads “1/1” and STATUS shows “Running,” your microservice is live.
Pro Tip
Filter resources quickly by label:kubectl get pods -l app=node-microservice
If a pod enters CrashLoopBackOff, run kubectl describe pod and kubectl logs [pod] to inspect startup events and stdout/stderr.
Rolling Updates And Rollbacks
Kubernetes updates Deployments without downtime by default. To push a new version:
kubectl set image deployment/node-deployment node-container=my-node-app:v2
kubectl rollout status deployment/node-deployment
If issues arise, revert instantly:
kubectl rollout undo deployment/node-deployment
Integrate these commands into a CI pipeline to enable automatic rollbacks whenever health checks fail.
Exposing The App With A Service
Define a Service in service.yaml:
apiVersion: v1
kind: Service
metadata:
  name: node-service
  annotations:
    maintainer: dev-team@example.com
spec:
  type: NodePort
  ports:
  - port: 80
    targetPort: 3000
    nodePort: 30080
  selector:
    app: node-microservice
Apply it:
kubectl apply -f service.yaml
kubectl get svc node-service
Access your service via:
minikube service node-service --url
# or on kind
kubectl port-forward svc/node-service 8080:80
Kubernetes security, valued at USD 1,195 billion in 2022 and projected to hit USD 10.7 billion by 2031 at a 27.6% CAGR, highlights why mastering kubectl apply -f on a simple Deployment matters. It’s the same flow 96% of teams use to scale, even though 91% must navigate complex setups. Explore Kubernetes security statistics on Tigera
Handover Tips For Collaboration
Document key details directly in your YAML to help cross-functional teams move faster:
- maintainer: who owns this Deployment
- revisionHistoryLimit: how many old ReplicaSets you can revisit
- annotations: version metadata, runbook links, or contact info
- Use
kubectl diff -f deployment.yamlto preview changes before applying
With these notes in place, troubleshooting and ownership handoffs become much smoother.
You’ve now built your Docker image, deployed it with kubectl, managed rolling updates and rollbacks, and exposed the service. Next up: exploring Ingress patterns and autoscaling to optimize traffic flow and resource usage. Happy deploying!
Configuring Services Ingress And Scaling
Exposing your application means picking the right Service type for internal or external traffic. ClusterIP, NodePort, LoadBalancer and ExternalName each come with distinct network paths, cost implications, and operational trade-offs.
Small teams often lean on ClusterIP to keep services hidden inside the cluster. Switch to NodePort when you want a quick-and-dirty static port on each node. Moving to a LoadBalancer taps into your cloud provider’s managed balancing and SSL features. And ExternalName lets you map a Kubernetes DNS name to remote legacy services without touching your pods.
Comparison Of Service Types
| Service Type | Default Port | External Access | Use Case |
|---|---|---|---|
| ClusterIP | 8080 | Internal only | Backend microservices |
| NodePort | 30000–32767 | Node.IP:Port on each node | Local testing and demos |
| LoadBalancer | 80/443 | Cloud provider’s load balancer | Public-facing web applications |
| ExternalName | N/A | DNS alias to an external service | Integrate external dependencies |
With this comparison in hand, you can match cost, access scope, and complexity to your project’s needs.
Deploy Ingress Controller
An Ingress gives you host- and path-based routing without provisioning dozens of load balancers. Install NGINX Ingress Controller:
kubectl apply -f https://raw.githubusercontent.com/kubernetes/ingress-nginx/controller-v1.2.1/deploy/static/provider/cloud/deploy.yaml
Your minimal Ingress resource:
apiVersion: networking.k8s.io/v1
kind: Ingress
metadata:
  name: app-ingress
  annotations:
    nginx.ingress.kubernetes.io/rewrite-target: /
spec:
  rules:
  - host: myapp.example.com
    http:
      paths:
      - path: /
        pathType: Prefix
        backend:
          service:
            name: frontend-service
            port:
              number: 80
Apply and verify:
kubectl apply -f ingress.yaml
kubectl get ingress
Ingress consolidates entry points and cuts down on public IP sprawl.
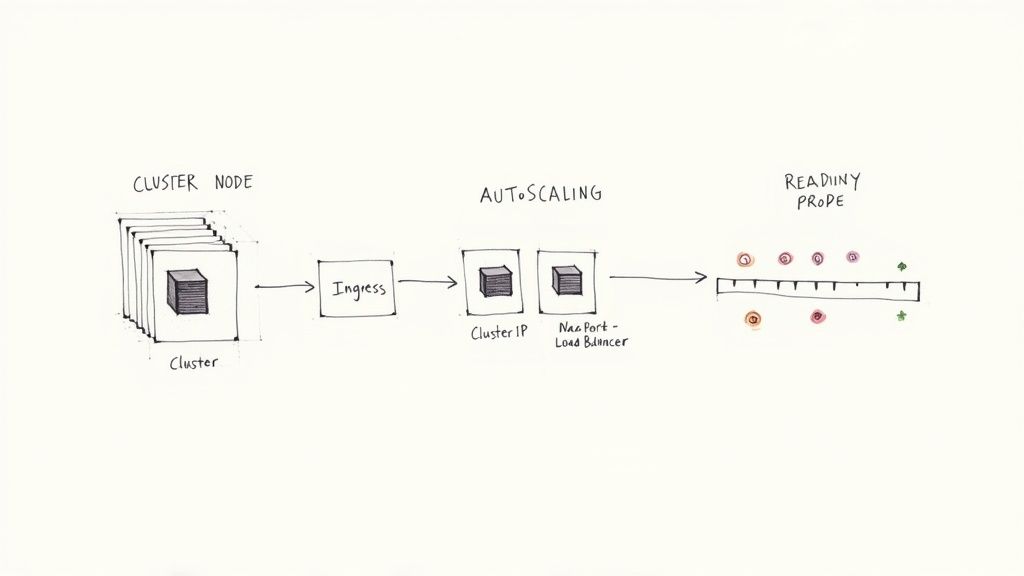
Implement Autoscaling
Horizontal Pod Autoscaler (HPA) watches your workload and adjusts replica counts based on metrics. First, ensure metrics-server is running:
kubectl get deployment metrics-server -n kube-system
Then enable autoscaling:
kubectl autoscale deployment frontend --cpu-percent=60 --min=2 --max=10
To see it in action, fire off a load test:
hey -z 2m -q 50 -c 5 http://myapp.example.com/
Track behavior live:
kubectl get hpa -w
Dive deeper into fine-tuning strategies in our guide on Kubernetes autoscaling.
Key Insight
Autoscaling cuts costs during lulls and protects availability under traffic spikes.
Rolling Updates Under Traffic
Zero-downtime upgrades depend on readiness and liveness probes. For instance:
readinessProbe:
  httpGet:
    path: /healthz
    port: 80
  initialDelaySeconds: 5
  periodSeconds: 10
livenessProbe:
  httpGet:
    path: /healthz
    port: 80
  initialDelaySeconds: 15
  periodSeconds: 20
Trigger the rollout:
kubectl set image deployment/frontend frontend=myapp:v2
kubectl rollout status deployment/frontend
If anything misbehaves, rollback is just as simple:
kubectl rollout undo deployment/frontend
Best Practices For Resilience
- Define readiness probes to keep traffic away from unhealthy pods
- Set clear requests and limits to avoid eviction storms
- Use a rolling update strategy with
maxSurge: 1andmaxUnavailable: 1 - Label pods with version metadata for rapid filtering and diagnostics
Load Testing Scenario
A team managing a high-traffic web front end hit trouble during a flash sale. They pushed 500 RPS using Apache Bench for 5 minutes, watching 95th percentile latency climb. With pods at 200m CPU, performance creaked once they hit 250 RPS.
After bumping CPU requests to 400m and memory limits to 512Mi, they reran the test. Latencies fell by 60%, and the setup held 500 RPS rock solid. Those metrics then informed production resource allocations, balancing cost and performance.
Balancing Service types, Ingress rules, autoscaling and readiness probes will set you up for reliable, scalable deployments. You’ve now got concrete steps to expose your services, route traffic efficiently, and grow on demand.
Happy scaling and deploying!
Monitoring And Troubleshooting Common Issues
Keeping an eye on your cluster’s health isn’t optional—it’s critical. I’ve seen clusters collapse because teams lacked basic visibility into pods, nodes, and services.
I usually kick things off by installing the Prometheus Node Exporter on every node. That gives me real-time CPU, memory, and filesystem metrics to work with.
Next, I set up ServiceMonitors so Prometheus knows exactly which workloads to scrape. This step ties your app metrics into the same observability pipeline.
You might be interested in our detailed guide on Prometheus service monitoring: Check out our Prometheus Service Monitoring guide
Once metrics flow in, I install Grafana and start molding dashboards that map:
- Pod CPU and memory usage patterns (
kubectl top pods) - Request and error rates for each service
- Node-level resource consumption (
kubectl top nodes) - Alert rules keyed to threshold breaches
These visual panels make it easy to link a sudden CPU spike with an application update in real time.
Building Dashboards And Alerts
I treat dashboards as living documents. When a deployment or outage happens, I drop a quick annotation so everyone understands the context.
Organizing panels under clear, descriptive tags helps teams find the data they need in seconds. No more hunting through 20 graphs to spot a trend.
Alerts deserve the same attention. I aim for alerts that fire only when something truly matters, avoiding the dreaded “alert fatigue.”
I typically configure:
- Pod restarts above 5 in 10 minutes
- Node disk usage over 80%
- HTTP error rates exceeding 2% within a 5-minute window
Effective alerting reduces incident fatigue and speeds up response times.
Embedding runbook links and ownership details right into Grafana panels has saved our on-call team countless minutes during incidents.
The Prometheus web UI above shows a handful of time series graphs highlighting CPU and memory usage across nodes. It’s a quick way to spot resource bottlenecks before they turn into problems.
Debugging CrashLoopBackOff And Image Pull Errors
Pods stuck in CrashLoopBackOff always start with a kubectl describe pod. It surfaces recent events and hints at what went wrong.
I follow up with kubectl logs against both the main container and any init containers. Often, the error message there points me straight to a misconfigured startup script.
For ImagePullBackOff, double-check your registry credentials and confirm image tags haven’t changed. Those typos slip in more often than you’d think.
If your service or Ingress isn’t responding, I hop into a pod with kubectl exec and run curl to validate DNS and port definitions. That simple test can save hours of head-scratching.
Handling Networking Misconfigurations And RBAC Denials
Network policies can be deceptively silent when they block traffic between namespaces. I list everything with:
kubectl get networkpolicy -A
Then I tweak the YAML to open only the specific port ranges or CIDR blocks that each service needs.
RBAC issues usually show up as Forbidden responses. I inspect roles and bindings with:
kubectl get clusterrolebindings,rolebindings --all-namespaces
From there, I tighten or expand permissions to ensure a service account has precisely the privileges it needs—no more, no less.
Log Aggregation And Event Inspection
Centralized logs are a game-changer when you need to trace an error path across pods and nodes. I often recommend pairing Fluentd or Grafana Loki with Prometheus for a unified observability stack.
Filtering events by labels makes targeted troubleshooting a breeze:
kubectl get events -l app=my-service
Single pane of glass observability reduces context switching during critical incidents.
Personal Tips For Team Collaboration
Dashboards become shared knowledge when you annotate them with notes on spikes, planned maintenance, or post-mortem learnings.
I maintain a shared incident log inside our observability platform so ad-hoc discoveries aren’t lost. It’s a lifesaver when on-boarding new team members.
Consistent labels like team, env, and tier let everyone slice data the same way. And I revisit alert thresholds every quarter to keep noise in check.
With these practices, you’ll end up with a monitoring setup that’s both robust and intuitive.
Common Troubleshooting Commands
| Command | Purpose |
|---|---|
| kubectl describe pod [name] | Show pod events and status details |
| kubectl logs [pod] | View container logs |
| kubectl get events –sort-by='.lastTimestamp' | List events by time |
| kubectl top pods | Display pod resource usage |
| kubectl top nodes | Display node resource usage |
Practice these commands until they’re second nature. You’ll thank yourself when downtime strikes.
Happy monitoring and debugging your cluster!
Frequently Asked Questions
When you’re just starting with Kubernetes, certain roadblocks pop up again and again. Here are answers to the questions I see most often—so you can move forward without the guesswork.
What Is Kubernetes Used For, And How Does It Differ From Docker Alone?
Kubernetes handles orchestration across clusters—automating scaling, scheduling, and container recovery—while Docker focuses on running containers on a single node. In practice, Kubernetes schedules pods, balances traffic, and restarts services when they fail.
To recap, the core differences are:
- Scaling Automatically spins pods up or down based on demand
- Recovery Self-heals by restarting crashed containers
- Networking Built-in Services and Ingress controllers manage load and routing
How Do You Reset Or Delete A Local Cluster Safely?
Cleaning up a local environment is straightforward. Run one of these commands, and you’ll wipe the cluster state without touching your host settings:
minikube delete
kind delete cluster --name=my-cluster
You can wrap these in your CI cleanup jobs to keep pipelines tidy.
Essential Kubectl Commands
When a pod misbehaves, these commands are my go-to for a quick diagnosis:
kubectl describe pod [POD_NAME]to review events and conditionskubectl logs [POD_NAME]for container output and error messageskubectl get events --sort-by='.lastTimestamp'to see the latest cluster activitieskubectl exec -it [POD] -- /bin/shto dive into a running container
Together, they form the backbone of any rapid-fire troubleshooting session.
What Commands Expose Applications Externally?
If you need to test an app over HTTP, create a Service or forward a port:
kubectl expose deployment web --type=NodePort --port=80
kubectl port-forward svc/web 8080:80
This maps your local port to the cluster, making hits to localhost:8080 land inside your pod.
“Filtering errors with describe and logs shaves hours off debugging.”
How Does Kubernetes Differ From Docker Compose?
Docker Compose excels for single-host prototypes. Kubernetes steps up when you need multi-node scheduling, rolling updates, health checks, and self-healing across your fleet.
Key distinctions:
- Docker Compose Great for local stacks
- Kubernetes Built for production-scale clusters
Where Can Beginners Head Out Next?
- Official docs, interactive labs, forums
- Experiment with ConfigMaps and Secrets for dynamic configuration
- Try Helm charts for packaging applications
Ready to accelerate your Kubernetes journey? Connect with experienced DevOps engineers at OpsMoon now.
Leave a Reply