Welcome to your definitive technical guide for mastering the Prometheus Query Language (PromQL). This powerful functional language is the engine that transforms raw, high-volume time-series data into precise, actionable insights for system analysis, dashboarding, and alerting.
Think of PromQL not as a traditional database language like SQL, but as a specialized, expression-based language designed exclusively for manipulating and analyzing time-series data. It is the key to unlocking the complex stories your metrics are trying to tell.
What Is PromQL and Why Does It Matter?
Without PromQL, Prometheus would be a passive data store, collecting vast quantities of metrics without providing a means to interpret them. PromQL is the interactive component that allows you to query, slice, aggregate, and transform time-series data into a coherent, real-time understanding of your system's operational health.
This capability is what elevates Prometheus beyond simple monitoring tools. You are not limited to static graphs of raw metrics. Instead, you can execute complex calculations to derive service-level indicators (SLIs), error rates, and latency percentiles. For any SRE, platform, or DevOps engineer, proficiency in PromQL is the foundation for building intelligent dashboards, meaningful alerts, and a robust strategy for continuous monitoring.
A Language Built for Observability
SQL is designed for relational data in tables and rows. PromQL, in contrast, was engineered from the ground up for the specific structure of time-series data: a stream of timestamped values, uniquely identified by a metric name and a set of key-value pairs called labels.
This specialized design makes it exceptionally effective at answering the critical questions that arise in modern observability practices:
- What was the per-second request rate for my API, averaged over the last five minutes?
- What is the 95th percentile of request latency for my web server fleet?
- Which services are experiencing an error rate exceeding 5% over the last 15 minutes?
At its core, PromQL is a functional language where every query expression, regardless of complexity, evaluates to one of four types: an instant vector, a range vector, a scalar, or a string. This consistent type system is what enables the chaining of functions and operators to build sophisticated, multi-layered queries.
The Foundation of Modern Monitoring
PromQL is the foundational query language for the Prometheus monitoring system, which was open-sourced in 2015 and has since become the de facto industry standard for time-series monitoring. It is purpose-built to operate on Prometheus's time-series database (TSDB), enabling granular analysis of high-cardinality metrics. For a comprehensive look at its capabilities, you can explore the many practical PromQL examples on the official Prometheus documentation.
This guide provides a technical deep-dive into the language, from its fundamental data types and selectors to advanced, battle-tested functions and optimization strategies. By the end, you will be equipped to craft queries that not only monitor your systems but also provide the deep, actionable insights required for maintaining operational excellence. To understand how this fits into a broader strategy, review our guide on what is continuous monitoring.
Understanding PromQL's Core Building Blocks
To effectively leverage Prometheus, a firm grasp of its query language, PromQL, is non-negotiable. Think of it as learning the formal grammar required to ask your systems precise, complex questions. Every powerful query is constructed from a few foundational concepts.
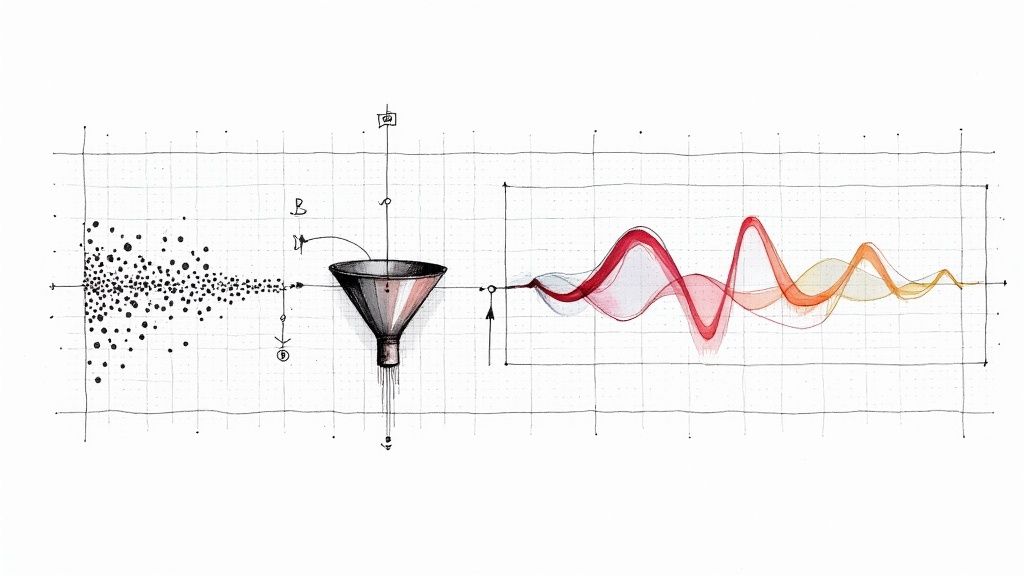
The entire observability workflow hinges on transforming a continuous stream of raw metric data into actionable intelligence. PromQL is the engine that executes this transformation.
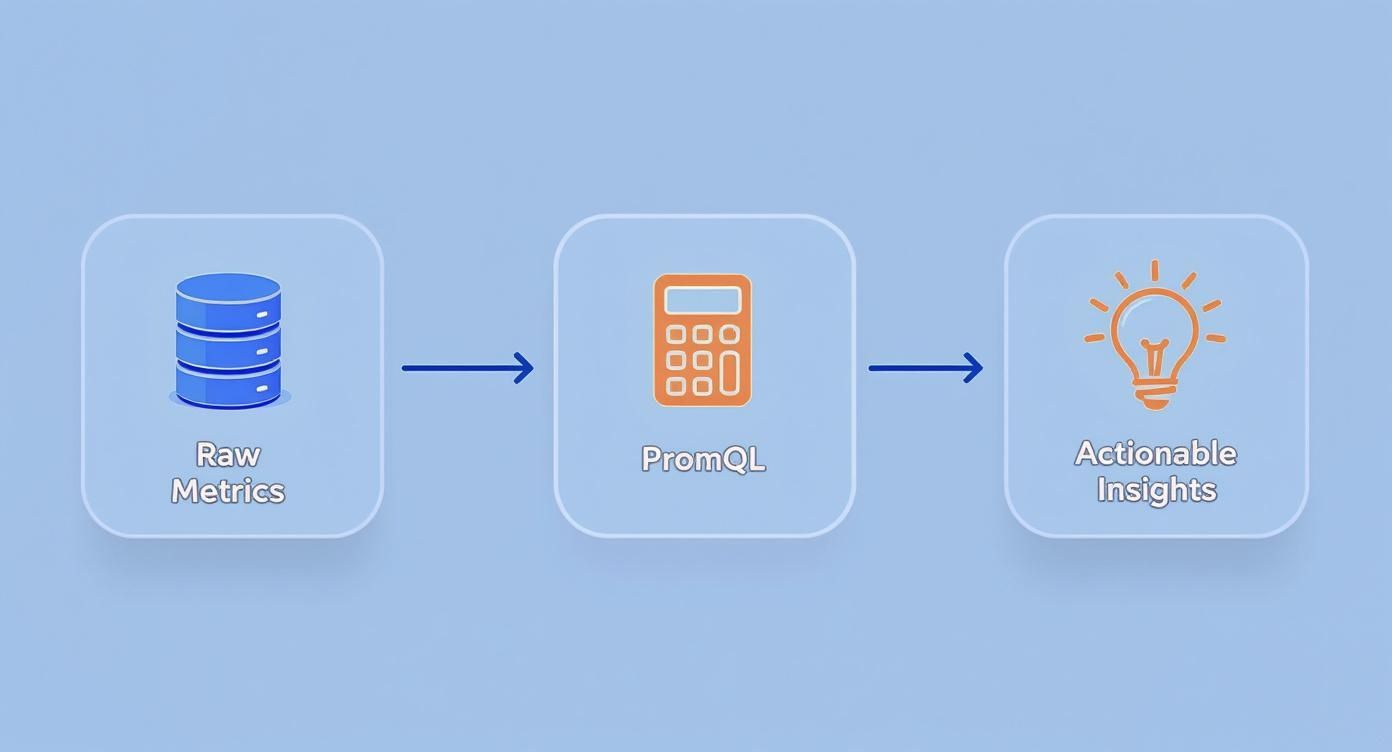
Without it, you have an unmanageable volume of numerical data. With it, you derive the insights necessary for high-fidelity monitoring and reliable alerting.
The Four Essential Metric Types
Before writing queries, you must understand the data structures you are querying. Prometheus organizes metrics into four fundamental types. Understanding their distinct characteristics is critical, as the type of a metric dictates which PromQL functions and operations are applicable.
Here is a technical breakdown of the four metric types, each designed for a specific measurement scenario.
Prometheus Metric Types Explained
| Metric Type | Description | Typical Use Case |
|---|---|---|
| Counter | A cumulative metric representing a monotonically increasing value. It resets to zero only on service restart. | Total number of HTTP requests served (http_requests_total), tasks completed, or errors encountered. |
| Gauge | A single numerical value that can arbitrarily increase or decrease. | Current memory usage (node_memory_MemAvailable_bytes), number of active connections, or items in a queue. |
| Histogram | Samples observations (e.g., request durations) and aggregates them into a set of configurable buckets, exposing them as a _bucket time series. Also provides a _sum and _count of all observed values. |
Calculating latency SLIs via quantiles (e.g., 95th percentile) or understanding the distribution of response sizes. |
| Summary | Similar to a histogram, it samples observations but calculates configurable quantiles on the client-side and exposes them directly. | Used for client-side aggregation of quantiles, though histograms are generally preferred for their server-side aggregation flexibility and correctness. |
Mastering these types is the first step. Counters are for cumulative event counts, Gauges represent point-in-time measurements, and Histograms are essential for calculating accurate quantiles and understanding data distributions.
Instant Vectors Versus Range Vectors
This next concept is the most critical principle in PromQL. A correct understanding of the distinction between an instant vector and a range vector is the key to unlocking the entire language.
An instant vector is a set of time series where each series has a single data point representing the most recent value at a specific evaluation timestamp. When you execute a simple query like http_requests_total, you are requesting an instant vector—the "now" value for every time series matching that metric name.
A range vector, conversely, is a set of time series where each series contains a range of data points over a specified time duration. It represents a window of historical data. You create one using a range selector in square brackets, such as http_requests_total[5m], which fetches all recorded data points for the matching series within the last five minutes.
The distinction is simple but profound: instant vectors provide the current state, while range vectors provide historical context. A range vector cannot be directly graphed as it contains multiple timestamps per series. It must be passed to a function like
rate()oravg_over_time()which aggregates the historical data into a new instant vector, where each output series has a single, calculated value.
Targeting Data With Label Selectors
A metric name like http_requests_total alone identifies a set of time series. Its true power is realized through labels—key-value pairs such as job="api-server" or method="GET"—which add dimensionality and context, turning a flat metric into a rich, queryable dataset.
PromQL's label selectors are the mechanism for filtering this data with surgical precision. They are specified within curly braces {} immediately following the metric name.
Here are the fundamental selector operators:
-
Exact Match (
=): Selects time series where a label's value is an exact string match.http_requests_total{job="api-server", status="500"} -
Negative Match (
!=): Excludes time series with a specific label value.http_requests_total{status!="200"} -
Regex Match (
=~): Selects series where a label's value matches a RE2 regular expression.http_requests_total{status=~"5.."}(Selects all 5xx status codes) -
Negative Regex Match (
!~): Excludes series where a label's value matches a regular expression.http_requests_total{path!~"/healthz|/ready"}
Mastering the combination of a metric name and a set of label selectors is the foundation of every PromQL query. Whether you are constructing a dashboard panel, defining an alert, or performing ad-hoc analysis, it all begins with precise data selection.
Unlocking PromQL Operators and Functions
Once you have mastered selecting time series, the next step is to transform that data into meaningful information using Prometheus Query Language's rich set of operators and functions. These tools allow you to perform calculations, combine metrics, and derive new insights that are not directly exposed by your instrumented services. They are the verbs of PromQL, converting static data points into a dynamic narrative of your system's behavior.
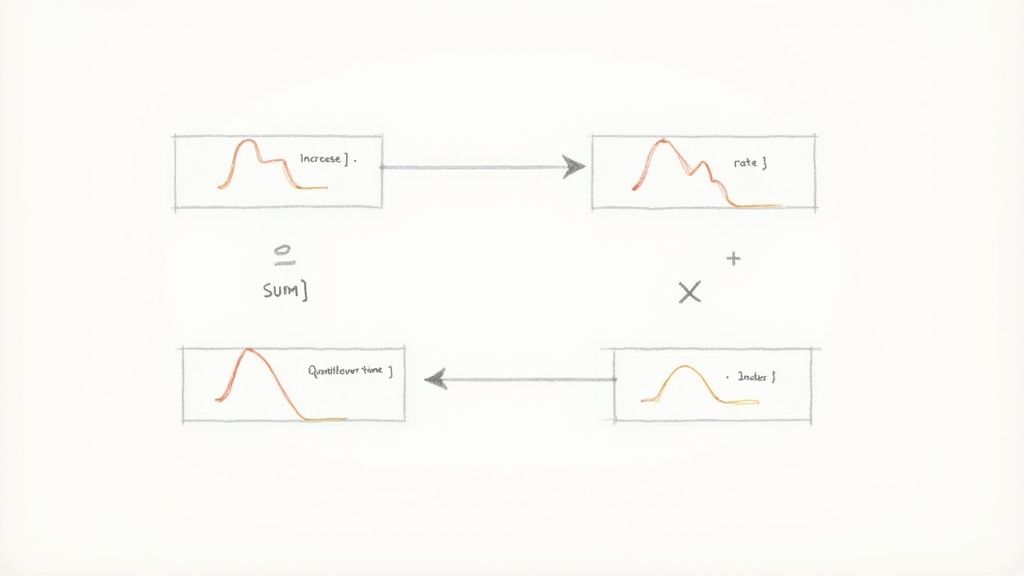
This process involves a logical progression from raw data, such as a counter's increase, to a more insightful metric like a per-second rate. From there, you can aggregate further into high-level views like a quantile_over_time to verify Service Level Objectives (SLOs).
Let's dissect the essential tools for this transformation, starting with the fundamental arithmetic that underpins most queries.
Performing Calculations with Arithmetic Operators
PromQL supports standard arithmetic operators (+, -, *, /, %, ^) that operate between instant vectors on a one-to-one basis. This means Prometheus matches time series with the exact same set of labels from both the left and right sides of the operator and then performs the calculation for each matching pair.
For example, to calculate the ratio of HTTP 5xx errors to total requests, you could write:
# Calculate the ratio of 5xx errors to total requests, preserving endpoint labels
sum by (job, path) (rate(http_requests_total{status=~"5.."}[5m]))
/
sum by (job, path) (rate(http_requests_total[5m]))
This works perfectly when the labels match. However, when they don't, you must use vector matching clauses like on() and ignoring() to explicitly control which labels are used for matching. For many-to-one or one-to-many matches, you must also use group_left() or group_right() to define cardinality.
Filtering Results with Logical Operators
Logical operators (and, or, unless) are used for advanced set-based filtering. Unlike arithmetic operators that calculate new values, these operators filter a vector based on the presence of matching series in another vector.
vector1 and vector2: Returns elements fromvector1that have a matching label set invector2.vector1 or vector2: Returns all elements fromvector1plus any fromvector2that do not have a matching label set invector1.vector1 unless vector2: Returns elements fromvector1that do not have a matching label set invector2.
A practical application is to find high-CPU processes that are also exhibiting high memory usage, thereby isolating resource-intensive applications.
Essential Functions for Counter Metrics
Counters are the most prevalent metric type, but their raw, cumulative value is rarely useful for analysis. You need functions to derive their rate of change. The three primary functions for this are rate(), irate(), and increase().
Key Takeaway: The primary difference between
rate()andirate()is their calculation window.rate()computes an average over the entire time range, providing a smoothed, stable value ideal for alerting.irate(), in contrast, uses only the last two data points, making it highly responsive but volatile, and thus better suited for high-resolution graphing of rapidly changing series.
rate(v range-vector): This is the workhorse function for counters. It calculates the per-second average rate of increase over the specified time window. It is robust against scrapes being missed and is the recommended function for alerting and dashboards.# Calculate the average requests per second over the last 5 minutes rate(http_requests_total{job="api-server"}[5m])irate(v range-vector): This calculates the "instantaneous" per-second rate of increase using only the last two data points in the range vector. It is more responsive to sudden changes but can be noisy and should be used cautiously for alerting.# Calculate the instantaneous requests per second irate(http_requests_total{job="api-server"}[5m])increase(v range-vector): This calculates the total, absolute increase of a counter over the specified time range. It is essentiallyrate(v) * seconds_in_range. Use this when you need the total count of events in a window, not the rate.# Calculate the total number of requests in the last hour increase(http_requests_total{job="api-server"}[1h])
Aggregating Data into Meaningful Views
Analyzing thousands of individual time series is impractical. Aggregation operators are used to condense many series into a smaller, more meaningful set.
Common aggregation operators include:
sum(): Calculates the sum over dimensions.avg(): Calculates the average over dimensions.count(): Counts the number of series in the vector.topk(): Selects the top k elements by value.quantile(): Calculates the φ-quantile (e.g., 0.95 for the 95th percentile) over dimensions.
The by and without clauses provide control over grouping. For example, sum by (job) aggregates all series, preserving only the job label.
# Calculate the 95th percentile of API request latency over the last 10 minutes, aggregated by endpoint path
histogram_quantile(0.95, sum(rate(http_request_duration_seconds_bucket[10m])) by (le, path))
This final example demonstrates PromQL's expressive power, chaining selectors, functions, and operators. It transforms a raw histogram metric into a precise SLI, answering a critical question about system performance.
Advanced PromQL Techniques
Moving beyond basic operations is where PromQL transforms from a simple query tool into a comprehensive diagnostic engine for your entire infrastructure. This is where you master advanced aggregation, subqueries, and rule evaluation to proactively identify and diagnose complex issues before they impact users.
The following techniques are standard practice for any SRE or DevOps engineer responsible for building a robust, scalable monitoring solution. They enable the precomputation of expensive queries, the creation of intelligent, low-noise alerts, and multi-step calculations that uncover deep insights into system behavior.
Fine-Tuning Aggregation with by and without
We've seen how operators like sum() and avg() can aggregate thousands of time series into a single value. However, for meaningful analysis, you often need more granular control. The by (...) and without (...) clauses provide this control.
These clauses modify the behavior of an aggregation operator, allowing you to preserve specific labels in the output vector.
by (label1, label2, ...): Aggregates the vector, but preserves the listed labels in the result. All other labels are removed.without (label1, label2, ...): Aggregates the vector, removing the listed labels but preserving all others.
For example, to calculate the total HTTP request rate while retaining the breakdown per application instance, the by (instance) clause is used:
# Get the total request rate, broken down by individual instance
sum by (instance) (rate(http_requests_total[5m]))
This query aggregates away labels like method or status_code but preserves the instance label, resulting in a clean, per-instance summary. This level of precision is critical for building dashboards that tell a clear story without being cluttered by excessive dimensionality.
Unleashing the Power of Subqueries
Subqueries are one of PromQL's most advanced features, enabling you to run a query over the results of another query. This allows for two-step calculations that are impossible with a standard query.
A subquery first evaluates an inner query as a range vector and then allows an outer function like rate() or max_over_time() to be applied to that intermediate result. The syntax is <instant_vector_query>[<duration>:<resolution>].
A subquery facilitates a nested time-series calculation. First, an inner query is evaluated at regular steps over a duration. Then, an outer function operates on the resulting range vector. This is ideal for answering questions like, "What was the maximum 5-minute request rate over the past day?"
Consider a common SRE requirement: "What was the peak 95th percentile API latency at any point in the last 24 hours?" A standard query can only provide the current percentile. A subquery solves this elegantly:
# Calculate the maximum 95th percentile latency observed over the past 24 hours, evaluated every minute
max_over_time(
  (histogram_quantile(0.95, sum(rate(api_latency_seconds_bucket[5m])) by (le)))[24h:1m]
)
The inner query histogram_quantile(...) calculates the 5-minute 95th percentile latency. The subquery syntax [24h:1m] executes this calculation for every minute over the last 24 hours, producing a range vector. Finally, the outer max_over_time() function scans this intermediate result to find the single highest value.
Automating with Recording and Alerting Rules
Executing complex queries ad-hoc is useful for investigation, but it is inefficient for dashboards and alerting. This repeated computation puts unnecessary load on Prometheus. Recording rules and alerting rules are the solution.
Recording rules precompute frequently needed or expensive queries. Prometheus evaluates the expression at a regular interval and saves the result as a new time series. Dashboards and other queries can then use this new, lightweight metric for significantly faster performance.
For example, a recording rule can continuously calculate the average CPU usage across a cluster:
# rules.yml
groups:
- name: cpu_rules
  rules:
  - record: instance:node_cpu:avg_rate5m
    expr: avg by (instance) (rate(node_cpu_seconds_total{mode="idle"}[5m]))
Alerting rules, conversely, are the core of proactive monitoring. A PromQL expression defines a failure condition. Prometheus evaluates it continuously, and if the expression returns a value (i.e., the condition is met) for a specified duration (for), it fires an alert.
This example alert predicts if a server's disk will be full in the next four hours:
- alert: HostDiskWillFillIn4Hours
  expr: predict_linear(node_filesystem_free_bytes{fstype!~"tmpfs"}[1h], 4 * 3600) < 0
  for: 10m
  labels:
    severity: warning
  annotations:
    summary: "Host disk is predicted to fill up in 4 hours (instance {{ $labels.instance }})"
    description: "Filesystem {{ $labels.mountpoint }} on {{ $labels.instance }} is projected to run out of space."
These rules transform PromQL from an analytical tool into an automated infrastructure defense system, a core principle of effective infrastructure monitoring best practices.
Industry data validates this trend. A recent survey shows that by 2025, over 50% of observability engineers report increased reliance on Prometheus and PromQL. This adoption highlights its critical role in managing the complexity and high-cardinality data of modern cloud-native architectures.
Writing High-Performance PromQL Queries
A powerful query is only effective if it executes efficiently. In a production environment, a poorly constructed PromQL expression can easily overload a Prometheus server, resulting in slow dashboards, delayed alerts, and significant operational friction. Writing high-performance PromQL is a critical skill for maintaining a reliable monitoring system.
This section focuses on query performance optimization, covering common anti-patterns and actionable best practices for writing lean, fast, and scalable queries.

Identifying Common Performance Bottlenecks
Before optimizing, one must first identify common performance bottlenecks. Certain PromQL patterns are notorious for high consumption of CPU, memory, and disk I/O. As metric volume and cardinality grow, these inefficiencies can lead to systemic performance degradation.
Be vigilant for these classic performance pitfalls:
- Unselective Label Matching: A query like
api_http_requests_totalwithout specific label selectors forces Prometheus to load every time series for that metric name into memory before processing. This "series explosion" is a primary cause of server overload. - Expensive Regular Expressions: Using a broad regex like
{job=~".*-server"}on a high-cardinality label forces Prometheus to execute the pattern match against every unique value for that label, leading to high CPU usage. - Querying Large Time Ranges: Requesting raw data points over extended periods (days or weeks) without aggregation necessitates fetching and processing a massive volume of samples from the on-disk TSDB.
These issues often have a compounding effect. A single inefficient query on a frequently refreshed Grafana dashboard can create a "query of death" scenario, impacting the entire monitoring infrastructure.
Best Practices for Lean and Fast Queries
Writing efficient PromQL is an exercise in precision. The primary objective is to request the absolute minimum amount of data required to answer a question, thereby reducing the load on the Prometheus server and ensuring responsive dashboards and alerts. For a comprehensive look at optimizing system efficiency, including query performance, refer to this detailed guide on performance engineering.
Incorporate these key strategies into your workflow:
- Be Specific First: Always start with the most restrictive label selectors possible. A query like
rate(api_http_requests_total{job="auth-service", env="prod"}[5m])is orders of magnitude more efficient than one without selectors. - Anchor Regular Expressions: When a regex is unavoidable, anchor it to the start (
^) or end ($) of the string where possible.job=~"^api-server"is significantly more performant thanjob=~".*api-server". - Utilize Recording Rules: For complex or slow queries that are used frequently (e.g., on key dashboards or in multiple alerts), precompute their results with recording rules. This shifts the computational load from query time to scrape time, drastically improving dashboard load times.
Your primary optimization strategy should always be to reduce the number of time series processed by a query at each stage. The fewer series Prometheus must load from disk and hold in memory, the faster the query will execute. This is the fundamental principle of PromQL performance tuning.
The Impact of Architecture on Query Speed
Query performance is not solely a function of PromQL syntax; it is deeply interconnected with the underlying Prometheus architecture. Decisions regarding data collection, storage, and federation have a direct and significant impact on query latency.
Consider these architectural factors:
- Scrape Interval: A shorter scrape interval (e.g., 15 seconds) provides higher resolution data but also increases the number of samples stored. Queries over long time ranges will have more data points to process.
- Data Retention: A long retention period is valuable for historical analysis but increases the on-disk data size. Queries spanning the full retention period will naturally be slower as they must read more data blocks.
- Cardinality: The total number of unique time series is the single most critical factor in Prometheus performance. Actively managing and avoiding high-cardinality labels is essential for maintaining a healthy and performant instance. For expert guidance on architecting and managing your observability stack, consider specialized Prometheus services.
At scale, Prometheus performance is bound by system resources. Benchmarks show it can average a disk I/O of 147 MiB/s, with complex query latencies around 1.83 seconds. These metrics underscore the necessity of optimization at every layer of the monitoring stack.
Answering Common PromQL Questions
PromQL is exceptionally powerful, but certain concepts can be challenging even for experienced engineers. This section addresses some of the most common questions and misconceptions to help you troubleshoot more effectively and build more reliable monitoring.
What's the Real Difference Between rate() and irate()?
This is a frequent point of confusion. Both rate() and irate() calculate the per-second rate of increase for a counter, but their underlying calculation methods are fundamentally different, leading to distinct use cases.
rate() provides a smoothed, stable average. It considers all data points within the specified time window (e.g., [5m]) to calculate the average rate over that entire period. This averaging effect makes rate() the ideal function for alerting and dashboards. It is resilient to scrape misses and won't trigger false positives due to minor, transient fluctuations.
irate(), in contrast, provides an "instantaneous" rate. It only uses the last two data points within the time window for its calculation. This makes it highly sensitive and prone to spikes. While useful for high-resolution graphs intended to visualize rapid changes, it is a poor choice for alerting due to its inherent volatility.
How Do I Handle Counter Resets in My Queries?
The good news: PromQL handles this for you automatically. Functions designed to operate on counters—rate(), irate(), and increase()—are designed to be robust against counter resets.
When a service restarts, its counters typically reset to zero. When PromQL's rate-calculation functions encounter a value that is lower than the previous one in the series, they interpret this as a counter reset and automatically adjust their calculation. This built-in behavior ensures that your graphs and alerts remain accurate even during deployments or service restarts, preventing anomalous negative rates.
Why Is My PromQL Query Returning Nothing?
An empty result set from a query is a common and frustrating experience. The cause is usually a simple configuration or selection error. Systematically checking these common issues will resolve the problem over 90% of the time.
- Is the Time Range Correct? First, verify the time window in your graphing interface (e.g., Grafana, Prometheus UI). Are you querying a period before the metric was being collected?
- Any Typos in the Selector? This is a very common mistake. A typographical error in a metric name or label selector (e.g.,
stautsinstead ofstatusor"prod"instead of"production") will result in a selector that matches no series. Meticulously check every character. - Is There Data at This Exact Timestamp? An instant query (via the
/api/v1/queryendpoint) requires a data sample at the precise evaluation timestamp. If the last scrape was just before this timestamp, the result will be empty. To diagnose this, run a range query over a short period (e.g.,my_metric[1m]) to see if the time series exists within that window. - Is the Target Up and Scraped? Navigate to the "Targets" page in the Prometheus UI. If the endpoint responsible for exposing the metric is listed as 'DOWN', Prometheus cannot scrape it, and therefore, no data will be available to query.
By methodically working through this checklist, you can quickly identify and resolve the root cause of an empty query result.
Ready to implement a rock-solid observability strategy without the overhead? At OpsMoon, we connect you with elite DevOps engineers who can design, build, and manage your entire monitoring stack, from Prometheus architecture to advanced PromQL dashboards and alerts. Start with a free work planning session and let's map out your path to operational excellence.
Leave a Reply